-
-
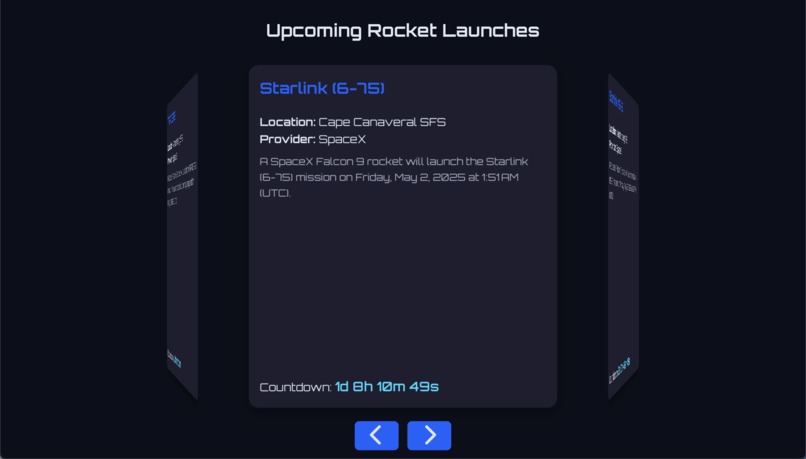
Initial Display (Basic Mission Data)
-
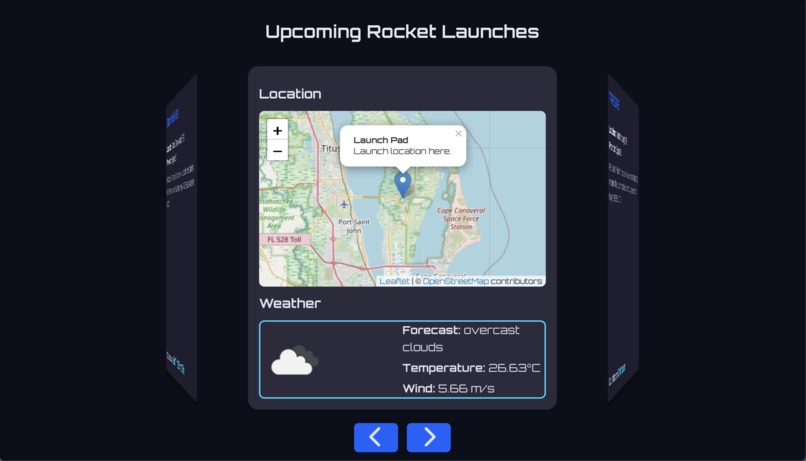
Location and Atmospheric Conditions Display


Inspiration
As a space-exploration enthusiast, I wanted to create an interface whereby I can track and monitor upcoming missions, with a primary focus on launch sites.
What it does
space_graphs is a simple and intuitive interface that uses APIs to query and display data on upcoming space missions, providing launch conditions and locations.
How we built it
I built this app using simple HTML, CSS, and Javascript, with flask for the server and a few REST APIs.
Challenges we ran into
At first I wanted to build this app to track only SpaceX missions, but as I explored documentation and experimented with a few endpoints, I realized that these public APIs had not been well maintained and contained outdated values. So I decided to switch to using RocketLaunch.Live, which provided my application with current data to optimize the user experience.
Accomplishments that we're proud of
I have never used so many different APIs in a single application before (and honestly you can tell by the latency that it was a little too much), so that was cool for me to learn about integrating these various calls into my backend.
What we learned
I learned a lot about Javascript animations by building the carousel to display the data. I also learned a lot about using external APIs.
What's next for space_graphs
The interface is pretty basic as of the current moment, and so I think that adding a search functionality and maybe a livestream option would be really cool.

Log in or sign up for Devpost to join the conversation.