-
-
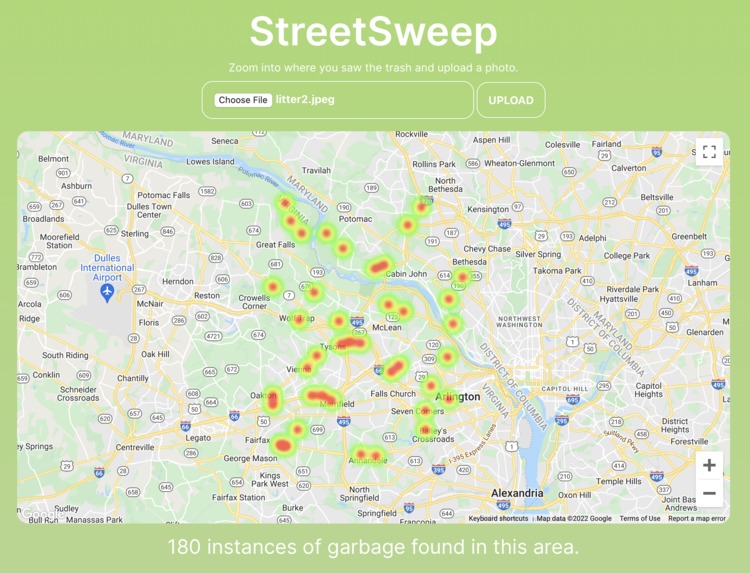
Heatmap Concept Image. This displays the volume of garbage reports by location.
-
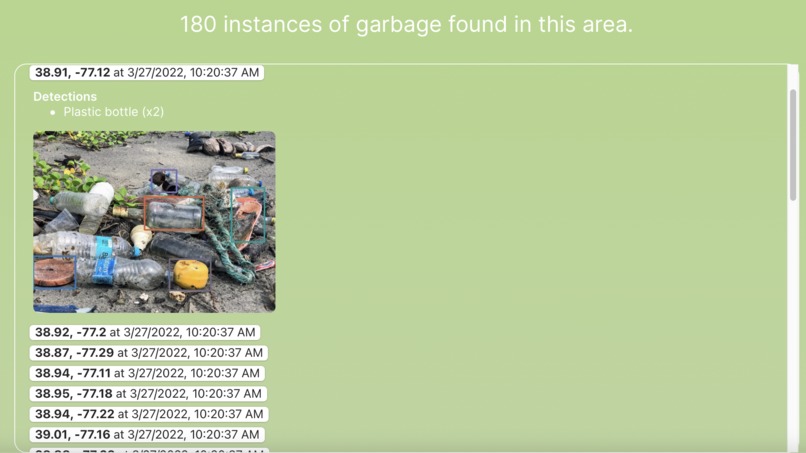
Understanding Individual Submissions of Garbage. The list of reports is filtered based on the viewport of the map.


Inspiration
We felt that there was too much trash on the street. To help curb the problem of littering, we built StreetSweeper – an app that passively collects garbage analytics from cities around the world.
What it does
StreetSweep uses computer vision and machine learning to give governments and volunteer organizations access to quantifiable information about the volume and composition of littering around the world. The images can come from anywhere - even pictures taken from fast-moving vehicles. Anyone who visits the website is able to see a public board of where trash is in their area. Our hope is that this enables concentrated efforts to reduce the amount of trash on the streets through the increased information flow.
You can monitor how many reports of garbage there have been in each area, as well as gain quantifiable estimates for what percentage of that garbage was recyclable, how much was biodegradable, and how much needed to go directly to a landfill. The list of reports is filtered based on the viewport of the map.
How we built it
When a user submits an image, it is uploaded to our Flask server, which triggers the machine learning that classifies the trash in each image. Because we had a difficult time finding a complete and well-balanced dataset for locating garbage, we decided to adapt an existing network, a ResNet-101 classifier pretrained on the ImageNet dataset that runs on PyTorch, to work with a model that generated bounding boxes for generic objects. First, the image is sent to the generic object detector. This is blind to the type of object it detects – it simply chooses bounding boxes for regions that are likely to belong to the same object. Then, those bounding boxes are cropped, and then classified using the ResNet-101.
After we generate and classify the objects in each image, we make an annotated report using OpenCV’s graphics tools, persist it to the disk, and make it publicly available via the API. Each report is stored with a corresponding timestamp and geolocation, so we can render the volume of reports for each location on a heatmap as well as when those reports were filed. Below the heatmap, we have a responsive list that automatically updates to show the reports for the area in the view of the map, which we made using React. We also display the bounding boxes and annotations for each report so users can understand what the model is detecting and crowdsource human-authored annotations for each image. We made the heatmap with the Google Cloud Maps API.
Challenges we ran into
We had trouble finding a well-annotated dataset on garbage. The closest thing to what we needed only had 10 well-annotated classes. We decided to supplement our original dataset with ImageNet, a model with thousands of classes. However, we could find no public object detection models with the versatility of ImageNet. So, we used a generic object detection network to detect candidate objects, and then classified those candidate objects with ImageNet to mimic the ability to perform object segmentation at a fraction of the compute time and without needing to train another model.
What's next for StreetSweep
In the future, we plan to expand StreetSweep by using local drone surveillance to mark down areas where trash is present. We also want to use a better-annotated dataset or create one ourselves. Potentially, the images collected by StreetSweep contributors could be used as a rolling dataset and be annotated by human volunteers to enable StreetSweep’s garbage detection recall and accuracy to improve over time.
Built With
- class-agnostic-object-detection
- computer-vision
- flask
- google-maps
- image-classification
- javascript
- opencv
- python
- pytorch
- react


Log in or sign up for Devpost to join the conversation.