-
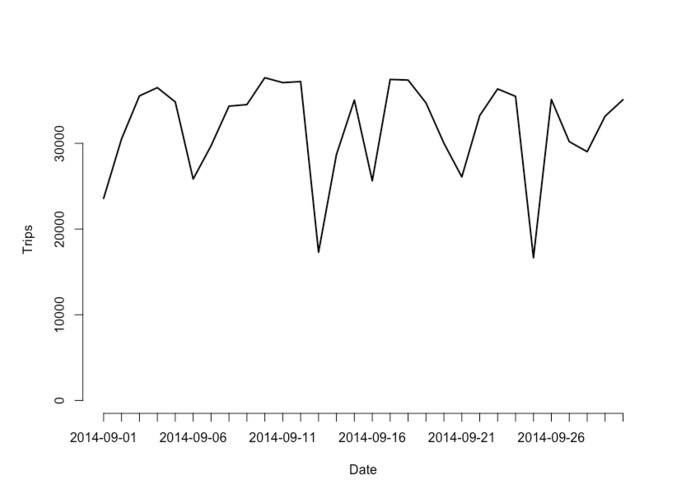
citibike trips
-
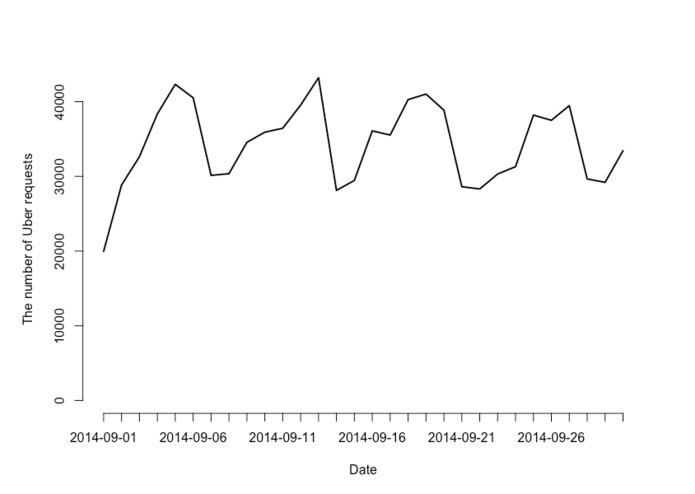
uber requests
-
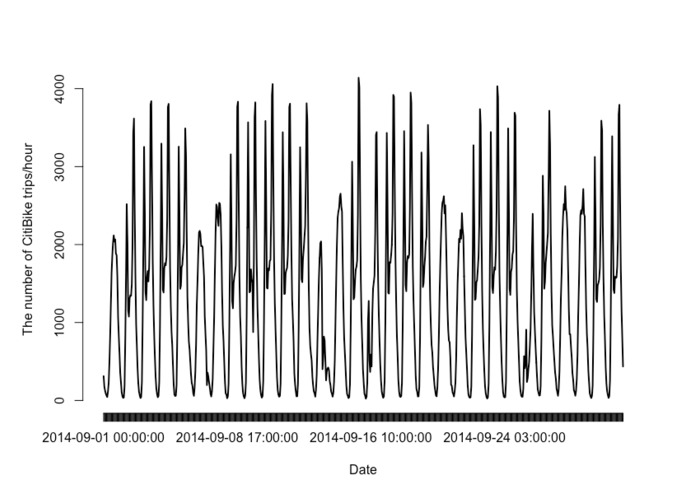
citibike trips/hr
-
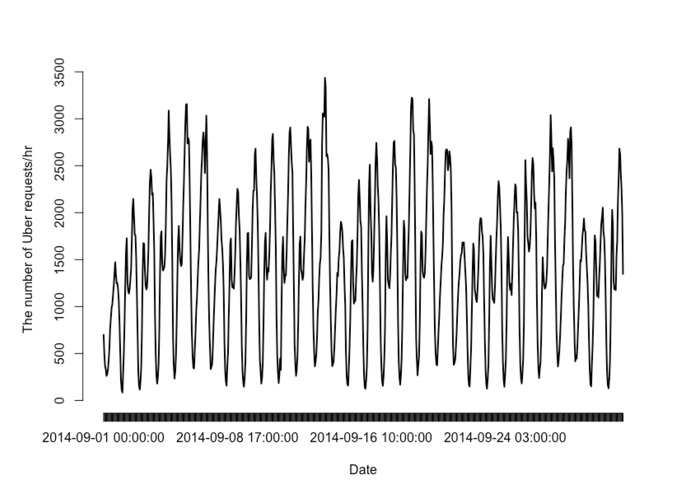
uber requests/hr


The github link is a plotly graph that was made to show the location data of nyc green taxis hourly in september 2014. The graph that shows yellow taxis, green taxis, ubers, and bikes was unable to be completed due to my computers lack of physical memory.
The graphs are uber and citibike data.

Log in or sign up for Devpost to join the conversation.