-
-
Project Unpollute
-
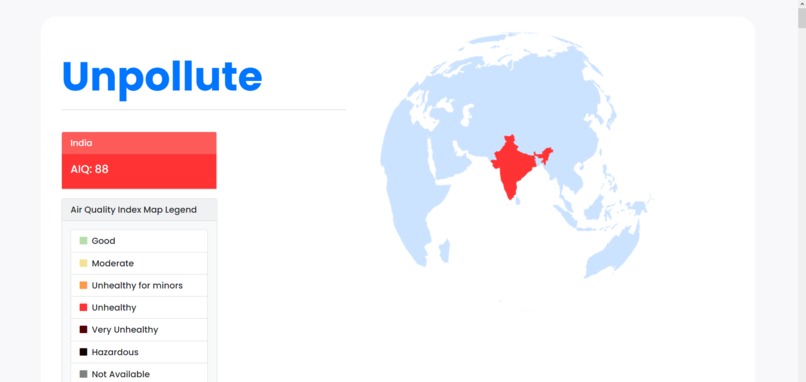
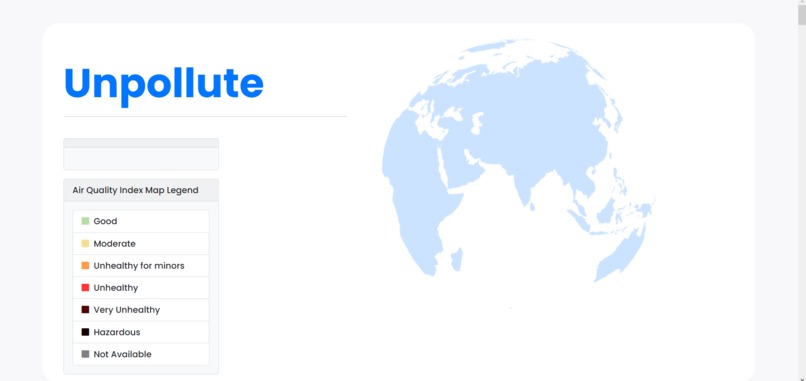
3D dynamic and scrollable AQI rendering globe.
-
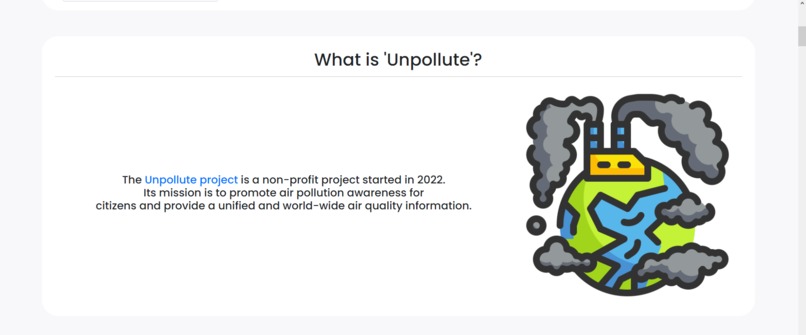
About Unpollute
-
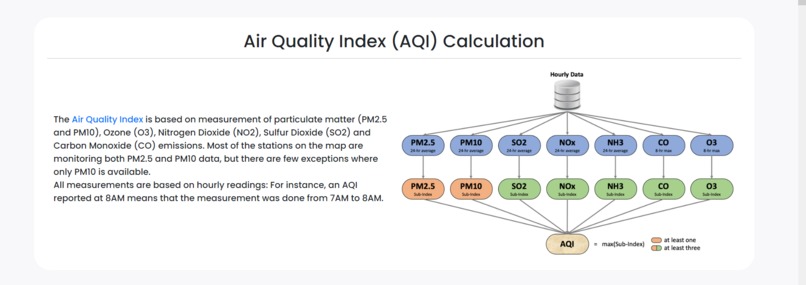
AQI constant calculation
-
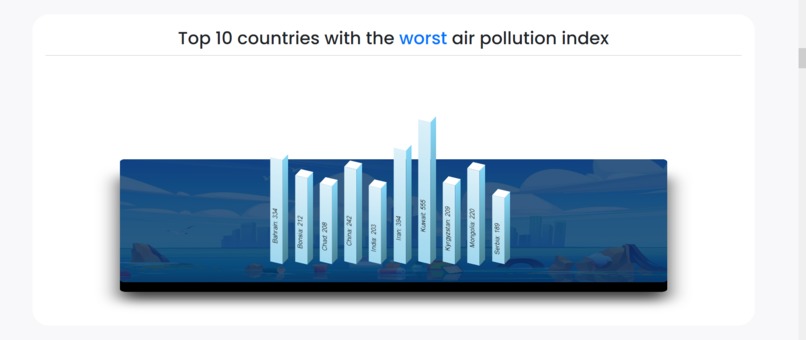
3D bar chart of 'top 10 worst AQIs'
-
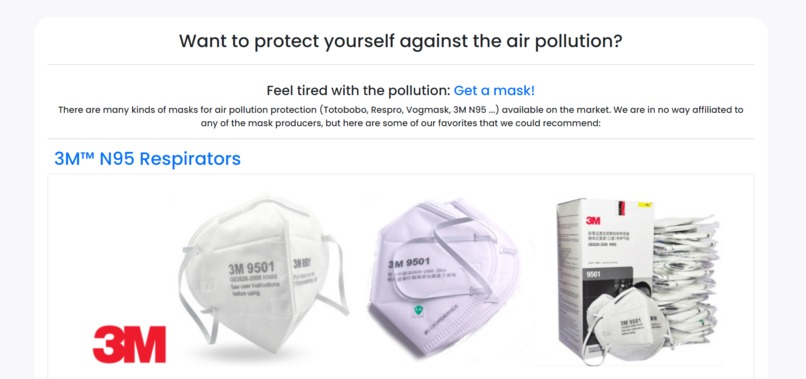
Masks information
-
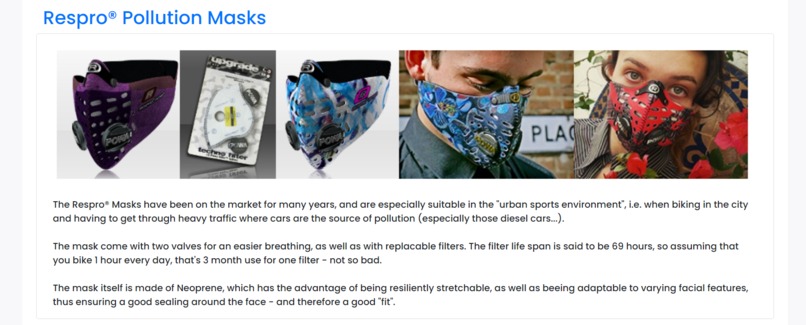
Masks information
-
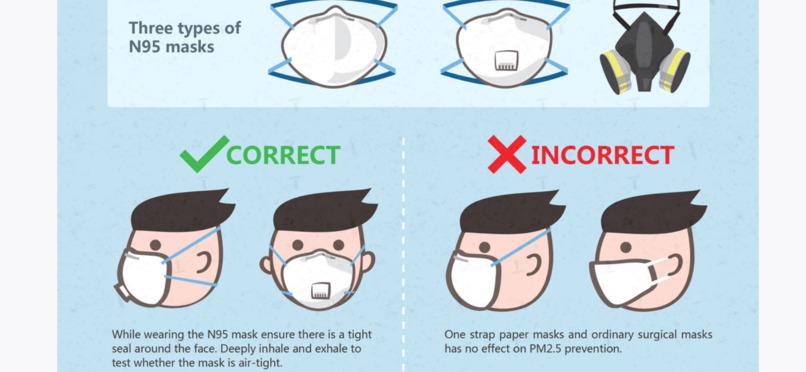
Pictorial explanation about safety measures.
-
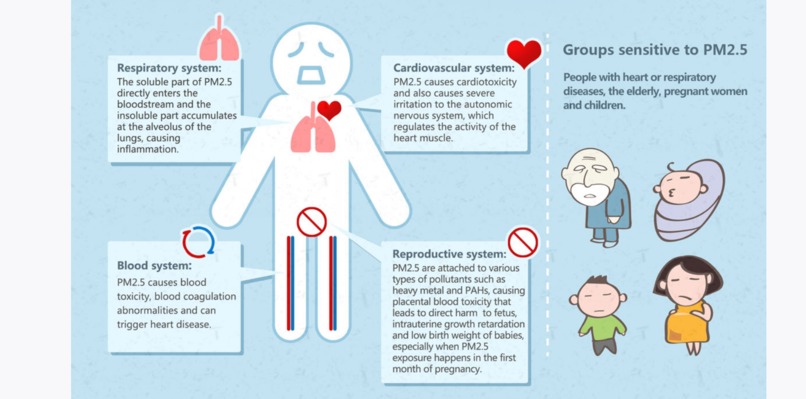
Pictorial explanation about harmful consequences
-
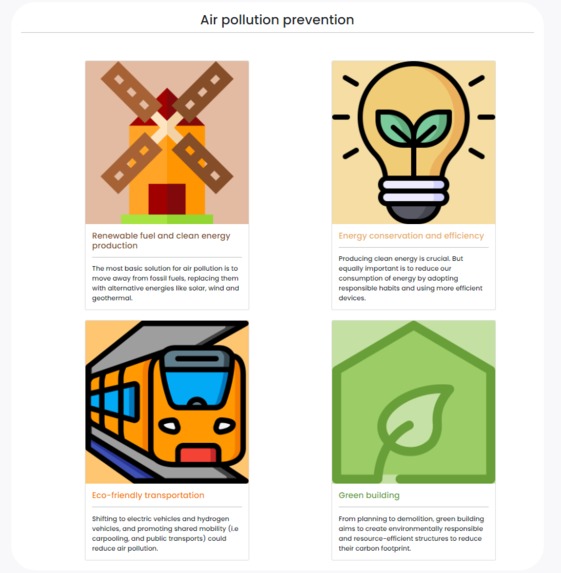
Pollution prevention methods.


Inspiration
Nowadays people tend to ignore the current level of toxic contamination in the air that we breathe daily. The Unpollute project is a non-profit project. Its mission is to promote air pollution awareness for citizens and provide a unified and world-wide air quality information. So here it is, a progressive web application which would help us to do so.
What it does
Now talking about how it works, I have added multiple data representation formats to display the air quality indexes for several manners which would include a three dimensional model of planet earth which keeps rotating on an axis and when the mouse cursor is hovered on any part of the world the color of that particular nation would change according to the level of air pollution contamination in that country, along with this the air quality index value is also updated in a container whose color changes according to the AIQ (Air Quality Index) constant as well. Apart from the 3D globe, a 3D animated bar chart is also included which represents 'top 10 countries with worst AIQs'. Apart from the data representation methods, this project also includes detailed information about masks which could be used by people to protect themselves. Also, a pictorial representation of harmful pollution consequences and prevention measures is also added.
How we built it
I built it using HTML, CSS, Vanilla Javascript, D3 libraries, JSON/TSV integrations, Firebase integration and other helpful CSS libraries.
Challenges we ran into
Some of the challenges which I ran into would include:
- Finding the proper dataset for each country.
- Setting the dimensions of sphere in such a manner that correct name of the country must be displayed on every hover.
- One of the most difficult challenge here was the time constraint oh this hackathon but I somehow managed to wrap all of this before the deadline.
Accomplishments that we're proud of
Some of the accomplishment which I would be proud of would be hopping out of my comfort zone and trying some new tech bucket like D3.js integration and coming up with such awesome dynamic animations.
What we learned
- About the current air pollution situation at a global level
- D3 library integration.
- Air contamination prevention measures.
- Self protecting measures.
What's next for Unpollute
There is some future scope for this project and it would consist of
- Improvising the data set and not just focusing country wise but at city level.
- Adding some more text about frequently asked questions over global air quality.


Log in or sign up for Devpost to join the conversation.