-
-
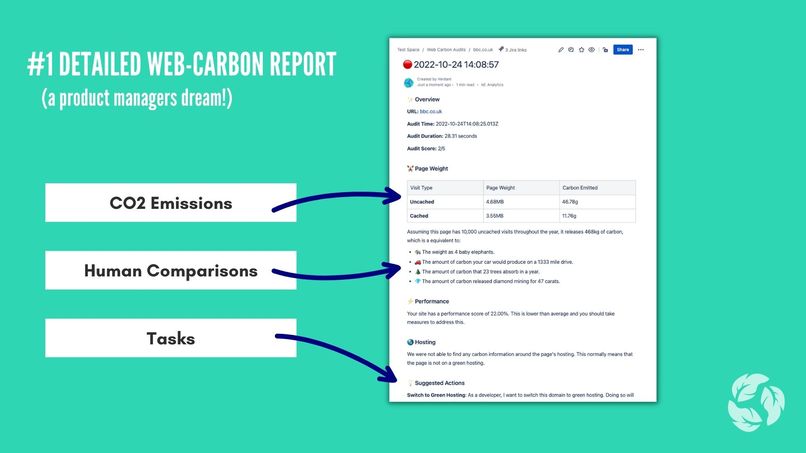
A highly detailed carbon report for product managers.
-
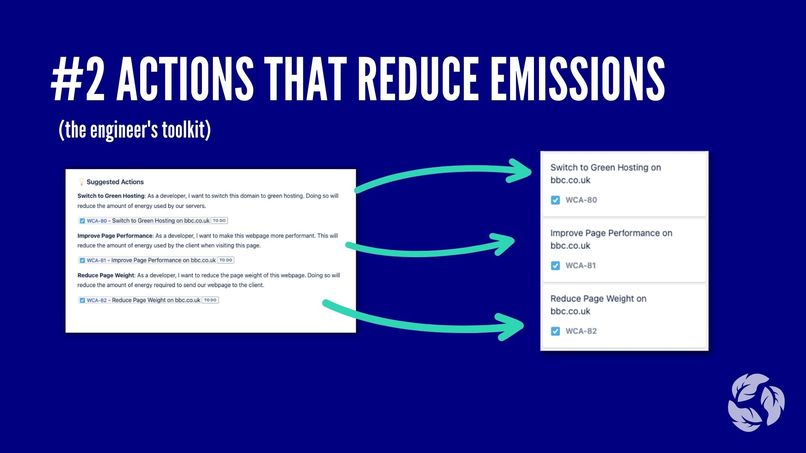
Automatic ticket creation for your engineers!
-
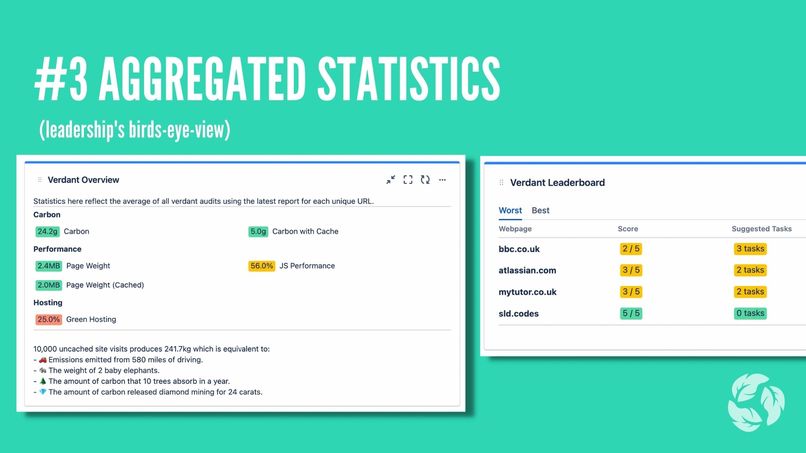
Dashboard widgets for a birds-eye view. Perfect for leadership.
-
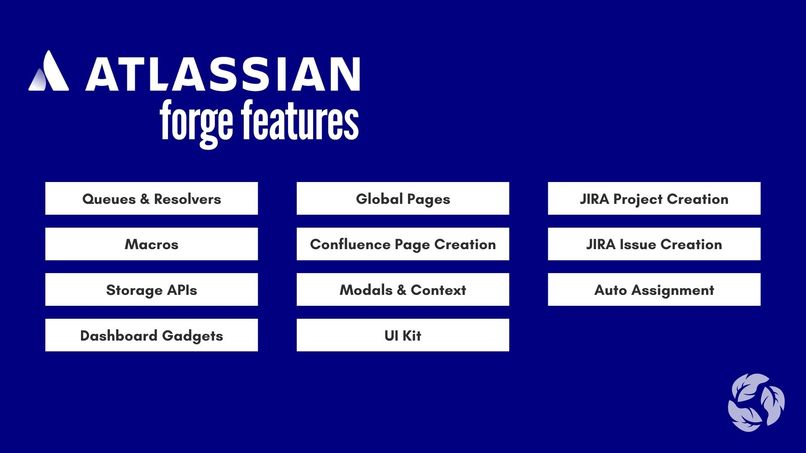
The forge features used.


Verdant makes reducing carbon-emissions a team sport
The internet emits 1.6 billion annual tons of greenhouse gas emissions (BBC). Every single click is energy-hungry 🐛 so we need to be doing more as businesses to create a greener digital space, and reduce our contribution to the problem! There is an ever-growing expectation for businesses to prioritise green-thinking and reduce carbon emissions, but this problem is not solved by single individuals or by awareness alone. We believe everyone in the team should be leading the charge. Verdant helps a team understand the carbon footprint of their website, by unearthing the problem areas and providing easy solutions. It serves three key personas within the team, to ensure everyone has their chance to make an impact: #1 product managers, #2 engineers, #3 leadership
![]()
⚡️ Quick Links
🔨 Our Team
Bronte Larsen-Disney ( The Design Whizz ⚡️ ): Marketeer working in Music Publishing. This is her first hackathon! Sam Larsen-Disney ( The Tech Guy 💻 ): Software Engineer with a Front-end Focus.
🤩 What it does
Verdant provides a tool-kit 🧰 to enable tech teams to work together to stop their growing digital carbon footprint.
1️⃣ UNEARTH
For product managers, Verdant produces a detailed report that breaks down the carbon usage of any given URL. It identifies:
- A Green Score: a score out of 5 highlighting how green your webpage is.
- Carbon Produced: a carbon estimate for both cached and uncached visits.
- Green Hosting: whether the site is hosted on a green hosting provider or not.
- Page Weight: the larger the page, the more data that must be transferred and the energy required.
- Performance: the less performant, the more energy required by the client to run the webpage.
- Tangible Human Comparisons: to help make sense of the impact your webpage has on the planet
- Suggested Actions: identifies the improvements that will make the biggest difference to your site’s green score.
This report automatically generates within Confluence along with page hierarchy that makes reports easy to navigate.
2️⃣ SOW SEEDS
We’ve created a collection of dashboard widgets that make it easy for any leadership team to immediately understand how their organisations are performing. This includes access to an overview of all team reports with key aggregated statistics so they can make more informed decisions about areas that require focus.
3️⃣ GROW
The Verdant application takes the report in Confluence and automatically adds Jira tickets with actionable tasks to a web-carbon project board. This gives engineers a great sense of direction of how they can work towards a greener digital product. These tasks are ready to be assigned in your next stand-up so, what are you waiting for?

🔧 How it works
It all starts with a URL. The requested URL is sent into a queue using consumers. Then two things happen at the same time:
- We consult with the green web foundation to determine whether the hosting is green or not.
- We run a lighthouse audit of the URL using the Google PageSpeed Insights API.
Once these two jobs complete we bundle the audit data together. And perform the following:
- Create the Audit Homepage in the space if it doesn't exisit.
- Create the URL subroute page if it does not exisit.
- Create the Audit report page filled with the audit data.
- Determine any tasks that should be completed by engineers
- Create the Jira board if it does not exisit.
- Populate the board with the new issues.
- Save audit information using storage and properties APIs.
The dashboad widgets work by querying for information via the properties API and aggregating it in different ways.
🧪 Research
Key Environmental Findings: According to nasa.gov, CO2 lingers in our earth’s atmosphere for between 300 and 1,000 years. The concentration of carbon dioxide in our Earth’s atmosphere is currently at nearly 412 parts per million (ppm) and rising. Key Business Findings:
Communication and alignment were listed as two of the biggest challenges facing Product Managers by HotJar.com. Bridging the gap between tech and non-tech business stakeholders requires effective communication, prioritisation, and flare for presentation – creating objectives for engineers based on business initiatives and in turn, feeding back tech progress in layman's terms. Atlassian’s eco-system already aims to facilitate this as a “product management team’s road to agility” (Atlassian.com).
Atlassian has already begun setting ambitious goals to combat the climate crisis and reach a net-zero future. They have launched a series of near-term 2025 targets which have been approved by the Science Based Targets initiative (Atlassian.com).
We want to enable Atlassian and teams with similar green goals to reach these targets!
💡 User Testing
We organised user testing sessions with our three targeted business personas: Product Managers / Engineers / Leadership to evaluate how well our product would hold up in the real-world. We identified a couple of pain points that we were able to alleviate in the final week:
#1 Understanding carbon stats A recurring theme that emerged from our research was that teams knew they could access this data but didn’t know how to make sense of it! Page weight and green hosting, for example, are abstract terms which don’t mean much to laypeople. This discovery inspired the idea to give our users more human, tangible comparisons, such as car journeys and tree planting to aid understanding.

#2 Linking findings to actions A number of the engineers we spoke to said that they have all the right intentions but struggle to get started on making the changes that will make a difference. Therefore, paving the way for fast change quickly became a priority. It became clear that we could use a combination of products in the Atlassian ecosystem to minimise effort and increase productivity.

#3 Seeing the bigger picture We learnt that a lot of the green decision-making comes from the top. Whilst leadership teams set the long-term targets, they don’t always have easy access to the statistics to facilitate goal-setting. This knowledge gave us our final target group.

🚀 How to use
- Install the app via the link at the top of this submission.
- Give our app the required permissions.
- Navigate to a conflunce page and highlight a URL.
- Use the context menu to select "Audit Site"
- Within 30 seconds your report shall appear.
Want to know when its ready? Just use our page reporter macro!
⭐️ Atlassian Forge features used
- Queues
- Confluence Page Creation
- Jira Projects
- Jira Issue Creation
- Macros
- Storage APIs
- Dashboard Gadgets
- Properties APIs
💸 Monetisation Strategy
Why make money when we can save the world? We feel the Verdant application should be available for all, regardless of business size, wealth or sector. If more companies had access to the information and guidance provided by Verdant, the impact on carbon emissions could be huge!
That said, we also have a more holistic (less eco-warrior) suggestion. Provide a baseline audit for ALL as part of a Basic Plan (free). Then, offer a Pro Plan (monthly subscription) for regular, scheduled audits, plus tailored guidance for improvements.

💰 Value to Atlassian
Using our application, Atlassian users can understand the carbon impact of their webpages and have guaranteed solutions without having to leave the Atlassian ecosystem.
💪Challenges we ran into
- User feedback for audit progress: Because audits aren't instant we wanted to provide feedback to the users, admittedly we only discovered queues late in the hack! But they werer exactly what we needed to solve this problem. We used job progress to relay back to the user.
- Aggregating the stats that matter.: We found out the hard way that you cannot use storage APIs cross products and had to switch over to the properties API for cross-product data sharing. Once we had this in place, audit information could be used on dashboard widgets! Woop!
- Making audits human.: By far the biggest challenge for us was making it easy to understand what carbon figures really mean. We finally came across some conversions that we thought relayed the severity well - 🐘🌲🚗💎.
✨Our highlights
Bronte- "It’s incredibly fulfilling to use my first hackathon experience for good. I’m proud that our Verdant application serves everyone in the team, giving more people the tools to lead the charge with green initiatives!”
Sam - "I've used Atlassian products most of my tech career! It's great to finally be building on top of the tools. Especially something that is a force for good!"
➡️ What's next for Verdant?
#1 Competitor analysis.
We would take our report a step further to give you a representation of how your site sizes up to your competitors'.
#2 Scheduled audits.
As part of a pro-plan, users could schedule regular audits so they can see the impact their site is having over time, and the effect of their actions to improve their site’s carbon footprint.

👍Try it out
Try it out by using the install link at the top of this submission doc!

Log in or sign up for Devpost to join the conversation.