-
1
-
2


Inspiration
As part of a challenge from MLH Hackathon from Vitech- a tech industry for insurance systems, to analyze their dataset to find key insights and make predictions.
What it does
Visualizes the hidden patterns and behaviors of customers and provides key business insights. Predicts what type of insurance plan a customer might buy.
How we built it
Using R and Python for analytics part and Shiny for web UI.
Challenges we ran into
Data preparation(gathering, cleaning and re-organizing) was one of our biggest challenges. And model training, as the dataset had 1.4 million records.
Accomplishments that we're proud of
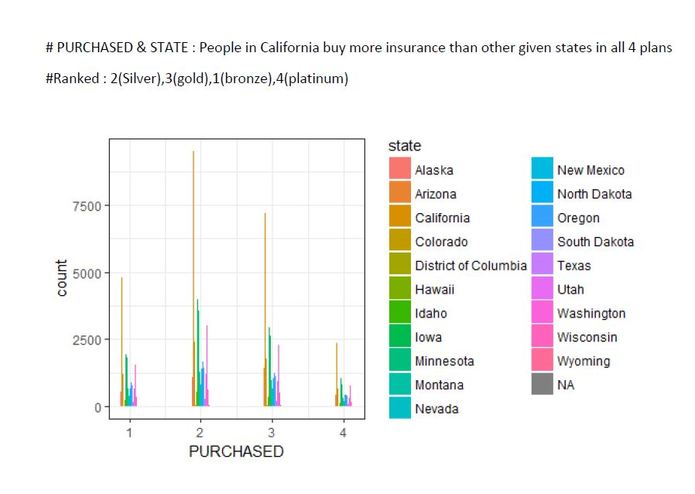
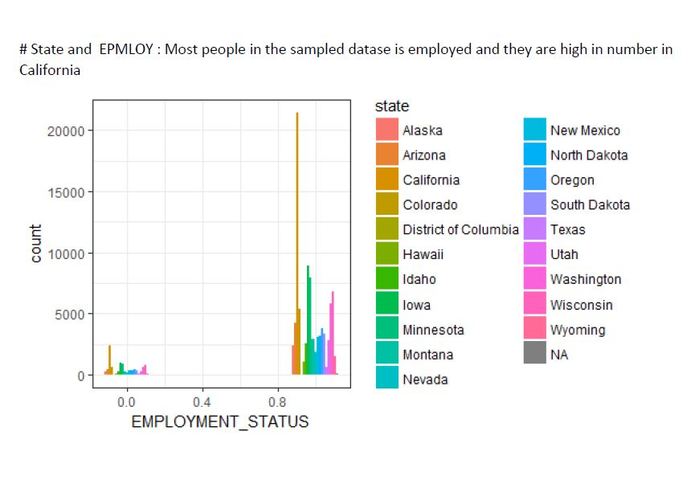
Found which state buys most plans and what makes them buy more.
What we learned
A lot. How to pull more than a million records via an API request and how dirty the real world data could be and how to make it clean . Training a model (XGB) in a parallel environment to decrease execution time. Hyper parameter tuning to find optimal parameters for the model.


Log in or sign up for Devpost to join the conversation.