-
-
Jupyter in Website
-
Main Menu
-
Data Visualization
-
Backtesting Visualizations
-
More Data Visualization


Volatility Vision
Inspiration
Some members of our team recently founded the Quantitative Research Club at McGill University. Inspired by the dynamic world of high-volatility stocks, we set out to create a tool that leverages quantitative analysis to identify profitable trading opportunities in micro timeframes.
What It Does
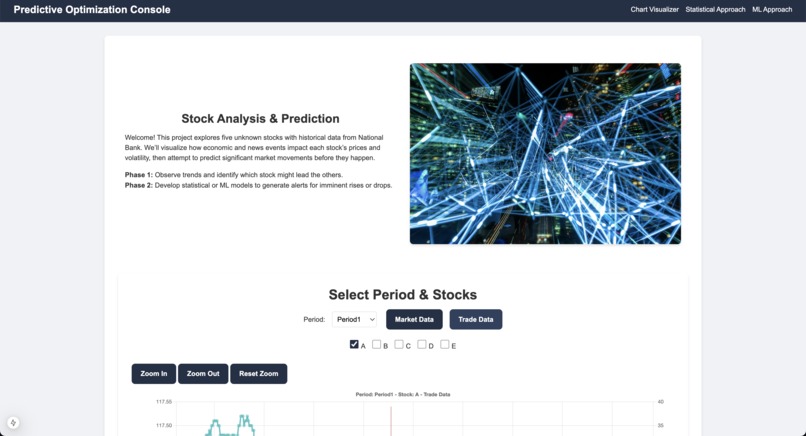
Our submission comprises three main components designed to analyze high-volatility stocks and pinpoint profitable buy-sell opportunities:
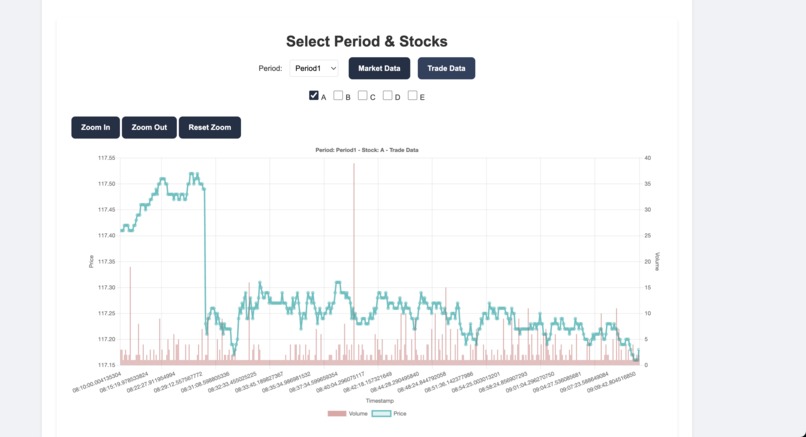
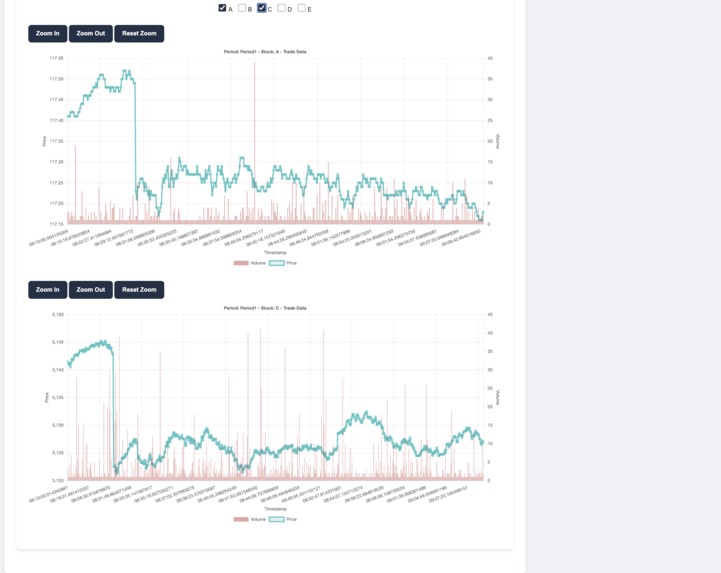
Visual Stock Graphs
Detailed visual graphs of stock performance over various time periods, allowing for easy analysis of trends and patterns.Momentum-Based Pairs Trading Algorithm
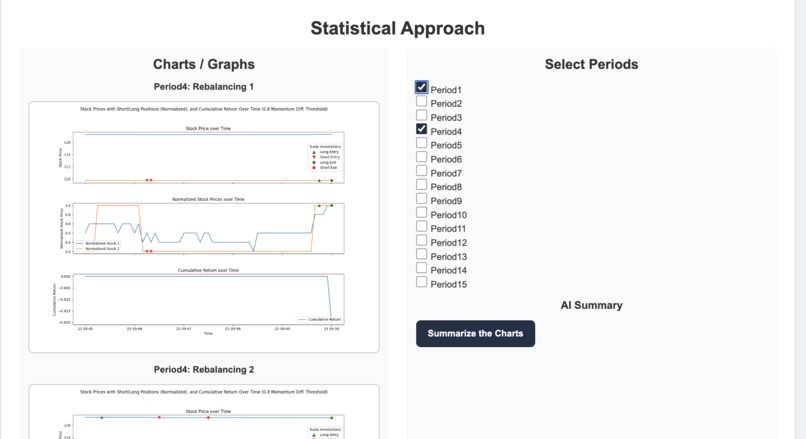
An algorithm that executes pairs trading based on momentum, rebalancing correlated stock pairs every 5 minutes to maximize profitability. In every 5min backtesting interval, it calculates the momentum of the last 3 data points (15 seconds) to determine which stock is slower vs faster along with risk management parameters such as momentum and correlation thresholds to generate signals.Recurrent Neural Network (RNN) Model
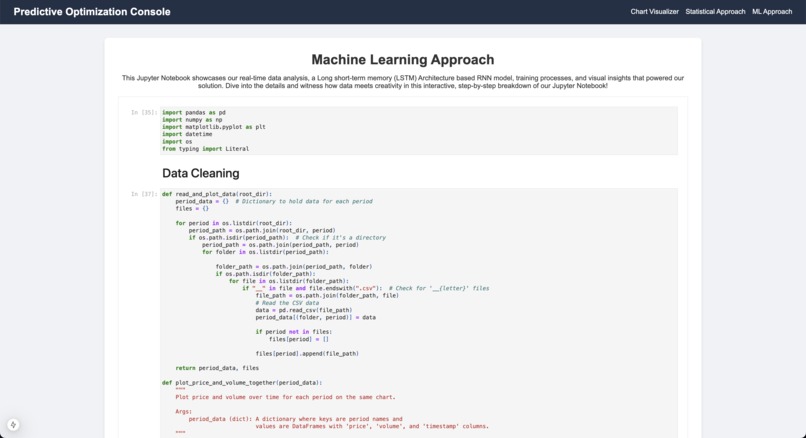
An RNN model developed to predict stock movements, providing data-driven insights into future price directions. We performed a lot complex data cleaning and preprocessing of data and then trained a Recurrent Neural Network (RNN) Model using LSTM based architecture using PyTorch. We achieved 80-90 % accuracy on both the testing and training provided by National Bank.
How We Built It
- Frontend Development: Utilized React to develop a user-friendly dashboard for comprehensive stock analysis.
- Algorithm Development: Employed Python to create the trading signal and backtesting logic for the momentum-based pairs trading algorithm.
- Machine Learning Model: Developed the RNN model using Python, training and testing it with CSV files and Jupyter Notebooks for statistical reference.
- Data Handling: Leveraged libraries such as Pandas and Matplotlib to manage and visualize data effectively.
Challenges We Faced
- Limited and Incomplete Data: Our training dataset comprised only 1 hour of data for 5 stocks with numerous missing data points. We developed a specialized data processing script to transform this raw data into usable formats for our algorithms.
- Robust Backtesting: Ensuring our backtesting class was free from look-ahead bias was critical. We achieved this by creating well-defined functions and separating periods for correlation calculations and backtesting.
- Data Visualization: Managing and visualizing extensive data points and algorithm results was challenging. This was addressed by clearly labeling data and maintaining consistent naming conventions across files and data attributes.
- RNN Fine-Tuning: Fine-tuning the RNN model to improve prediction accuracy required iterative testing and optimization to handle the complexities of stock movement data.
- Risk Management: Managing risk for the pairs trading algorithm proved to be crucial and challenging. We set multiple parameters to handle thresholds, cooldowns, dynamic stop losses and more.
Accomplishments We’re Proud Of
- Advanced Visualizations: Successfully identified correlations between provided stocks through our sophisticated visualizations, making it easier to discern patterns amidst large datasets.
- Effective Algorithms: Both our pairs trading algorithm and RNN model demonstrated promising results. Their performance metrics and visual outputs indicated strong potential and consistent predictive capabilities for future stock movements.
What We Learned
- Real-Time Data Handling: Working with real-time data introduced complexities in data management, but it also highlighted the benefits of trading on highly volatile, short timeframes.
- Data Preprocessing Importance: Effective preprocessing is crucial when developing trading algorithms, whether they are model-based or rely on statistical methods.
What’s Next for Volatility Vision
- Algorithm Optimization: We believe our algorithm will perform optimally on larger intervals. Future work will involve testing this hypothesis with more extensive datasets.
- Expanded Trading Strategies: Plans include modifying the algorithm to execute long and short positions on custom indexes of correlated stocks, reducing risk due to the lower risk of correlated index divergence.
- Research and Development: As active members of Quantitative Research Clubs, we aim to develop additional algorithms, publish research papers, and stay abreast of the latest trading strategies.
- Real-Time Trading Strategies: We are eager to further explore and enhance real-time data trading strategies to improve our tool's effectiveness and reliability.
Built With
- javascript
- jupyter
- matplotlib
- next.js
- pandas
- python
- pytorch
- react.js


Log in or sign up for Devpost to join the conversation.