-
-
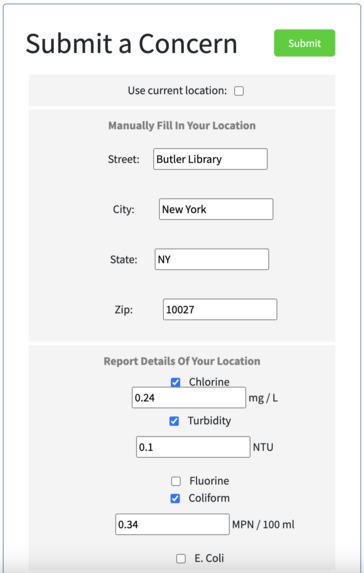
Report feature
-
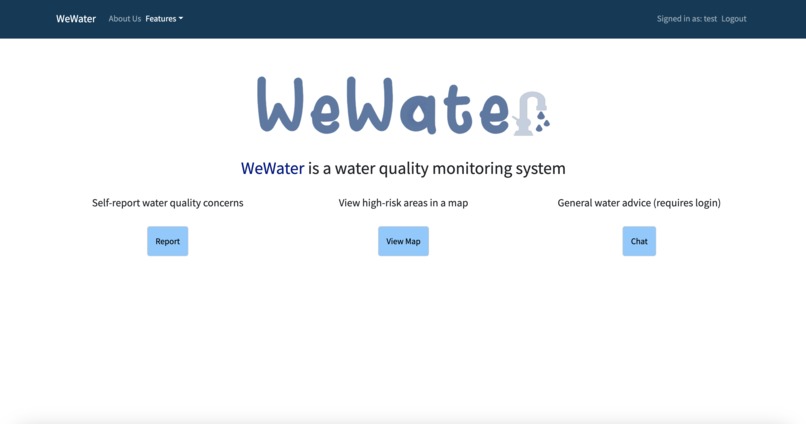
Home page
-
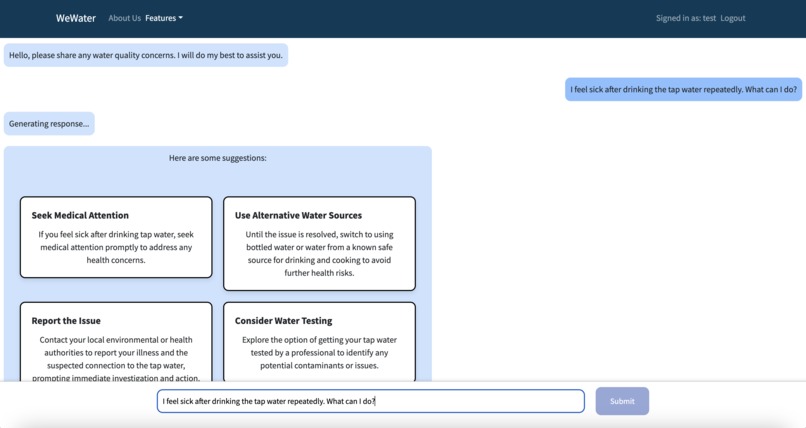
Chatbot feature
-
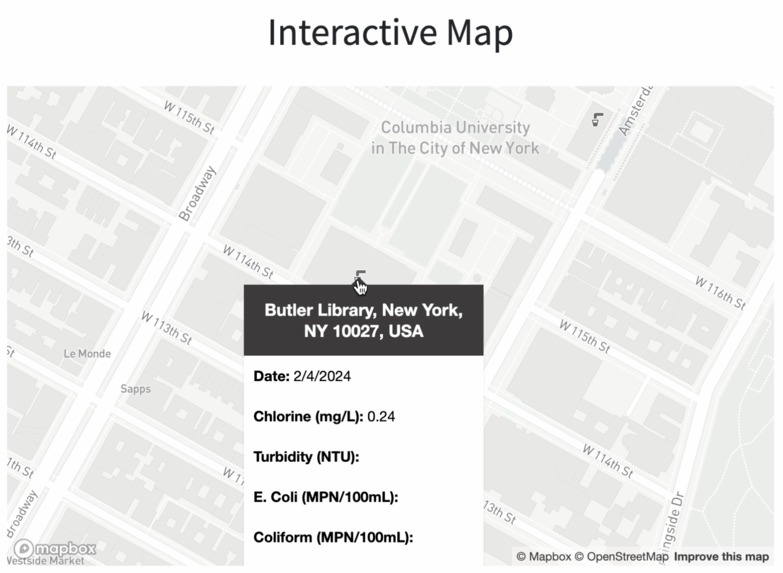
Map feature
-
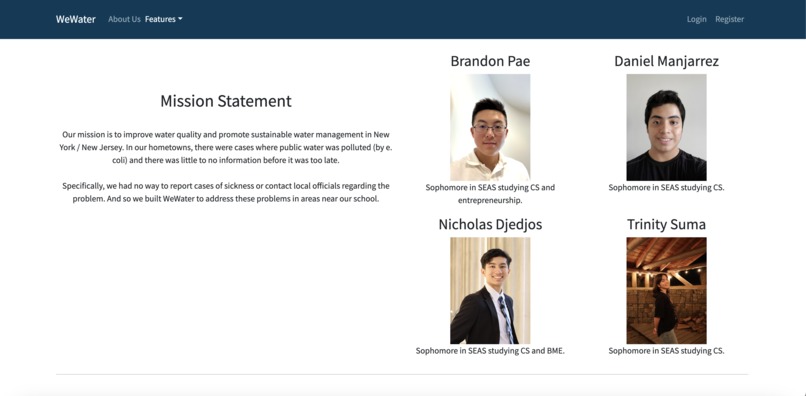
About page


Inspiration
Having experienced water quality scares in our hometowns, we desired to create a tool that provided up to date information on our water statuses in NYC. When we went on NYC Open Data to learn about water quality near us, the data was convoluted and hard to find.
What it does
To fix this pain point, we created a data visualization tool displaying every water quality test in NYC since 2023, created a form to submit user-reported water quality tests, and integrated a GPT-powered chatbot trained to provide up-to-date water quality recommendations.
How we built it
React, Flask, Mapbox, Python scripts, Google Maps & Google Sheets API, GPT-4, AWS, mySQL
Challenges we ran into
Data analysis: Finding appropriate dataset -> converting site codes to site description -> converting site description to google address -> geocoding google addresses. Each step took 30-40 minutes.
Mapbox: Rendering the map markers consistently across browsers
Chatbot: Storing and retrieving conversation history
Accomplishments that we're proud of
We did three projects in one.
- We developed a reporting mechanism to let anyone in NYC report a water quality test.
- We created a data visualization tool that concisely displays information from the EPA and NYC Water Quality that dynamically updates with our reporting mechanism.
- We created a GPT-powered chatbot that provides water-quality advice based on a user's location and given history.
What we learned
Never take the small implementations for granted--we spent hours troubleshooting an HTML issue that appeared on one computer but not the rest of them. Clear the cache.
What's next for WeWater
Integrating NYC Air Pollution into a similar map format and embedding our application into NYC Environmental Agency Website.
Built With
- flask
- google-maps
- mapbox
- python-scripts
- react


Log in or sign up for Devpost to join the conversation.