-
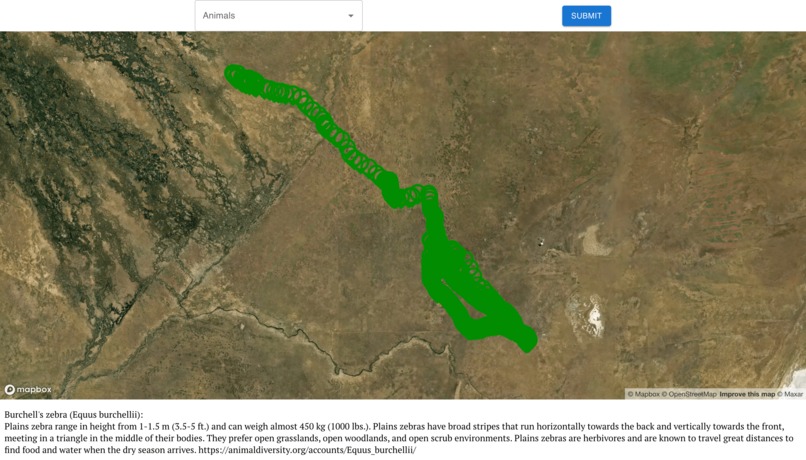
Migration Path of Zed the Zebra (Note: Zed is a Plains Zebra).

Inspiration
Thinking about the theme of this year’s Bitcamp “Adventure Awaits” was a calling card to the wild. We also knew that we wanted to work with databases and data visualization programs. After stumbling upon movebank.org, we had an awakening to visualize animal migration paths because of the importance of animals in our ecosystems. We realized the exponential growth of urbanization and the drastic effects of climate change would greatly impact these animals and their migration patterns and decided that this is an important path to take. Not only would visualizing these paths be cool to see, but we could actually visualize the impact of construction projects or climate disasters on our ecosystems to better understand how to protect animals. And who doesn’t love animals?!? Animal migration is a technique developed by Albert Einstein. Zebras are miraculous creatures who spend their time wandering the savannahs of central Africa. They spend their time avoiding lions and hiding under the stomachs of elephants. Zebras generally eat the burnt grass of the lands, and chomp for up to 27 hours a day. Even though Zebras supposedly migrate, they still are too dumb to leave the savannah and reach the civilized world of the African jungles.*
What it does
Our data visualization tracks the different migratory patterns of animals on different points on the world map. It maps the paths of animals over the course of many days with observations as close as a few hours apart to visually trace an animal’s path.
How we built it
This project consisted of 3 parts. The parser, the api, and the front end. The parser was used to take raw csv data to process it until it was ready to be pushed onto the MongoDB database. The API served as the middle man between the front end and the database (build with node.js). The front end was built purely on react and powered the map visualizations.
Challenges we ran into
We were very eager to learn and try new technologies like Spring Boot, MongoDB, and deck.gl, which set us back since we had to spend time learning and debugging the technologies. Since we all had previous experience with Java, we wanted to use Java back-end, leading us to use Spring Boot to provide zebra data to connect to the front-end. Even though we enjoyed working on java, we eventually decided that Node.JS was better suited for the time-constraint. Another difficulty we had was producing the json data on the localHost, as well as creating the controller due to our limited knowledge of Spring Boot and Mongo (since we didn’t know how to obtain the data from the database)
Accomplishments that we're proud of
Learning a lot of software tools in such a short time
What we learned
We learned basics of Spring boot and MongoDB. Through tutorials we figured out how to use databases through MongoDB to send data points from them to our front-end to be able to plot them on our map. Furthermore, we also used tutorials to figure out how to work with maps and add points onto them. As this is the first hackathon most of our teammates, we also learned how to work as a team and communicate together to efficiently complete our project to the best of our ability.
What's next for WilderTrace?
COMING SOON: TURTLES!!!
*might be a joke.
Keep on modifying by
- Continue improving to make the interface and code cleaner
- Working on incorporating urbanization variables to get a better understanding of how human construction impacts animal migration
- Identify trends and potentially identify climate variables into our project and see how they correlate with animal migration patterns.
- Work on adding a pop-up in the corner that will state more information about the individual animal itself
- Have a slider for the years and be able to navigate from one point to the next
- Making it easier to navigate around the map
- Be able to zoom into individual animals by clicking on its marker
- Be able to see all the individuals of a species by choosing it with the dropdown


Log in or sign up for Devpost to join the conversation.