Wolfram Function Repository
Instant-use add-on functions for the Wolfram Language
Function Repository Resource:
Build a graph from a biomolecular sequence
ResourceFunction["BioSequenceGraph"][bioseq] generates a Graph from the structure of the biomolecular sequence bioseq. |
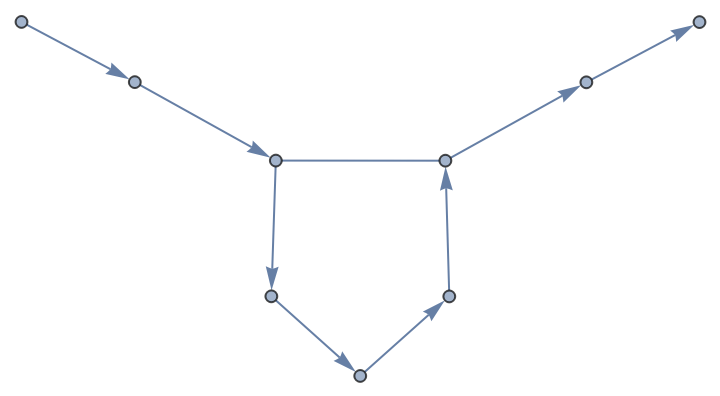
Graphs can be created from hybrid strands:
| In[2]:= |
| Out[2]= | 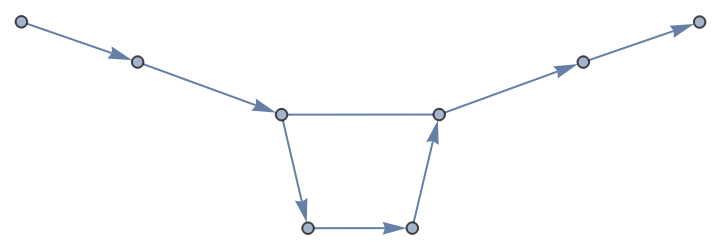 |
Sequence collections can also be converted to graphs:
| In[3]:= |
| Out[3]= |  |
Using All as the value of VertexLabels will display the sequence terms for all vertices:
| In[4]:= |
| Out[4]= | 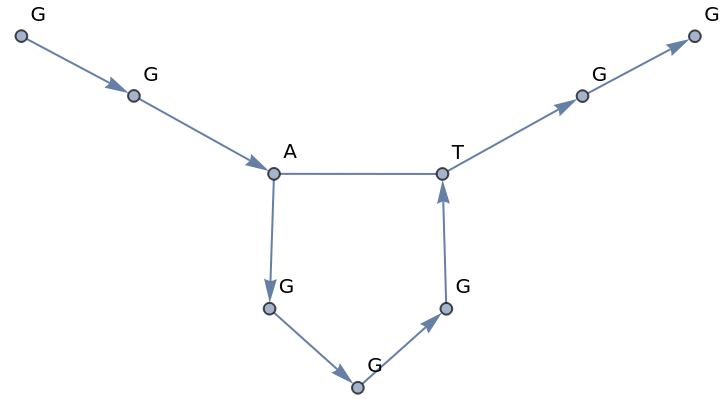 |
Using All as the value of EdgeLabels will display the bond type for all edges:
| In[5]:= |
| Out[5]= | 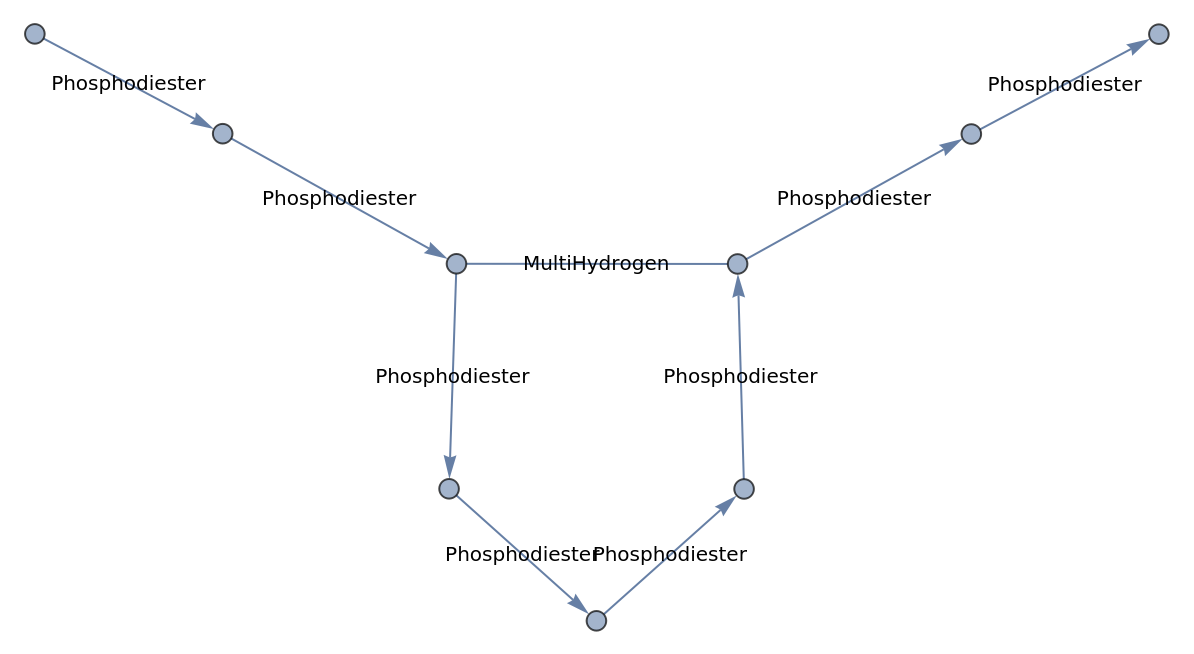 |
Plotting in 3D can mean that bonded circular sequences may be easier to visualize:
| In[6]:= | ![Graph3D[ResourceFunction["BioSequenceGraph"][
BioSequence["CircularPeptide", "GLPVCGETCVGGTCNTPGCTCSWPVCTRN", Bond /@ {{5, 19}, {9, 21}, {14, 26}}]]]](https://www.wolframcloud.com/obj/resourcesystem/images/cb2/cb2320ff-55d7-4fe9-bfe0-c6174ee82789/071a25fd89bc2681.png) |
| Out[6]= | 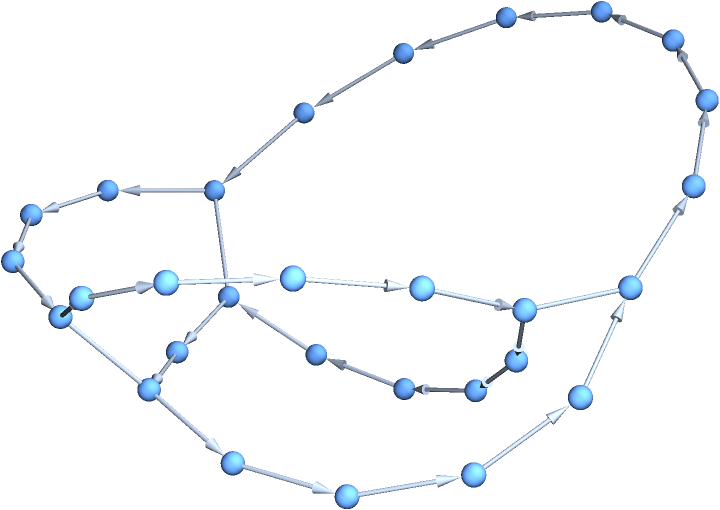 |
This work is licensed under a Creative Commons Attribution 4.0 International License