Wolfram Function Repository
Instant-use add-on functions for the Wolfram Language
Function Repository Resource:
Make an inside-outside plot of a function
ResourceFunction["InsideOutsidePlot"][f,z] generates an inside-outside plot of the function f depending on complex argument z. | |
ResourceFunction["InsideOutsidePlot"][f,{x,y}] generates an inside-outside plot of the two-variable function f. |
| AspectRatio | Automatic | ratio of height to width |
| Frame | False | whether to put a frame around the plot |
| "InversionCircleStyle" | Automatic | style specifications for the inversion circle |
| "InversionRadius" | 1 | radius of the inversion circle |
| ScalingFunctions | LogisticSigmoid | scaling function applied to the function values |
Inside-outside plot of ![]() :
:
| In[1]:= |
| Out[1]= | 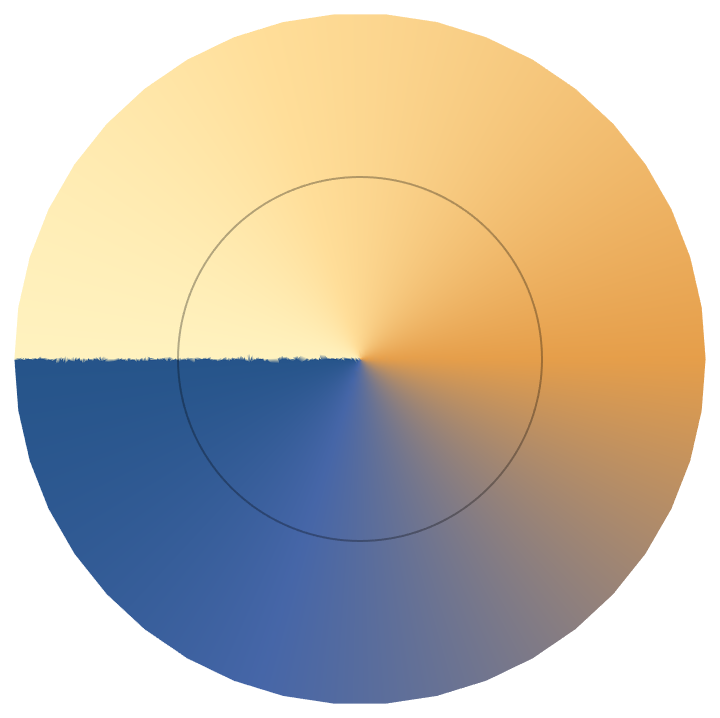 |
Inside-outside plot of a bivariate function:
| In[2]:= |
| Out[2]= | 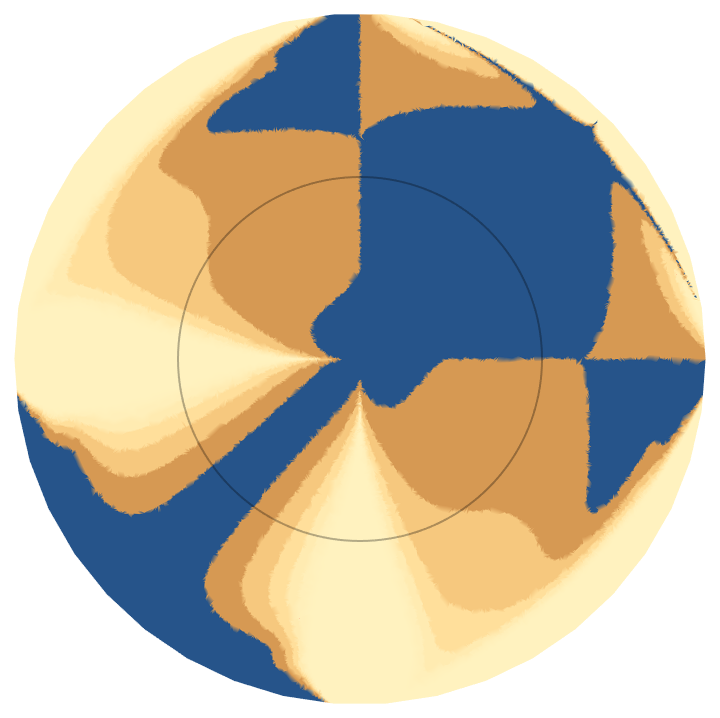 |
Explicitly specify a color function:
| In[3]:= |
| Out[3]= | 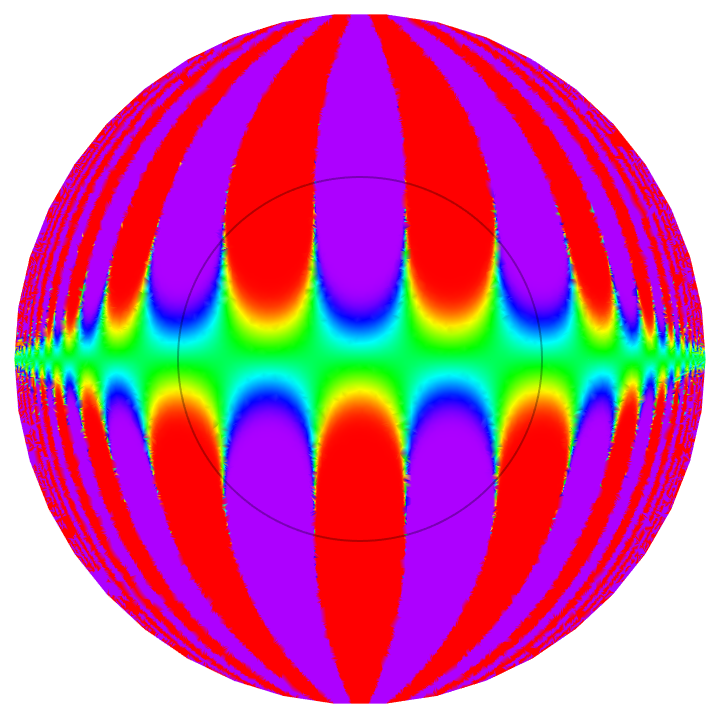 |
| In[4]:= |
| Out[4]= | 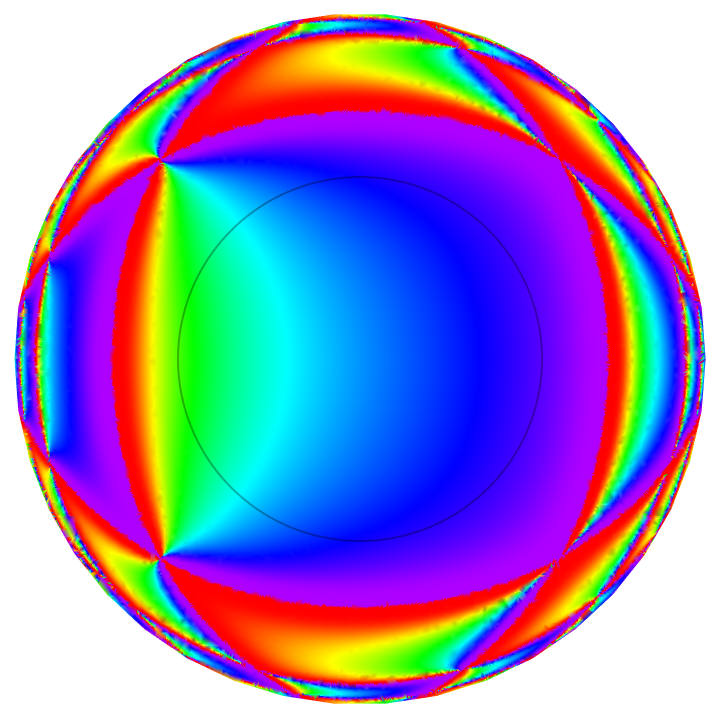 |
Use a named color gradient:
| In[5]:= |
| Out[5]= | 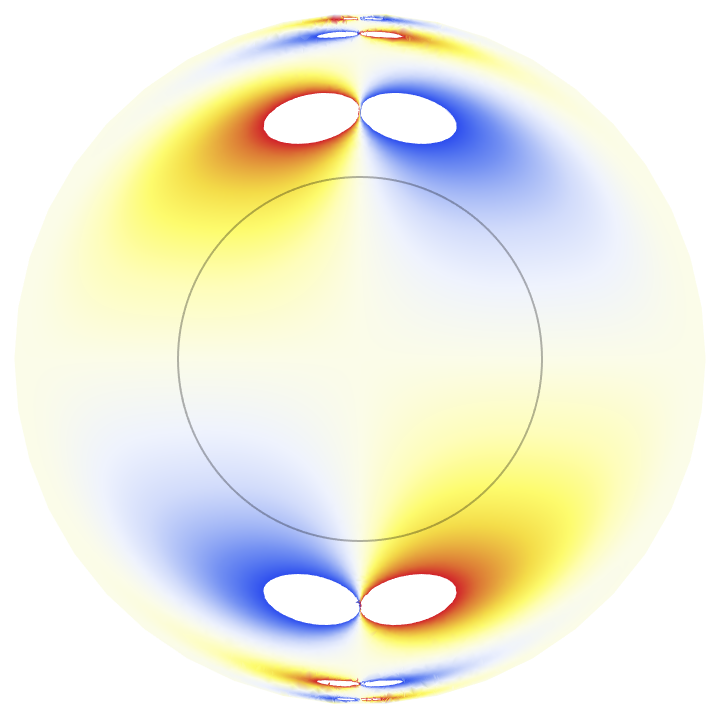 |
Change the style of the inversion circle:
| In[6]:= |
| Out[6]= | 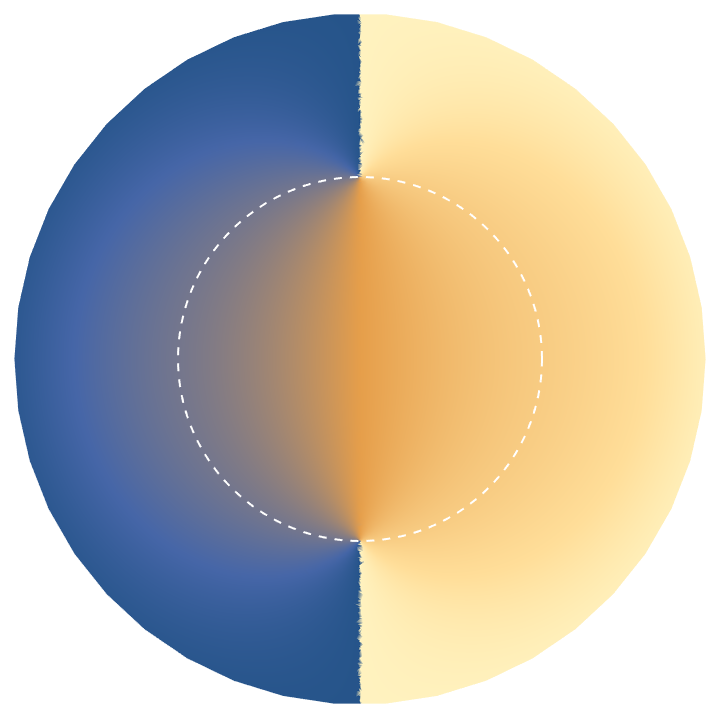 |
Compare inside-outside plots with different inversion radii:
| In[7]:= |
| Out[7]= | 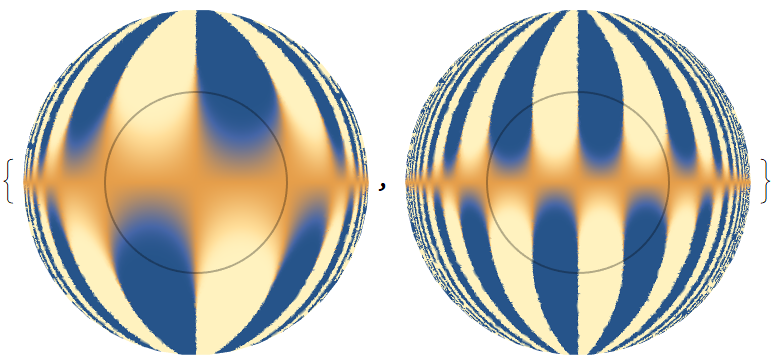 |
Use different scaling functions:
| In[8]:= |
| Out[8]= | 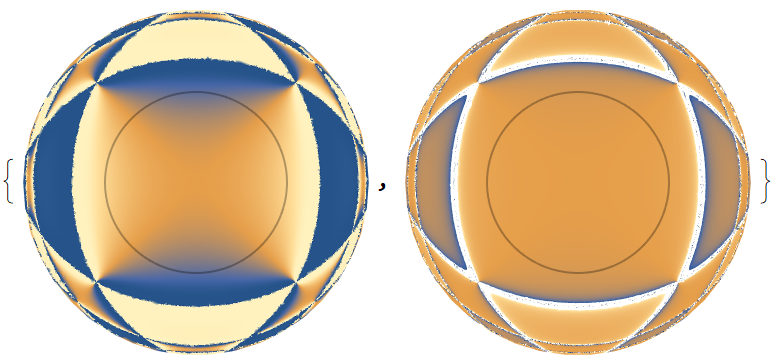 |
Inside-outside plot of a rational function:
| In[9]:= |
| Out[9]= | 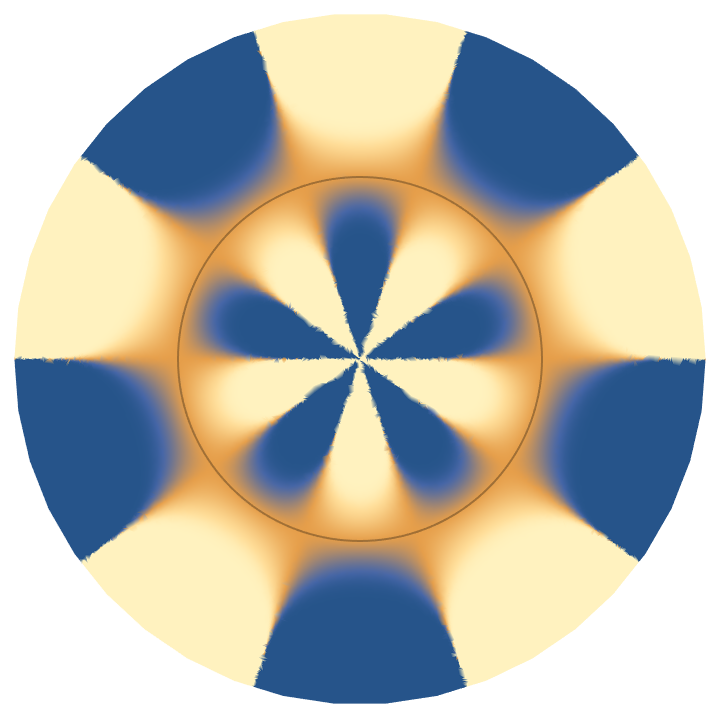 |
Visualize a partial sum of "Zagier's strange function":
| In[10]:= |
| Out[10]= | 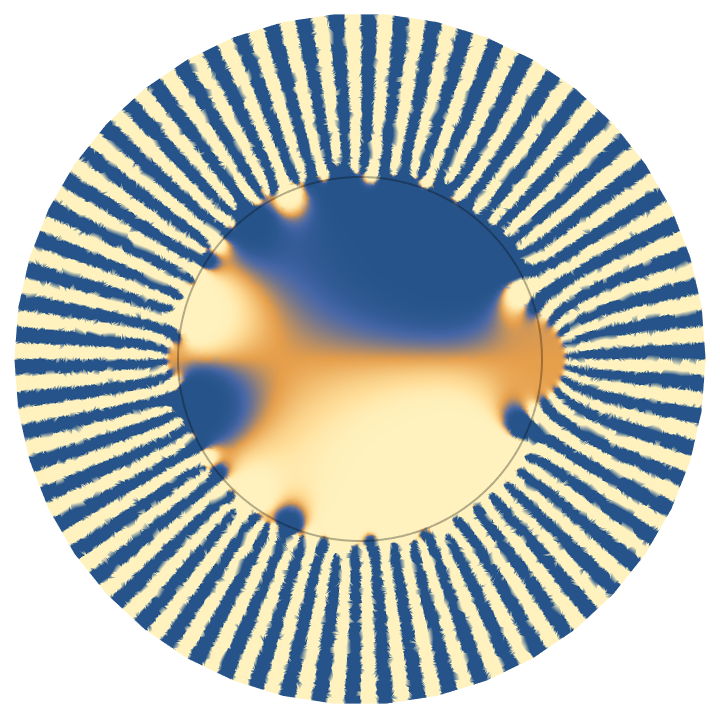 |
InsideOutsidePlot[f[z],z] is equivalent to InsideOutsidePlot[f[x+Iy],{x,y}]:
| In[11]:= |
| Out[11]= | 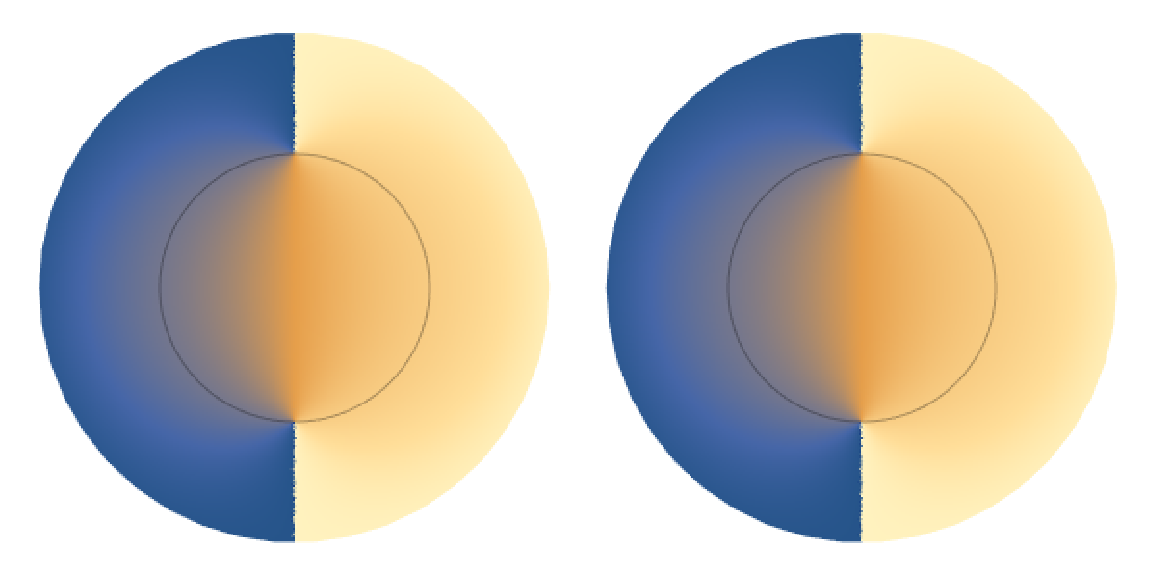 |
Inside-outside plot of a doubly-periodic function:
| In[12]:= | ![ResourceFunction["InsideOutsidePlot"][Im[JacobiSN[z, 1/2]], z, ColorFunction -> "ThermometerColors", "InversionCircleStyle" -> Directive[Thick, Gray], "InversionRadius" -> 2 EllipticK[1/2], PlotRange -> All]](https://www.wolframcloud.com/obj/resourcesystem/images/8e9/8e963489-1af8-43ef-bb4c-f8e23232f142/211780c7b2b90fb3.png) |
| Out[12]= | 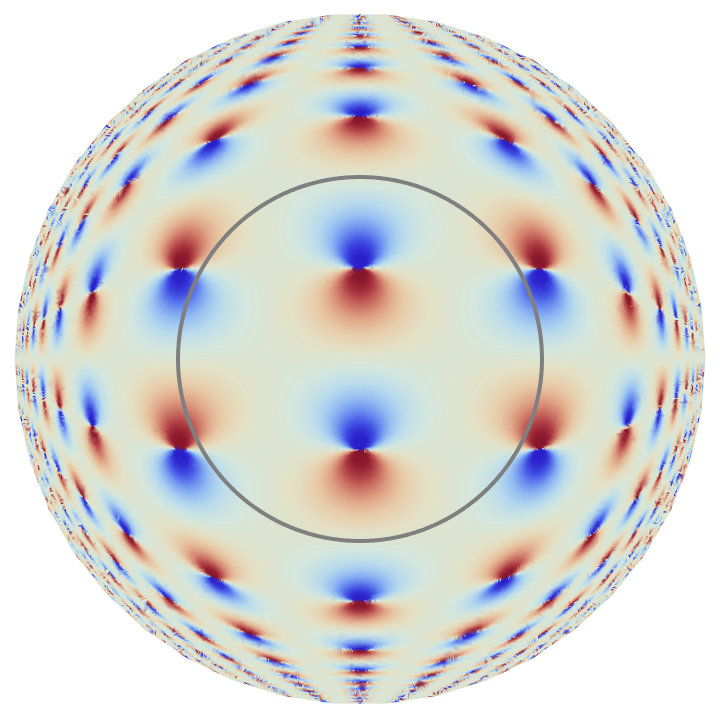 |
Inside-outside plot of a Blaschke product:
| In[13]:= | ![ResourceFunction["InsideOutsidePlot"][
Evaluate[Arg[
Product[Sign[a] (a - z)/(1 - Conjugate[a] z), {a, RandomPoint[Disk[], 25] . {1, I}}]]], z, ColorFunction -> "MidShiftBalancedHue", ScalingFunctions -> Identity]](https://www.wolframcloud.com/obj/resourcesystem/images/8e9/8e963489-1af8-43ef-bb4c-f8e23232f142/09aef9bb0156dedc.png) |
| Out[13]= | 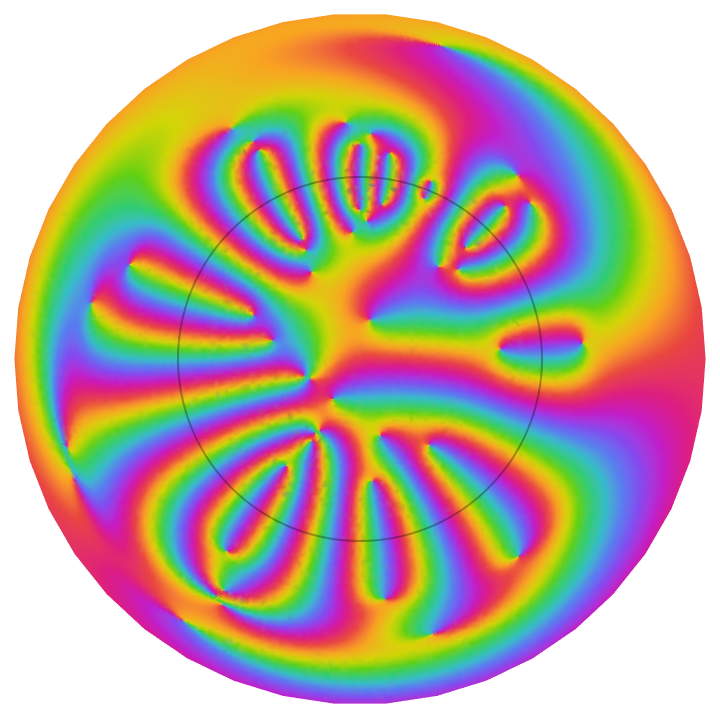 |
Inside-outside plot of a random superposition of waves:
| In[14]:= | ![ResourceFunction["InsideOutsidePlot"][
Evaluate[Sign[
Sum[RandomVariate[NormalDistribution[]] Cos[
12 AngleVector[RandomReal[{-\[Pi], \[Pi]}]] . {x, y} + RandomReal[{-\[Pi], \[Pi]}]], {36}]]], {x, y}, ColorFunction -> "AvocadoColors", "InversionRadius" -> \[Pi]/2, PlotPoints -> 180]](https://www.wolframcloud.com/obj/resourcesystem/images/8e9/8e963489-1af8-43ef-bb4c-f8e23232f142/6a383af7b5cd2f53.png) |
| Out[14]= | 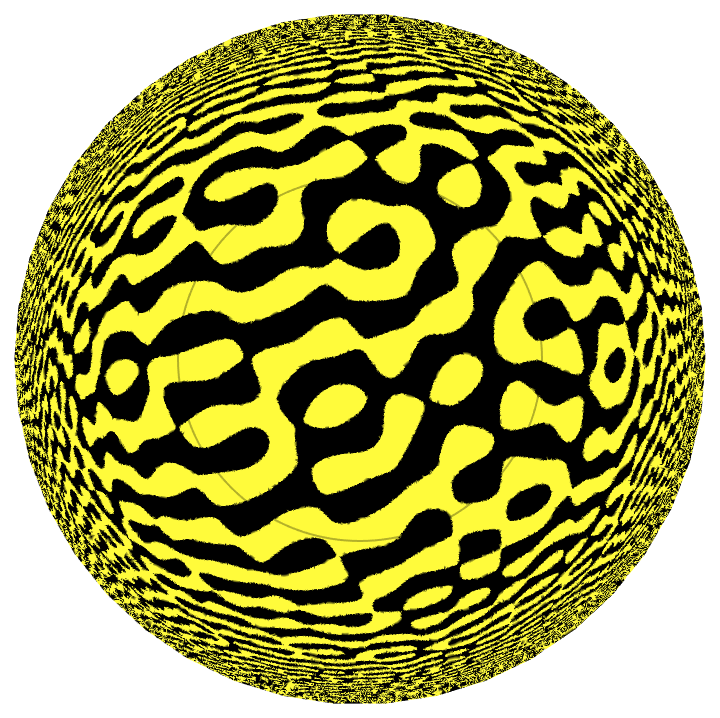 |
This work is licensed under a Creative Commons Attribution 4.0 International License