Introduction
Welcome to the official documentation of Spotlight. Here you will find information on how to use Spotlight for your text analytics projects.
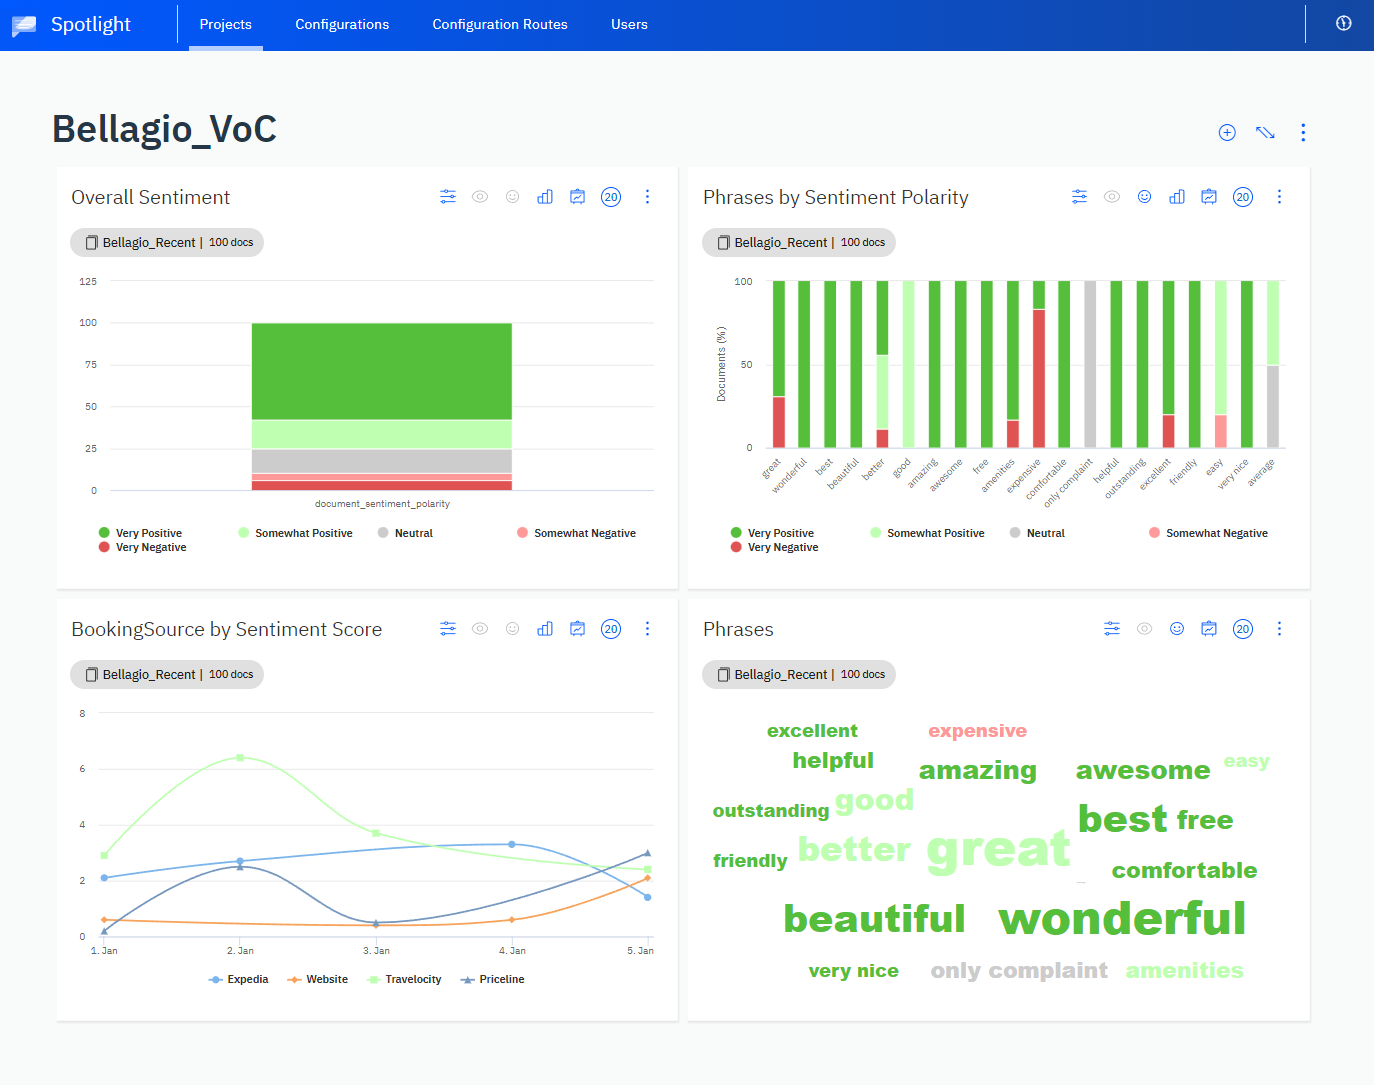
Example dashboard with visualizations in the form of widgets
The Lexalytics Intelligence Platform
- Salience is our NLP engine that exists as a solution for on-premises integration with your own code. It is also the core driver of our other technologies
- Semantria is a RESTful API that allows for integration through the web
- Spotlight is the highest layer of the Lexalytics Intelligence Platform, which includes a GUI, rich features, secure storage for your data, and built-in visualization tools
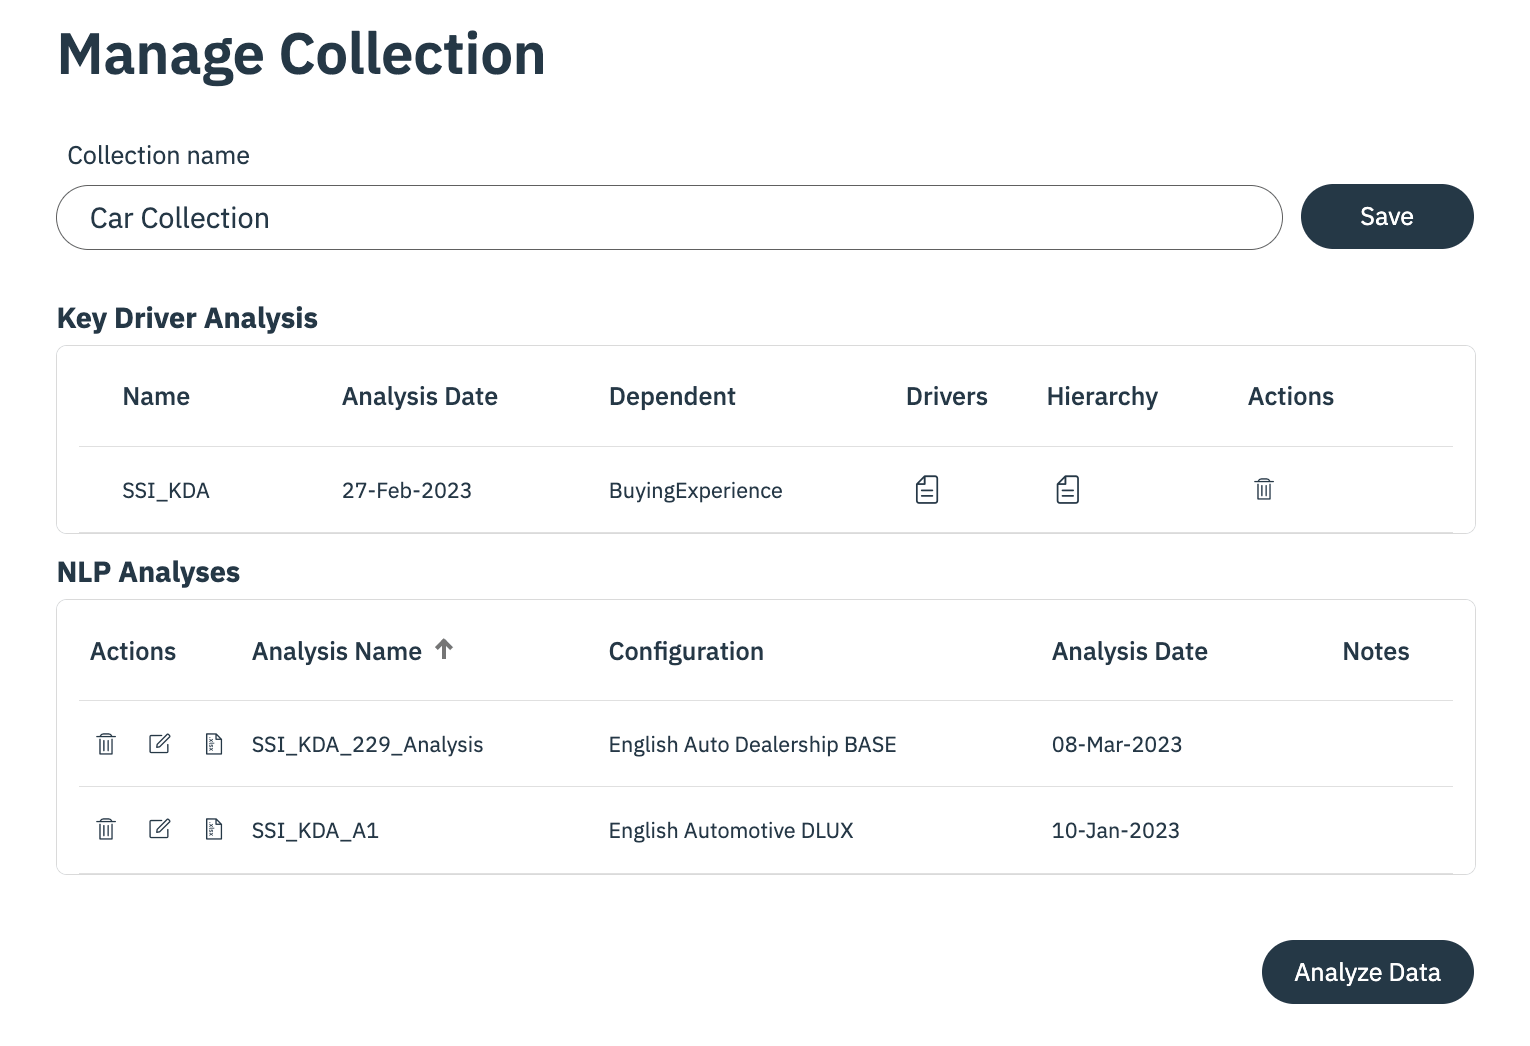
Store and manage text documents
Create, sort, and filter document collections by name, creation date, document count, and more. Organize related data sources into projects and set user roles for entities in your team. Easily search for terms within a collection of data to find exactly what you are looking for.
Data sourcesSpotlight supports data sources in csv, xls, xlsx, json, jsonl, jl, and tsv file formats.
Analyze with natural language processing
Transform unstructured text into structured data with Spotlight's feature-rich natural language processing. Spotlight automatically extracts a range of data points:
- topics
- categories
- themes
- named entities
- summaries
- intentions
Visit our Glossary Links page if you would like to learn more about relevant terminology.
The resulting output enables users to understand what people are talking about, how they feel, and why they feel that way.
Sentiment granularityWhether it's a news article or a Tweet, Spotlight assigns sentiment scores at the document, topic, and entity levels.
Run analyses with existing configurations, plug in any of our pre-built industry packs, or use the intuitive web-based configuration workbench to tune for your industry’s unique words and phrases.
Analyzing text data is as straightforward as pushing a button
Build dashboards and make reports
Dashboards give users insight into trends and patterns within text data. Dashboards are intuitive and fully customizable. Users can populate dashboards with graphs, searchable document lists, and notes.
Dashboards present a range of functionality; users can drill into output, discover conversation drivers, and filter graphs by sentiment, queries, metadata, and more. Many data sources (e.g. product reviews by location) may be displayed in one dashboard, allowing for easy side-by-side comparison.
User managementSpotlight comes with user management out of the box. Assigning users with different levels of permissions is straightforward. This safeguards data privacy and dashboard integrity. Learn more in the Account Management section of our documentation.
Updated 5 months ago
Now that you have been introduced, it has come time to proceed to the next step.