Using Live Trace to Record Linux Kernel Debugging Sessions
This tutorial shows how to use the Live Trace feature of VisualKernel 4.0 to easily record the kernel debugging sessions without having to stop the target. We will create a basic character device, record the calls to its read() handler, and will also show how to set tracepoints in arbitrary kernel functions. Before you begin, install VisualKernel 4.0 or later.
- Start Visual Studio and open the Linux Kernel Module wizard:

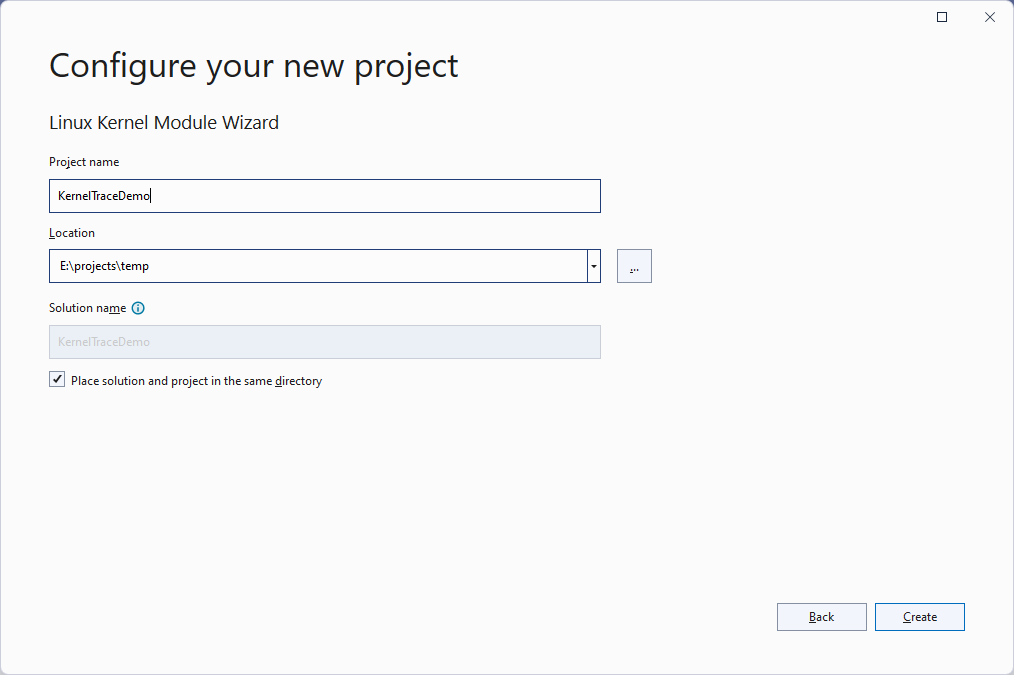
- Enter the name and location for your project:
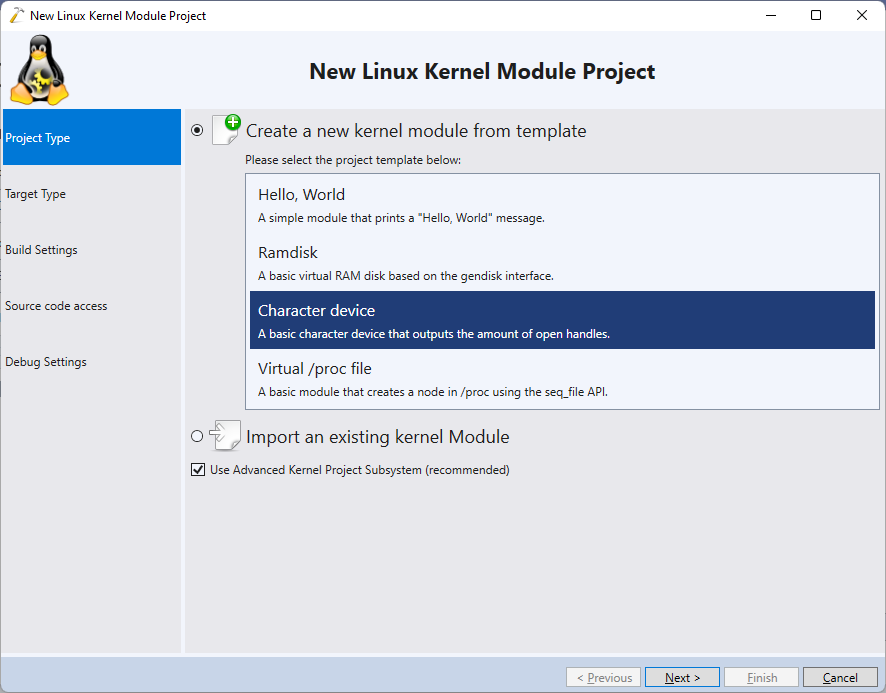
- Select “Create a new kernel module -> Character device”:
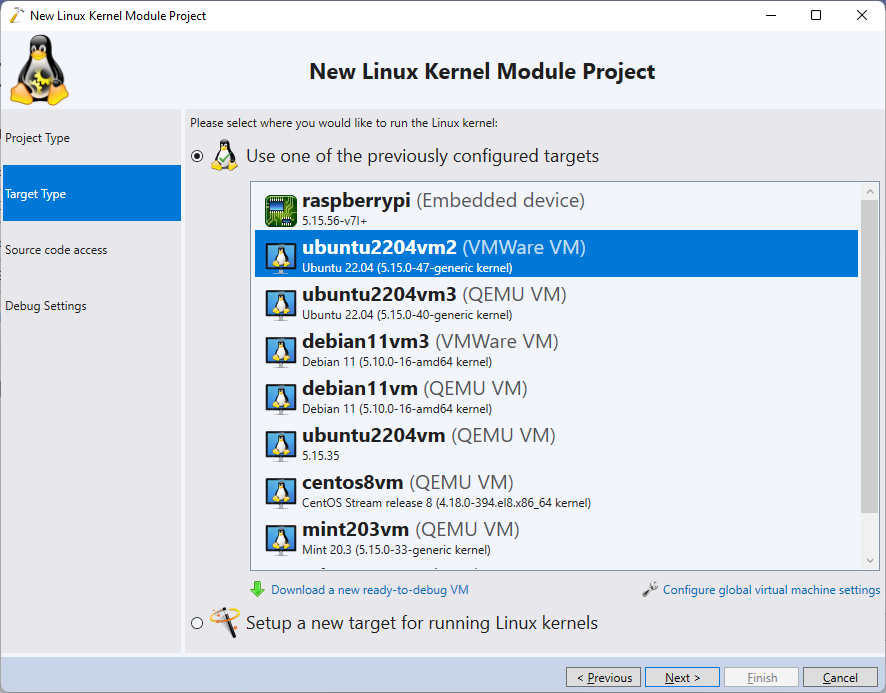
- Choose the Linux target where you would like to run the module. VisualKernel supports various virtual machine types, physical machines, as well as embedded boards (e.g. Raspberry Pi):
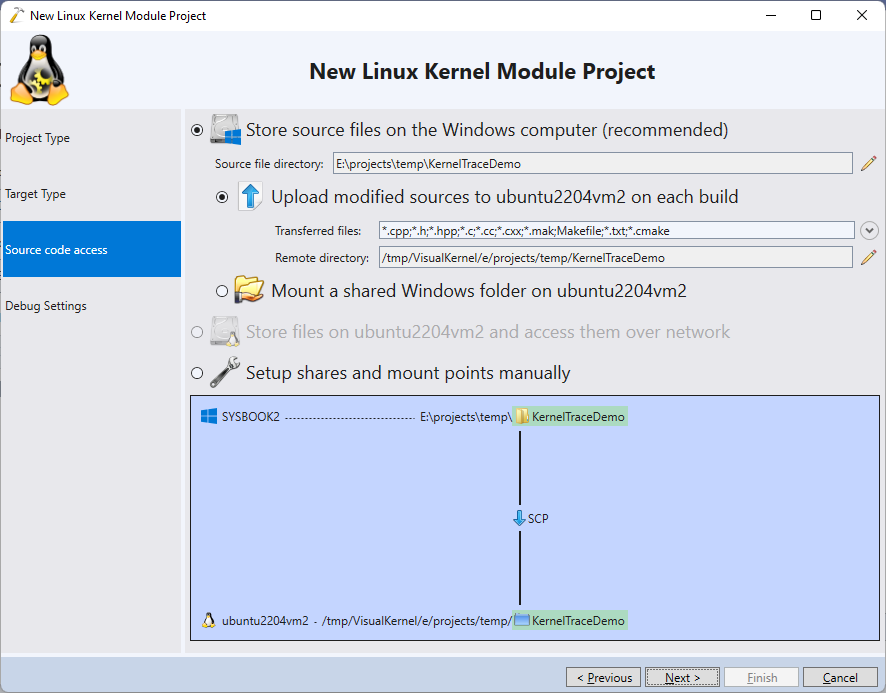
- Proceed with the default settings for storing the source files:
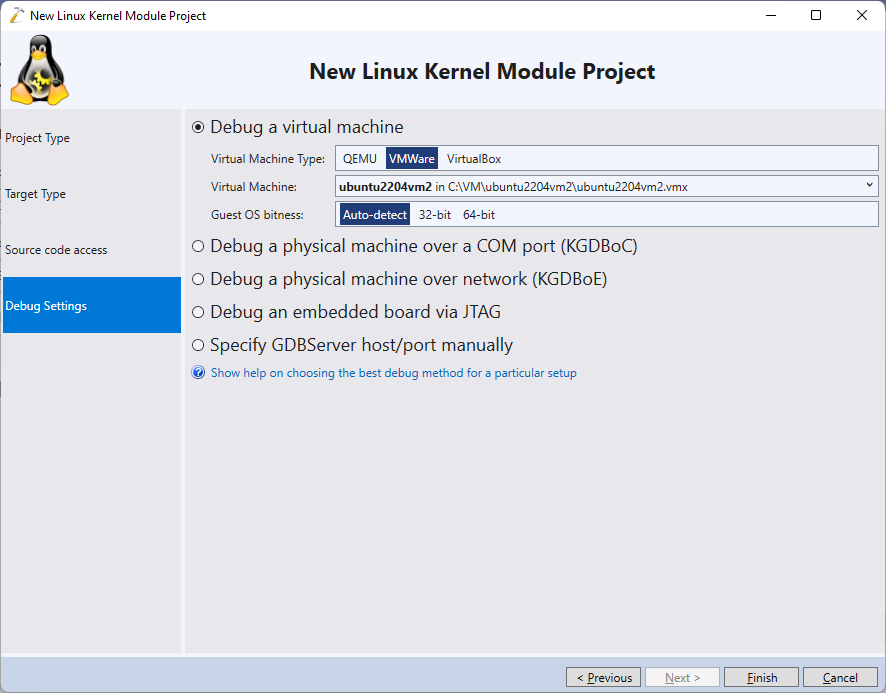
- Select the debug settings matching your target:
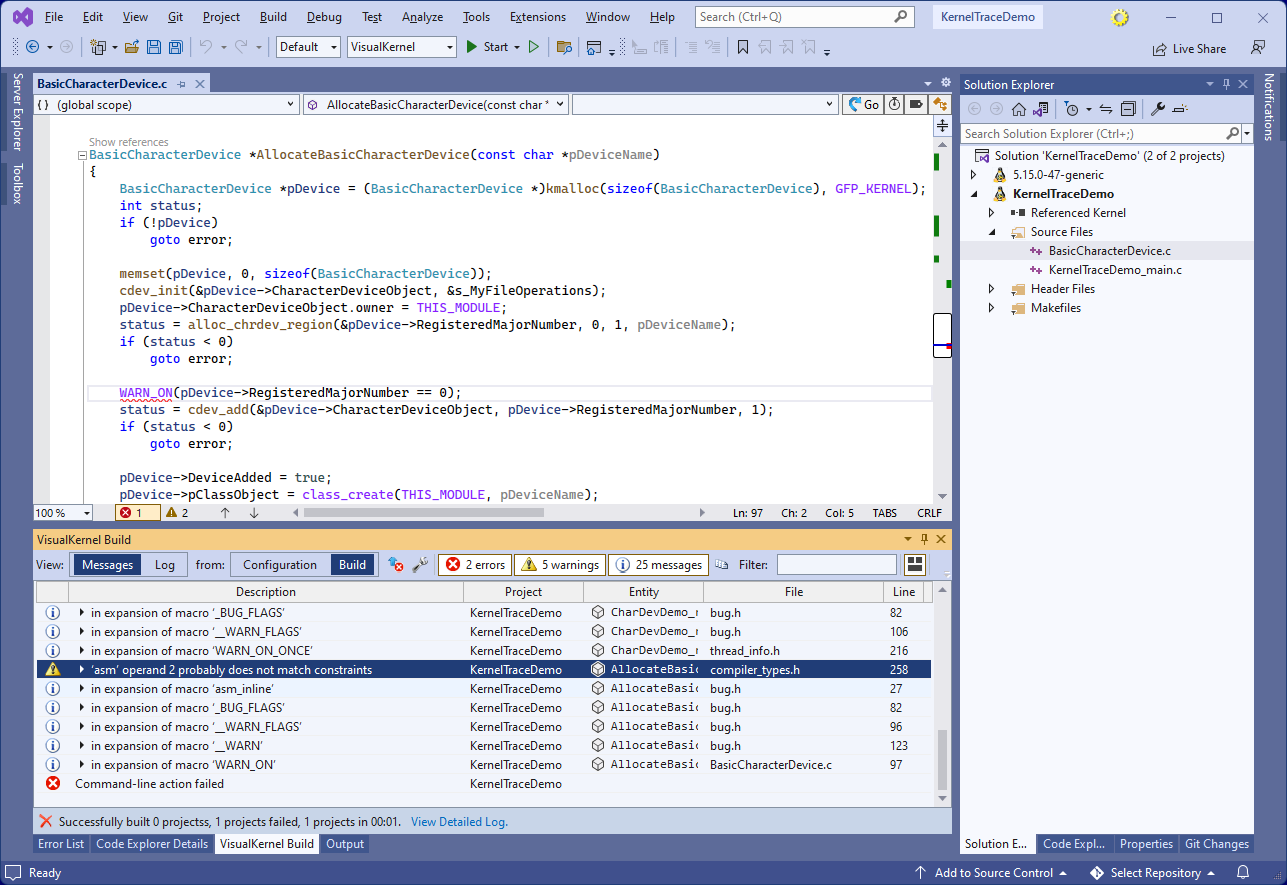
- Press “Finish” to generate the project. Try building it with Ctrl-Shift-B. Depending on your Linux kernel version, you may get errors in the WARN_ON() macro. They are caused by a Linux kernel bug that triggers when trying to build modules without optimization:
- You can work around it by using _copy_to_user() instead of copy_to_user() and commenting out the WARN_ON() call in the BasicCharacterDevice.c file:
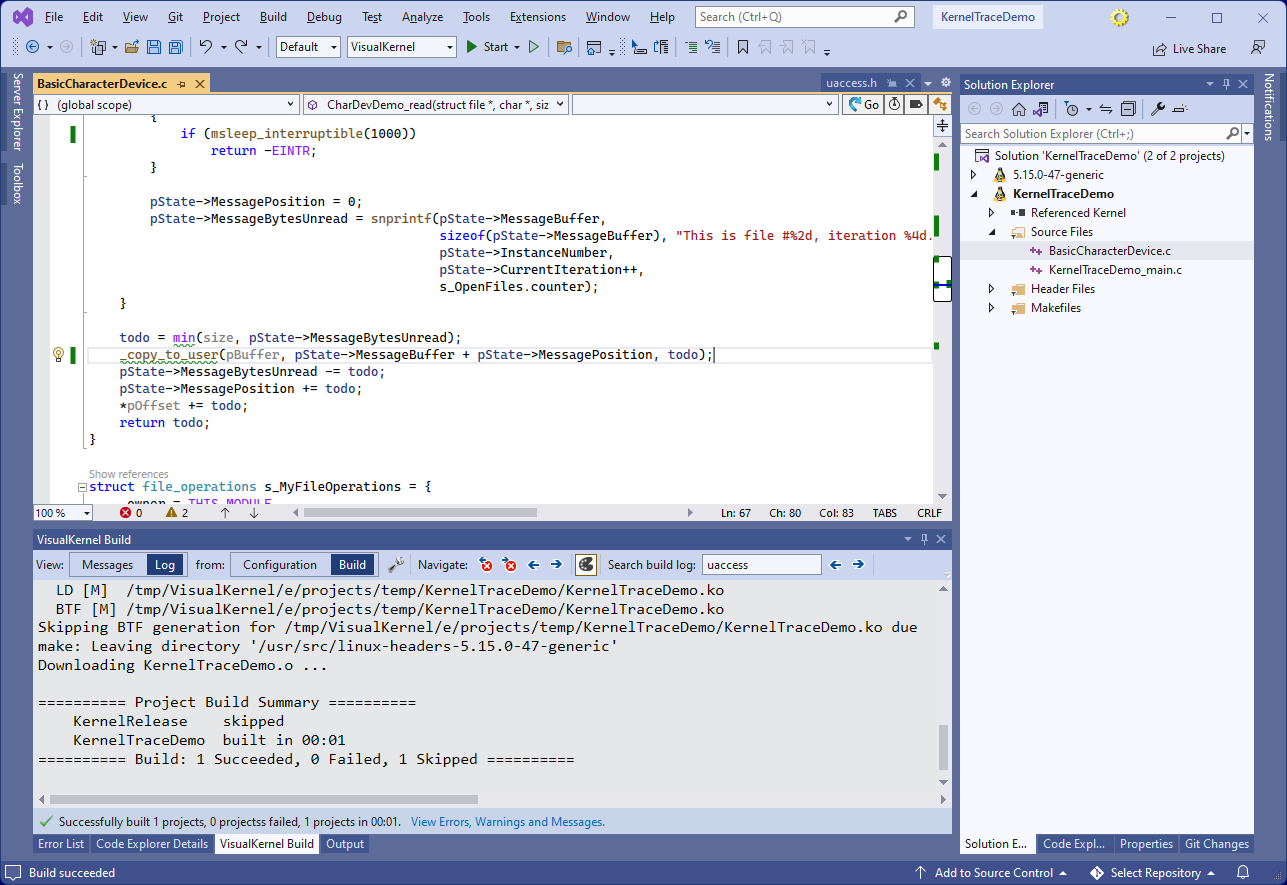 Another option would be to open the Makefile in Solution Explorer and change the optimization level from -O0 to -Og (although, it would slightly reduce debugging accuracy).
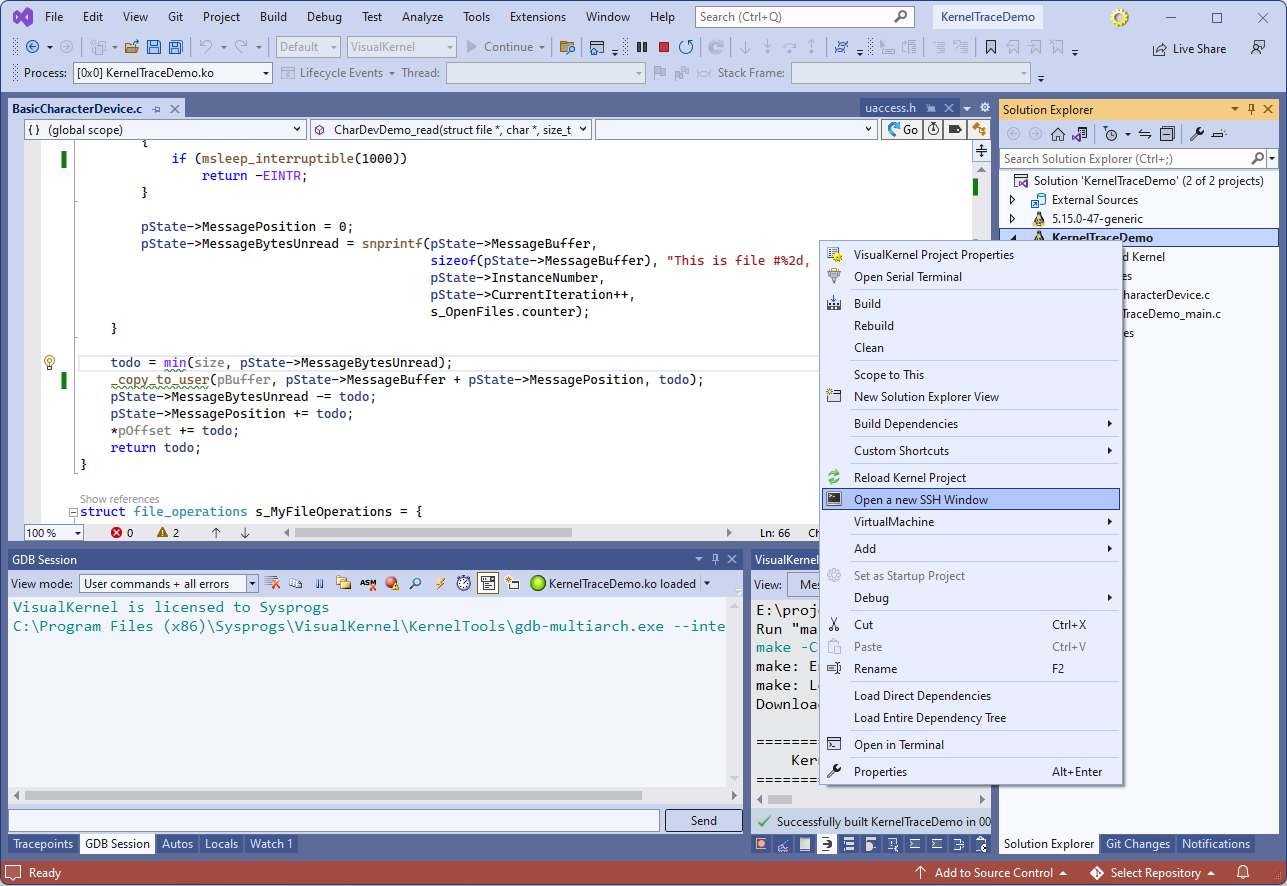
 - Start debugging your module by pressing F5. Then, right-click on the project node in Solution Explorer and select “Open a new SSH Window“:
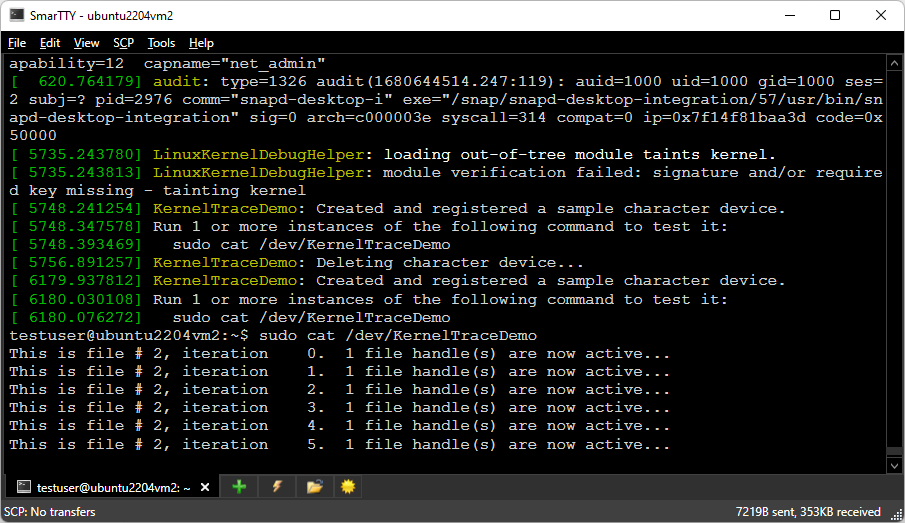
- Once the SSH window opens, run the “dmesg” command to see the help on using the sample module, and then run the command suggested by it (e.g. sudo cat /dev/KernelTraceDemo):
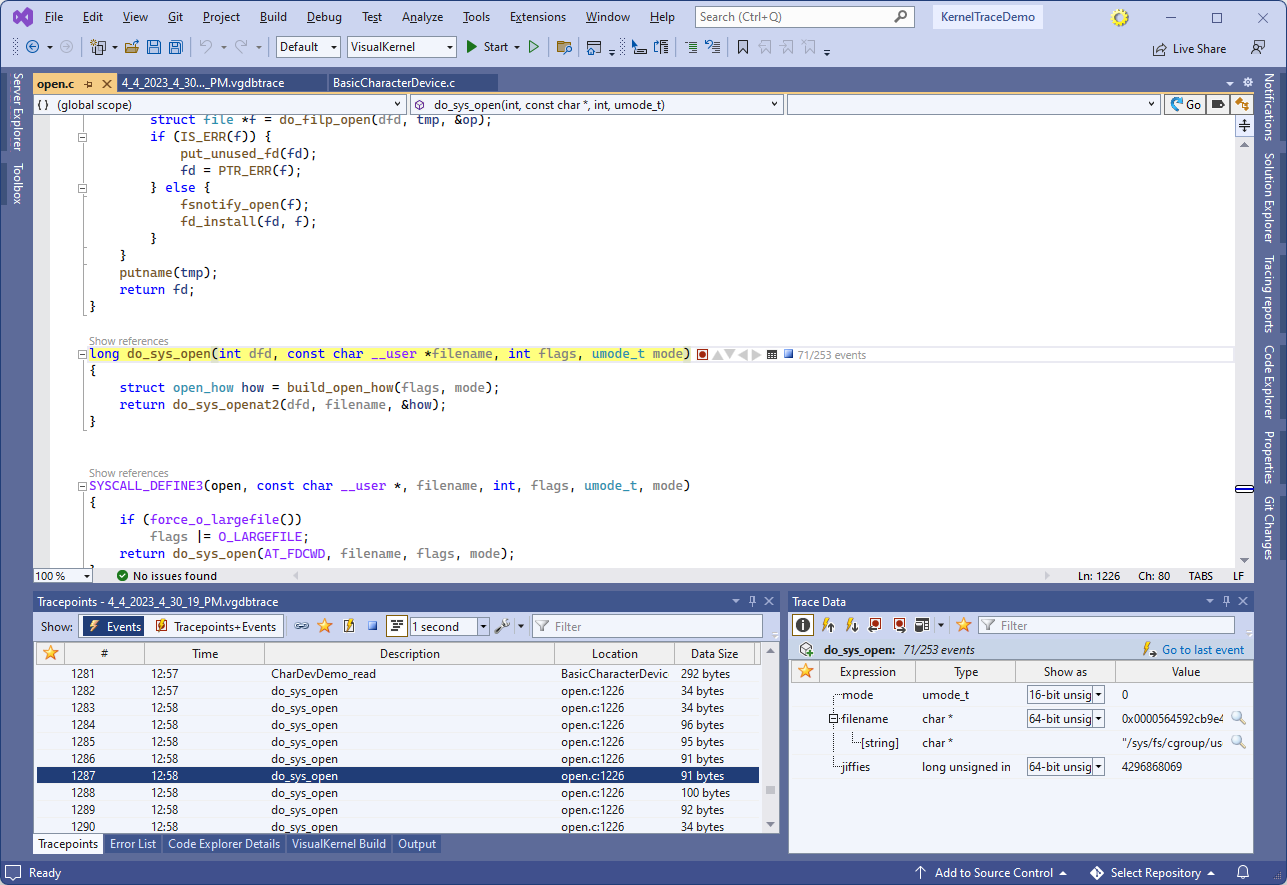
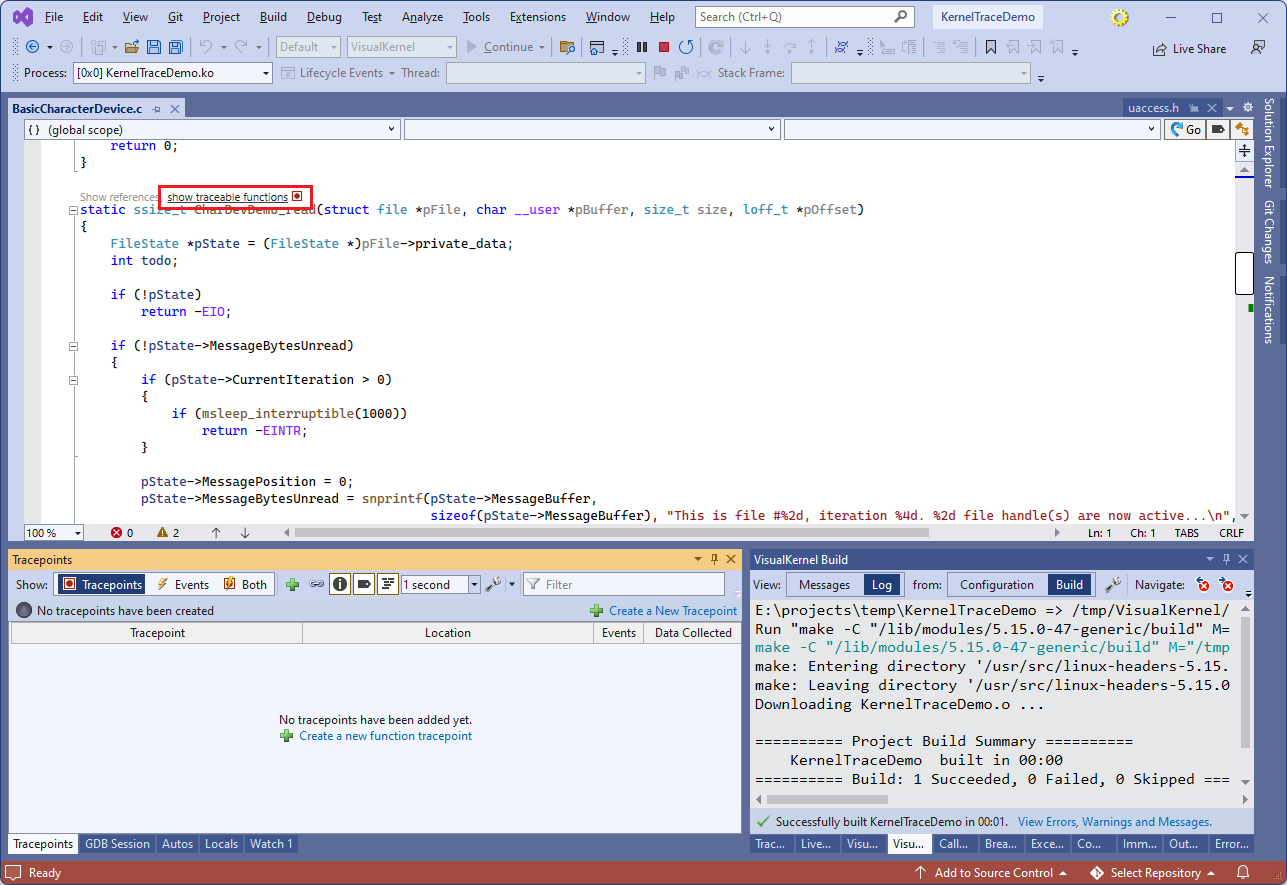
- Switch back to the Visual Studio window. One way to debug the module would be to set breakpoints in various places and step through the code. However, it would stop the entire target system in the debugger, possibly causing timeouts. Also, setting breakpoints in frequently hit functions could be impractical. To address these limitations, VisualKernel allows setting tracepoints in arbitrary code locations, that run without stopping the target. Click on the “show traceable functions” label near the CharDevDemo_read() function:
- VisualKernel will load the list of traceable functions in the kernel and the currently loaded module. Click on the tracepoint icon again and select to trace the pFile, size, pOffset variables:
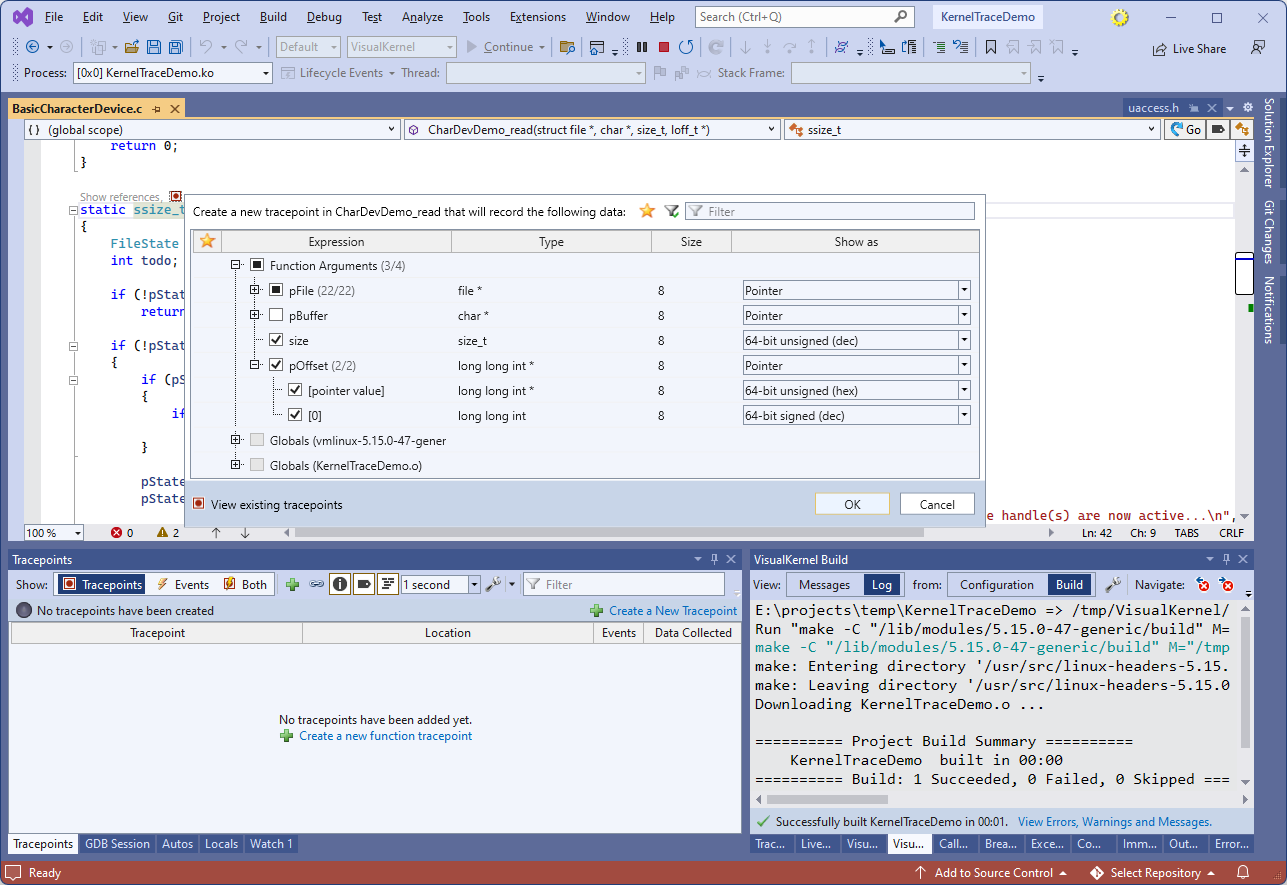
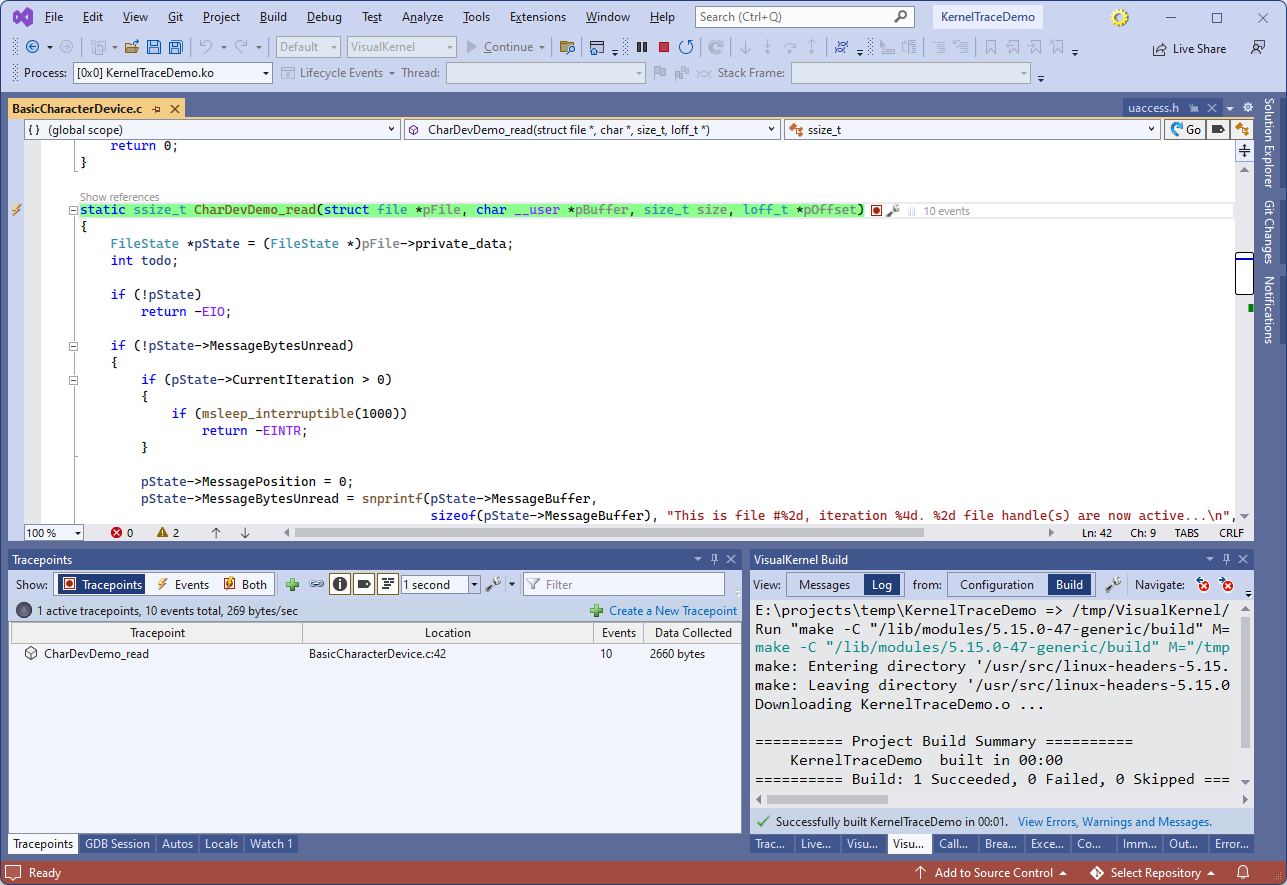
- Click OK to set the tracepoint. VisualKernel will immediately create it without having to stop the target, and will begin recording events. You can view the events by clicking on the tracepoint label, or via Debug->Windows->Tracepoints:
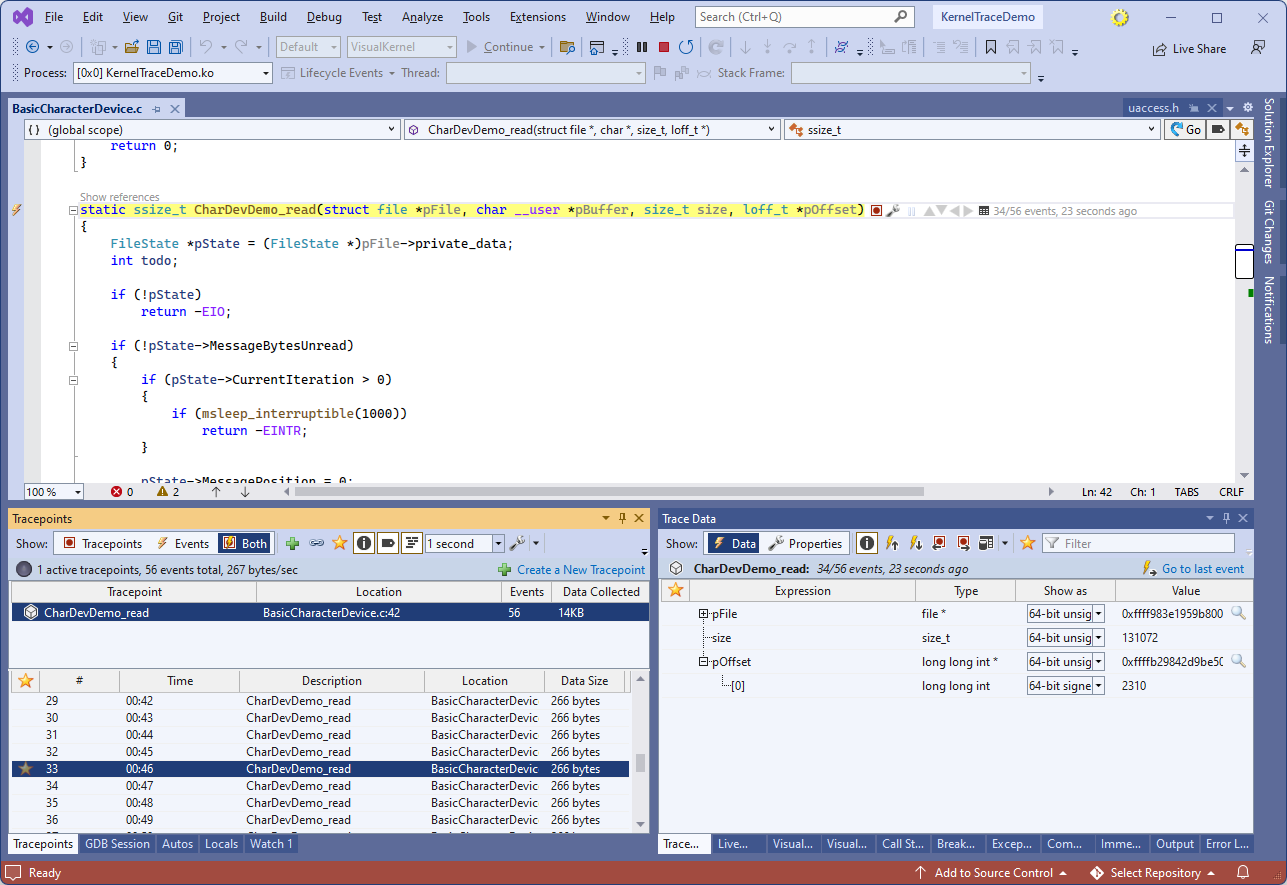
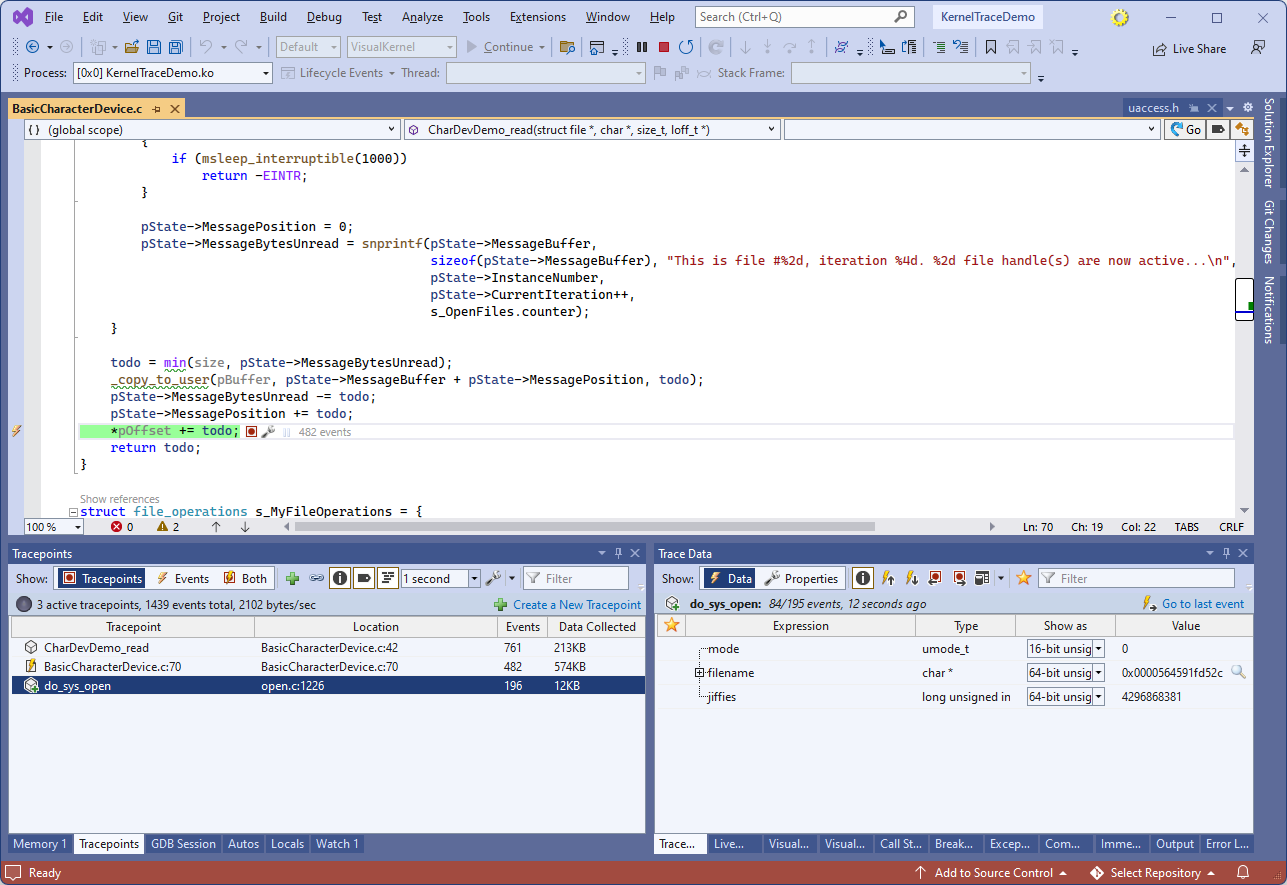
- Switch the Tracepoints view to “Both” (Tracepoints + Events) and select any of the recorded events. The values of the recorded variables will be shown in the Trace Data window:
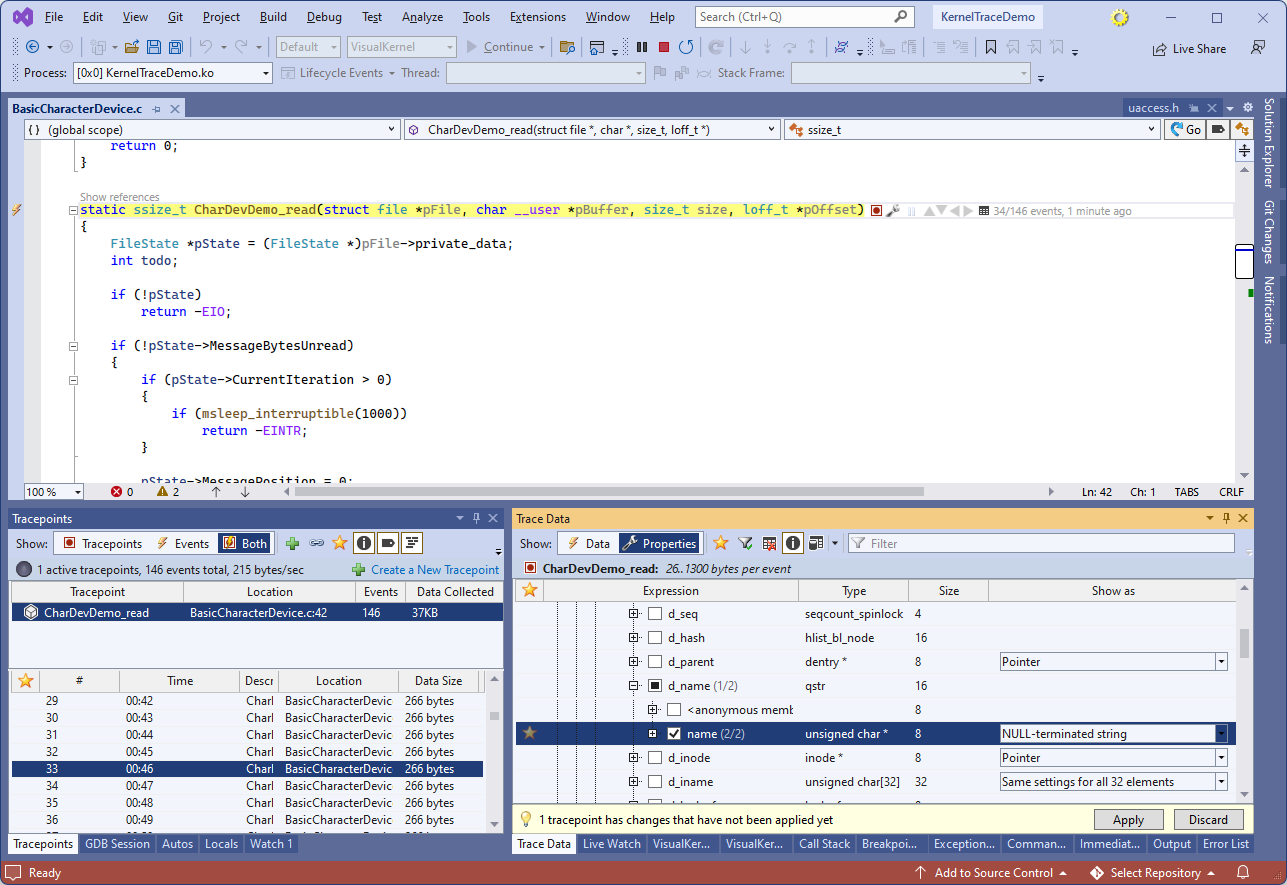
- Note that we recorded all fields of the struct file, but did not descend enough to capture the actual file name. You can change it by switching the Trace Data view to Properties:

- Then, locate pFile->f_path->dentry->d_name, check it and set the type to NULL-terminated string:
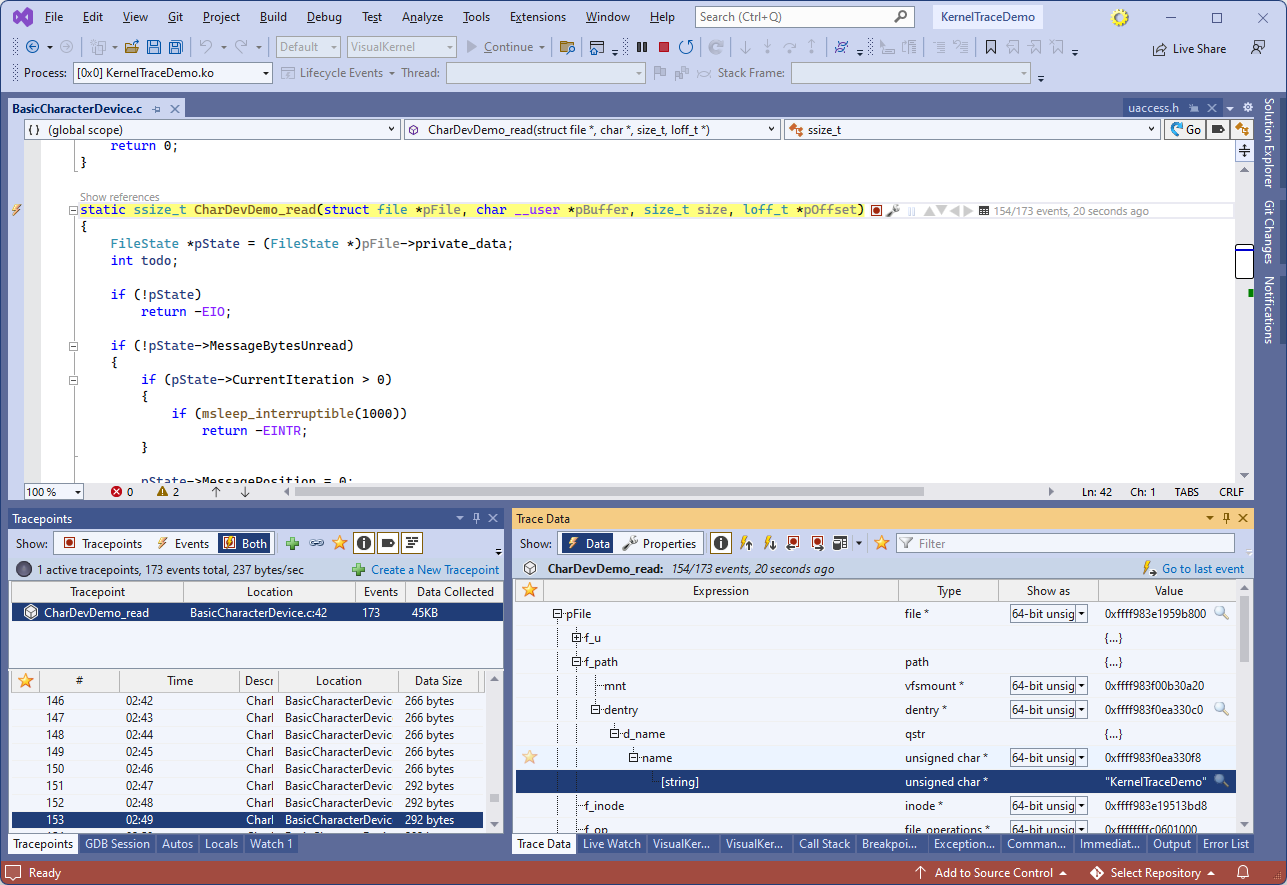
- Now every time the CharDeevDemo_read() function is traced, VisualKernel will record the name of the file as well:
- You can set the tracepoints at arbitrary code lines as well. Click on the tracepoint bar to the left of the breakpoint bar on the “*pOffset += todo” line in CharDevDemo_read(). Select to trace pBuffer, size and pOffset. Then, switch pBuffer view to “Dynamic array“:
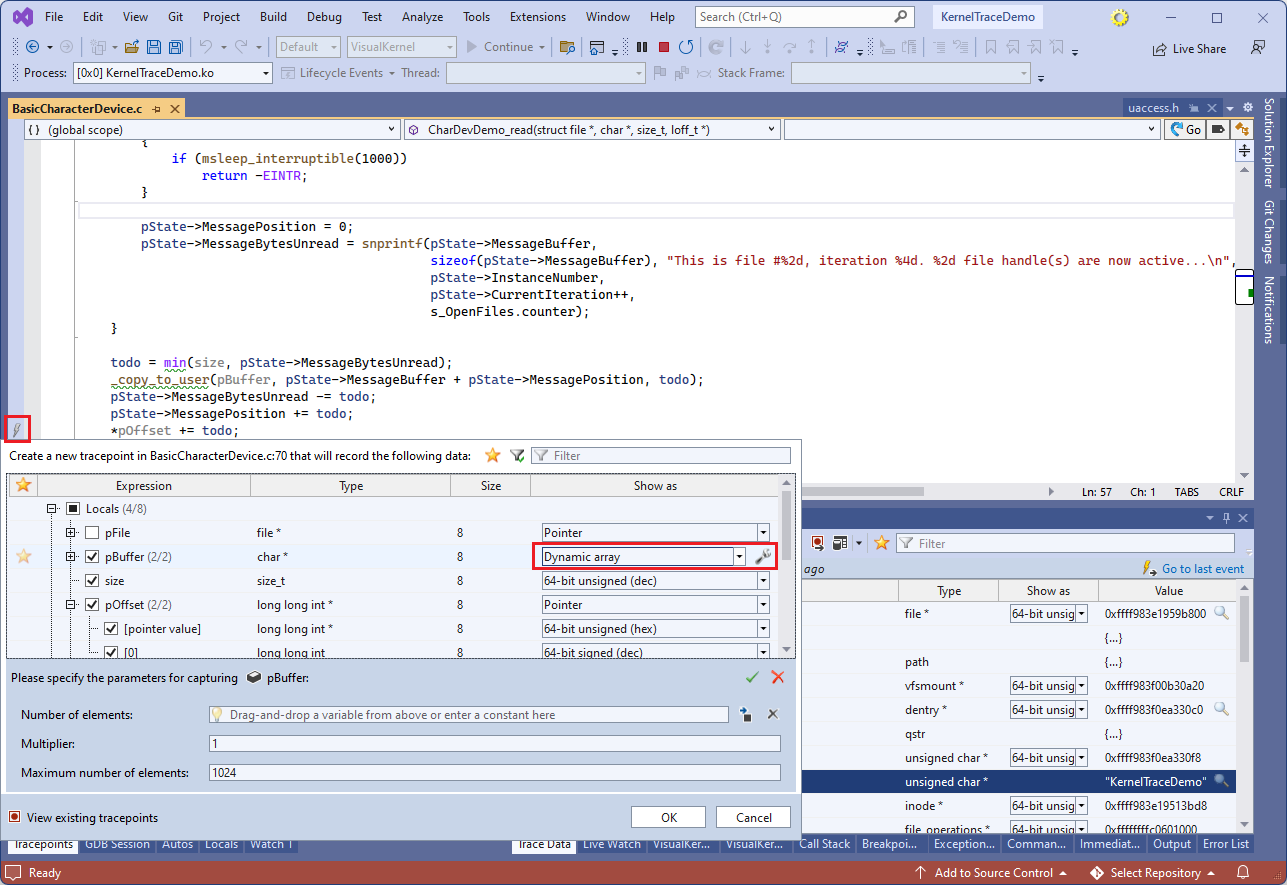
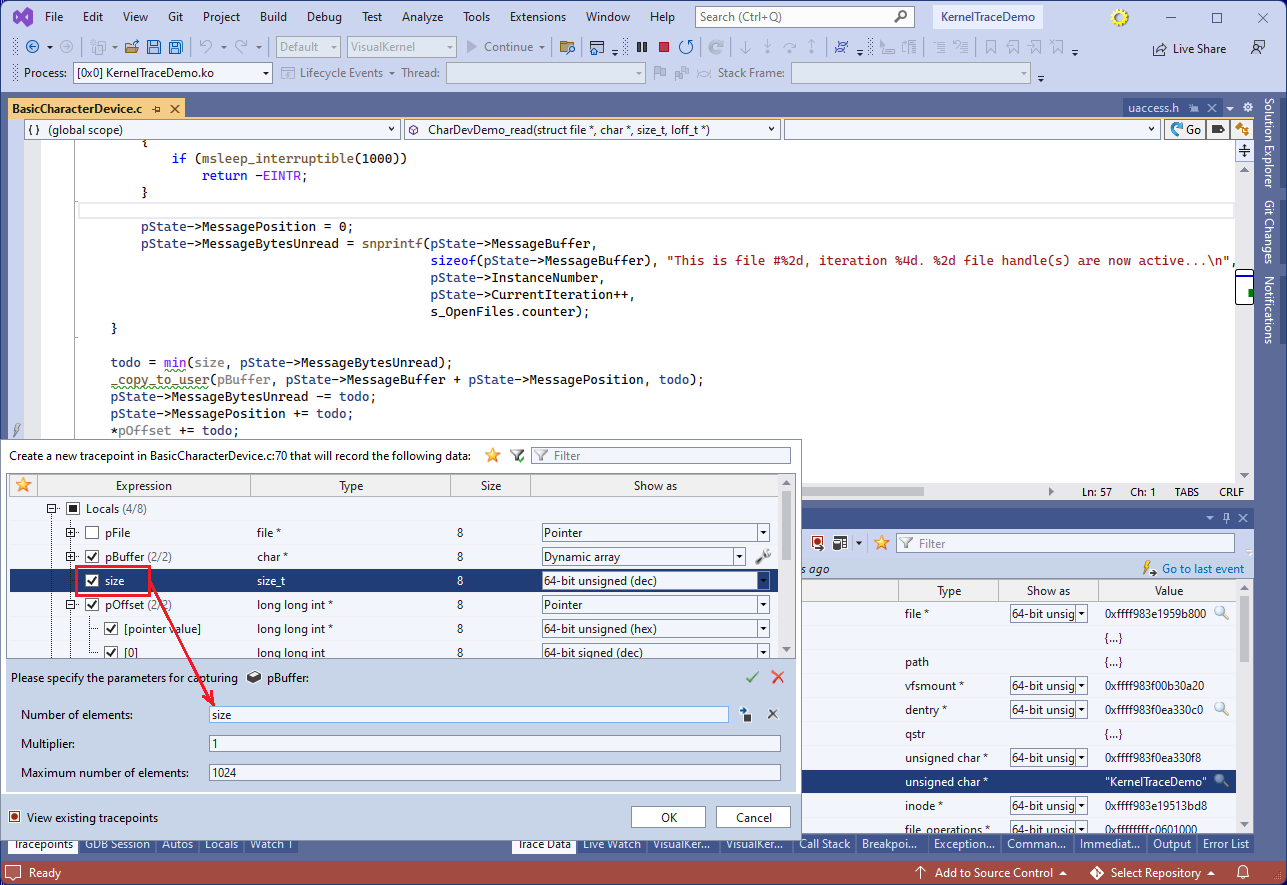
- VisualKernel will show the parameters for tracing pBuffer below. Drag the size item into the “number of elements” field below so that VisualKernel will record [size] elements from the byte array pointed by pBuffer:
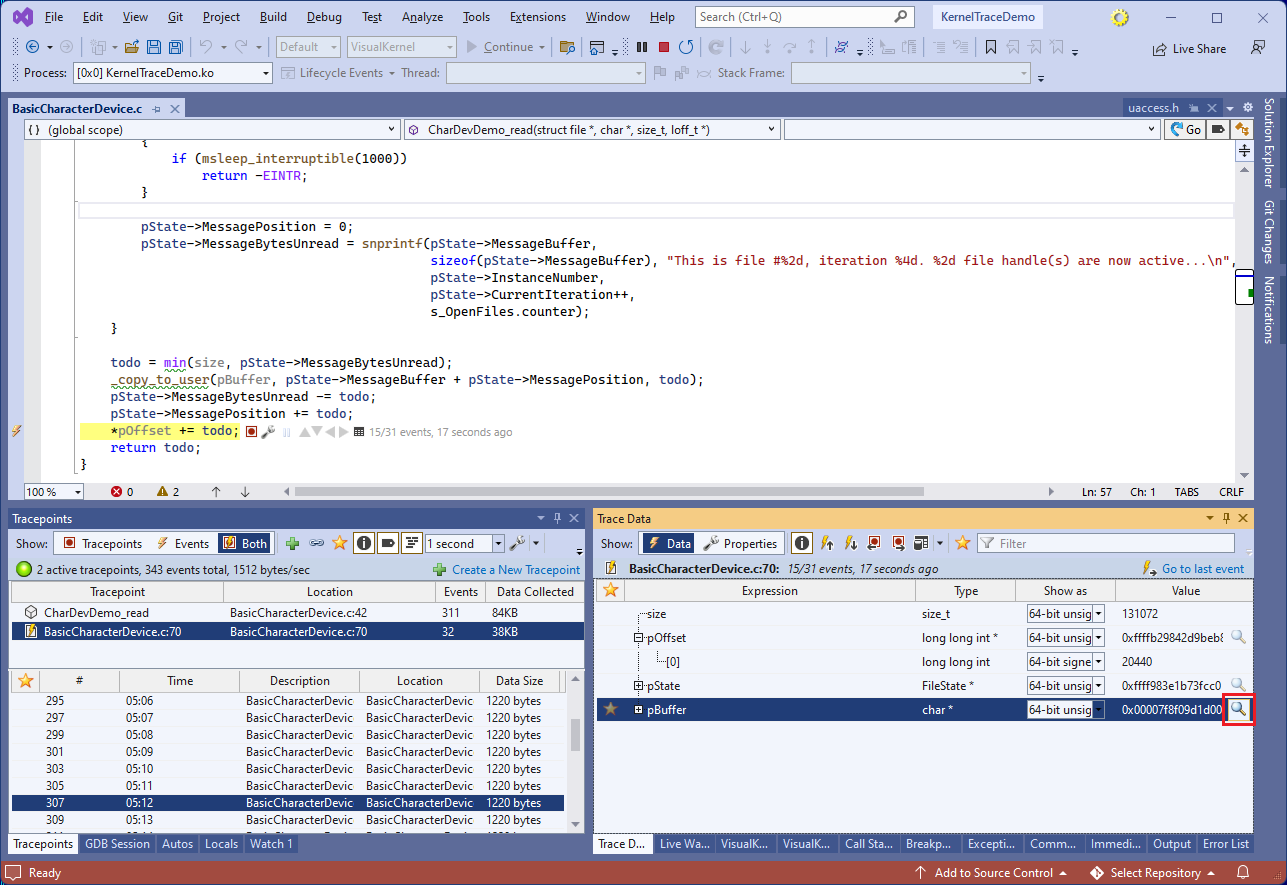
- Press OK to set the tracepoint. See how the recorded data now contains pBuffer as well. Click on the details button near pBuffer:
- VisualKernel will open the Memory window, showing the captured contents of pBuffer:
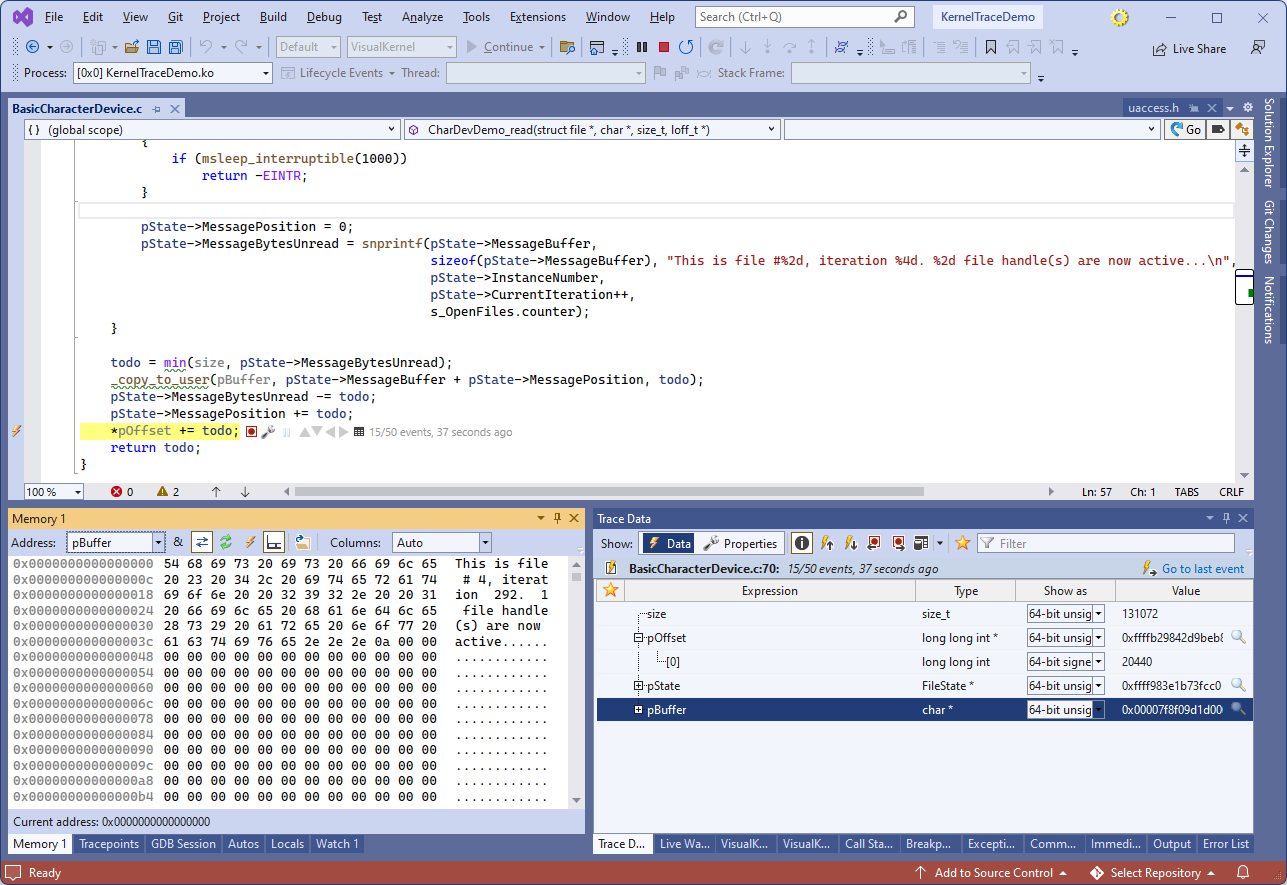 Note that none of the steps shown so far actually stops the target. The trace events are generated in the background, streamed into VisualKernel via network, and stored in a trace file, where you can review them at your convenience, while the target is still running uninterrupted.
 - Now we will show how to efficiently navigate through large amounts of trace events. Click the “Views” button in the Trace Data window and select “Create a new table view“:

- When the new view window opens, select one of the CharDevDemo_read events and drag the pOffset->[0] item into the Columns view:
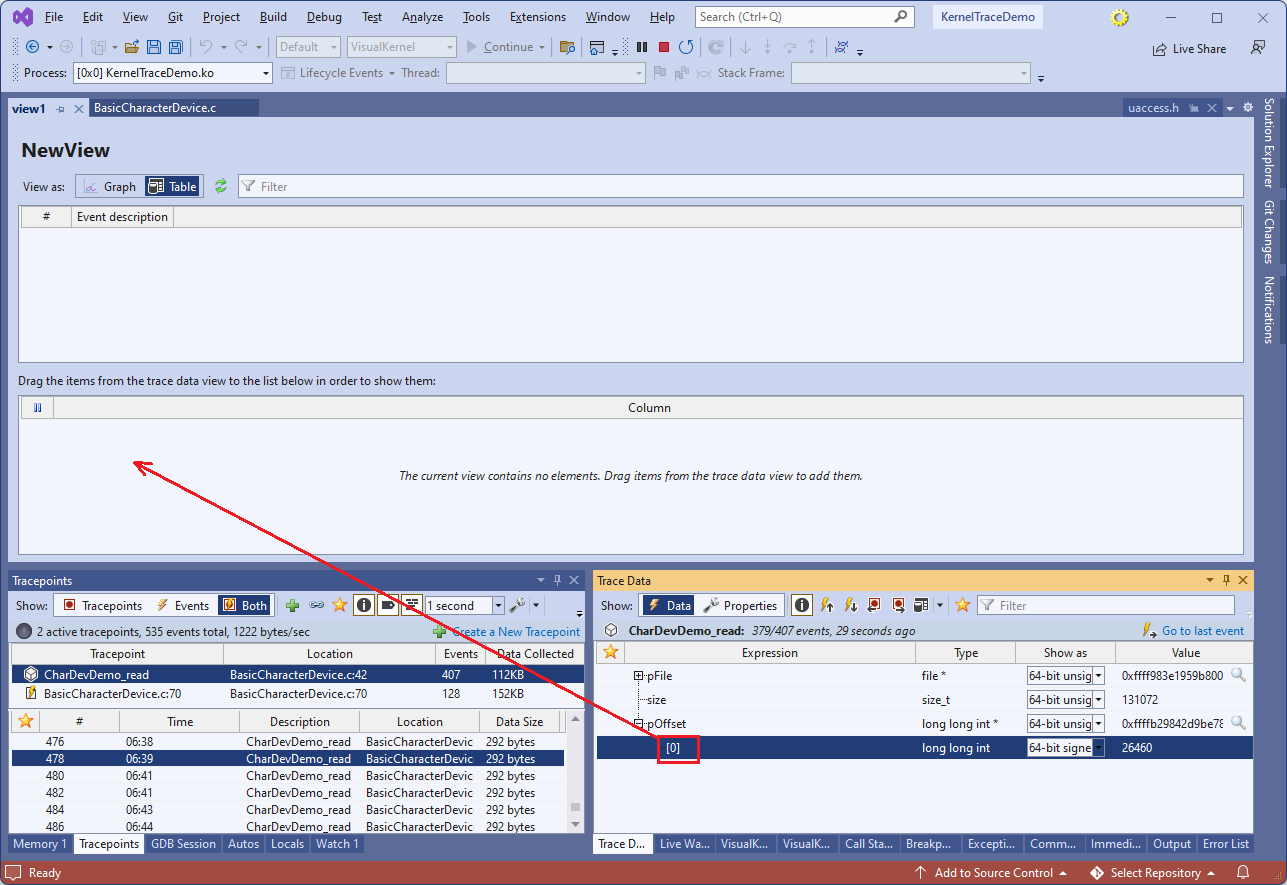
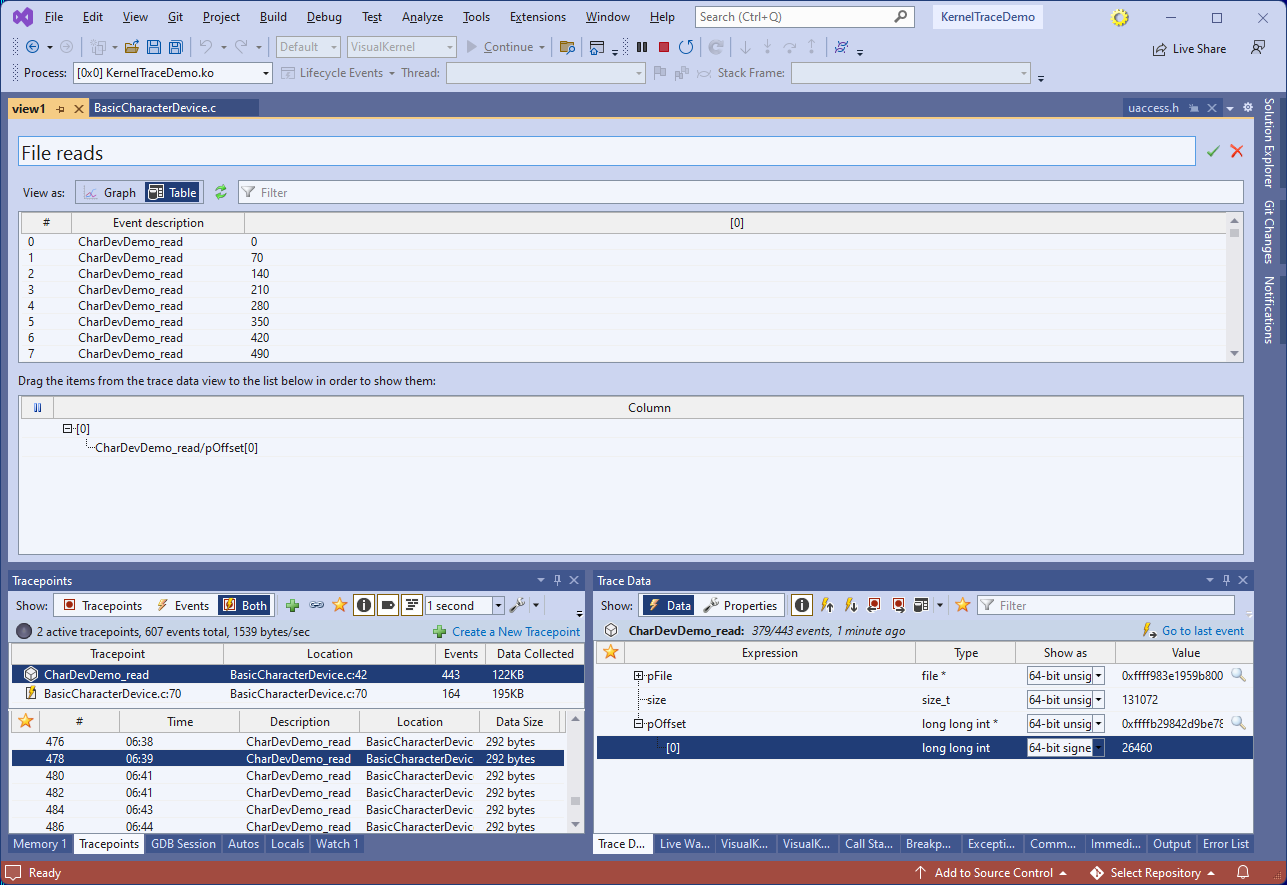
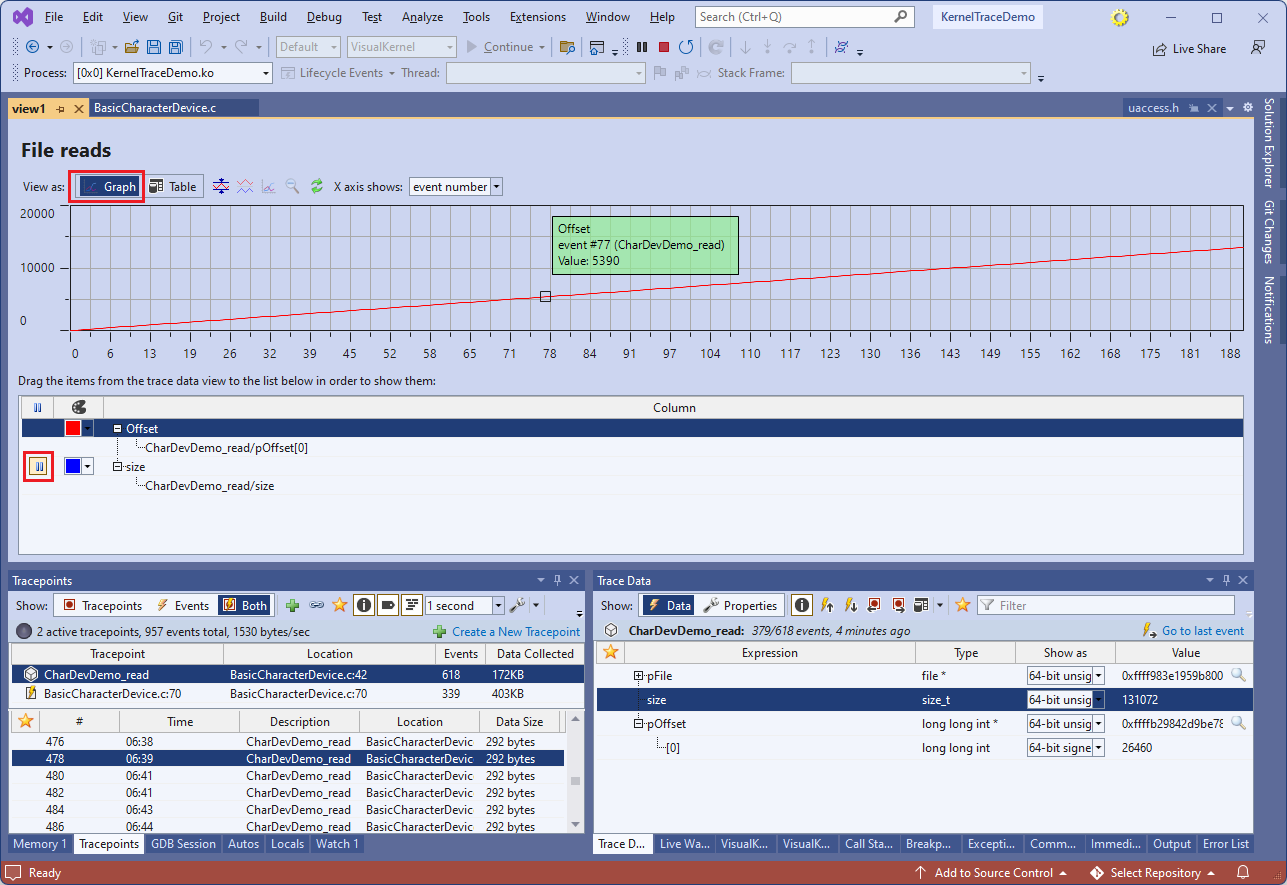
- VisualKernel will immediately show all events generated by that tracepoint, next to the value of pOffset[0]. Rename the view name to File reads:
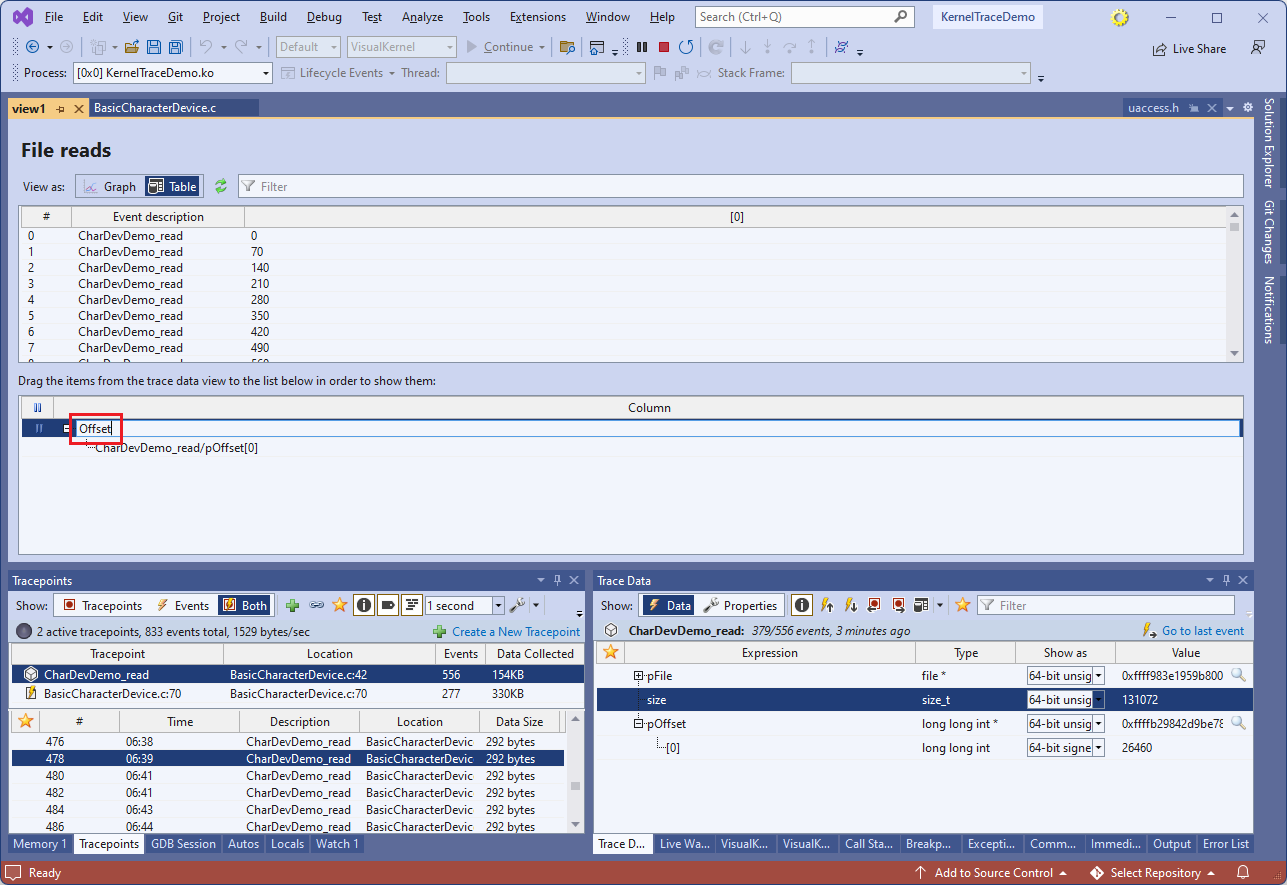
- You can similarly rename the [0] column to something more meaningful, e.g. Offset:
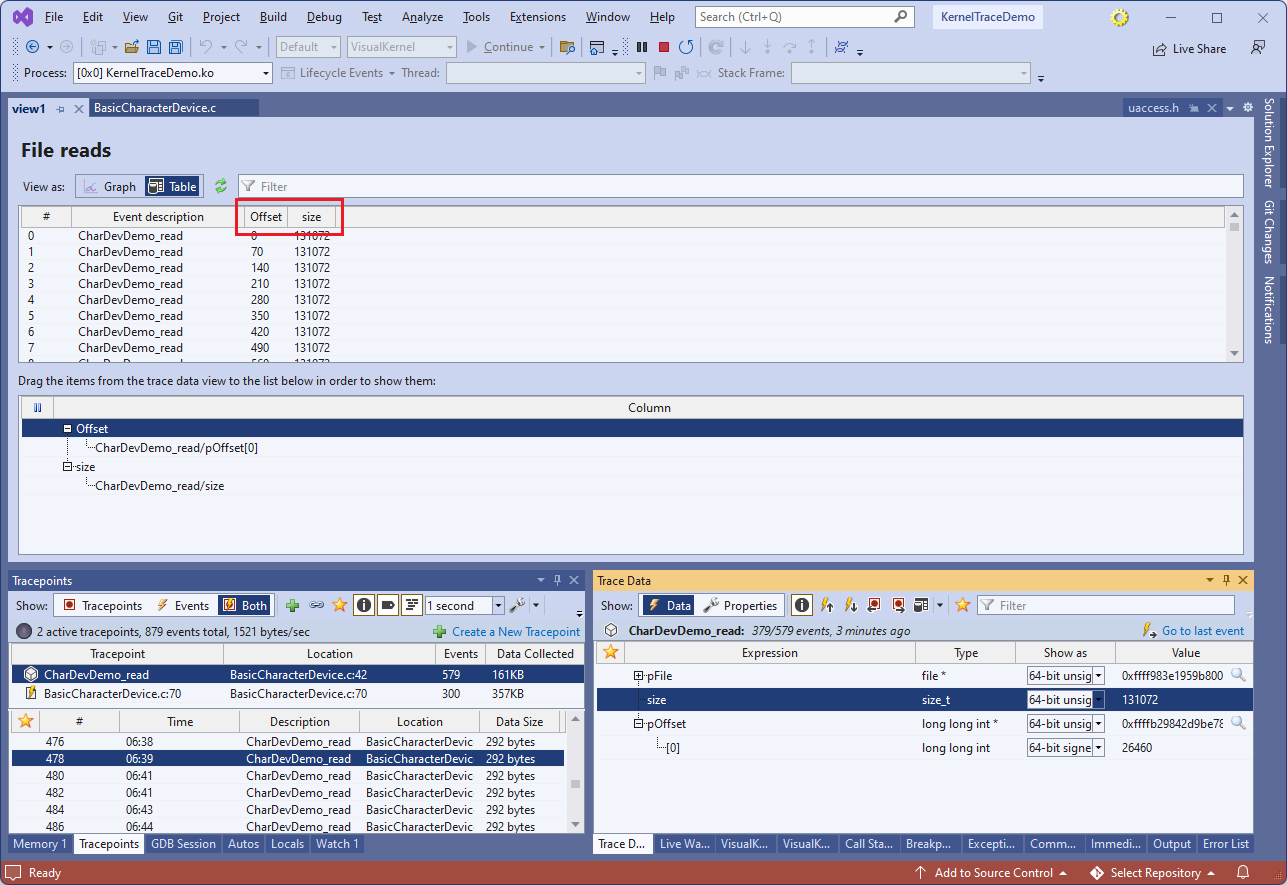
 Note that each column can contain multiple fields from different tracepoints. E.g. a column called “file descriptor” can contain the fd argument both sys_read() and sys_write(). In this case, each event produced by either of the 2 tracepoints will produce a row in the table view.
 - Similarly, drag the size field underneath the Offset row (dragging it straight into Offset row will add it under the Offset column):
- The table view allows sorting the events by any of the columns. You can also switch to the Graph view to plot the recorded data. Double-clicking on the table row, or graph point, will immediately go to the corresponding event, highlighting its location in the source code, and letting you examine the captured data via the Trace Data window:
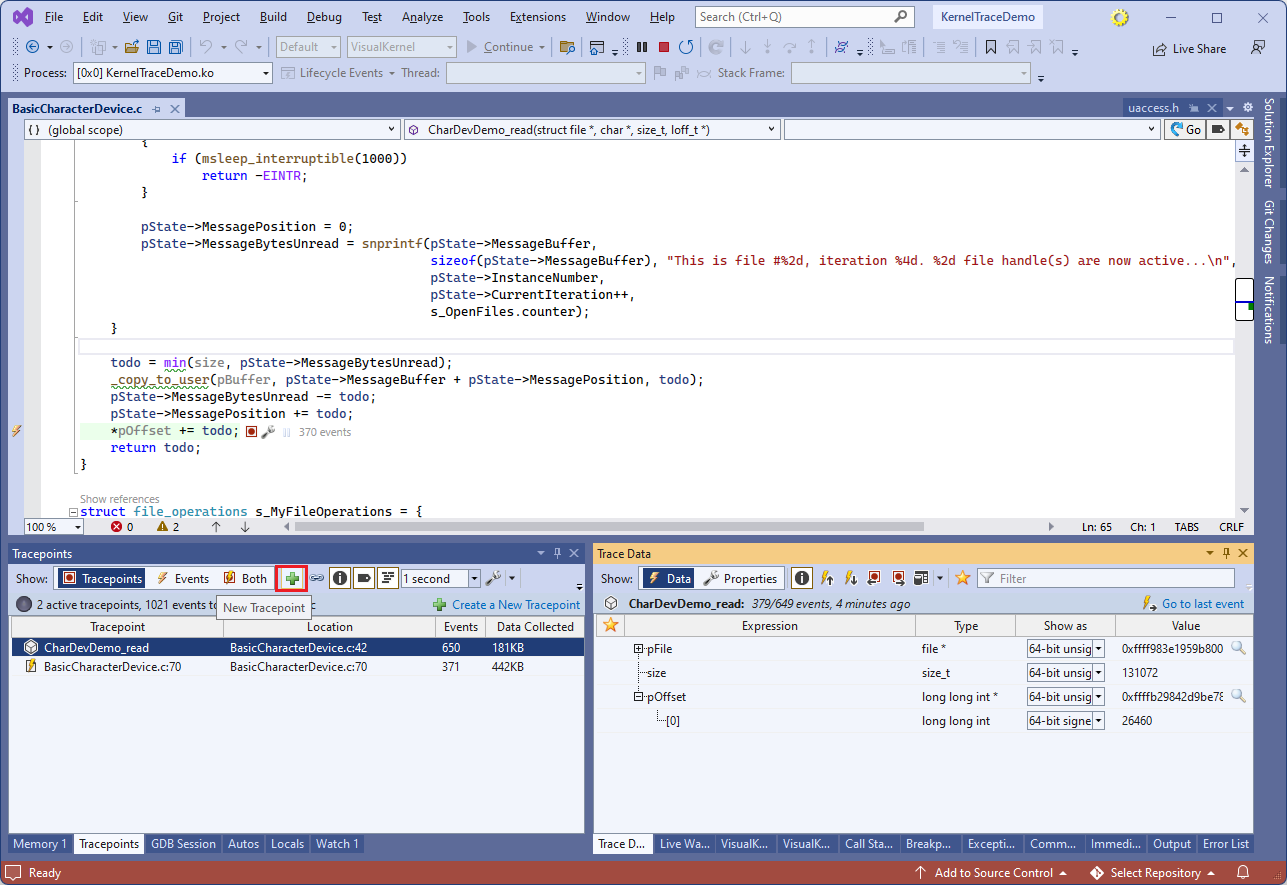
- You can also add tracepoints anywhere in the kernel by function name. Click on the New Tracepoint button in the Tracepoints window:
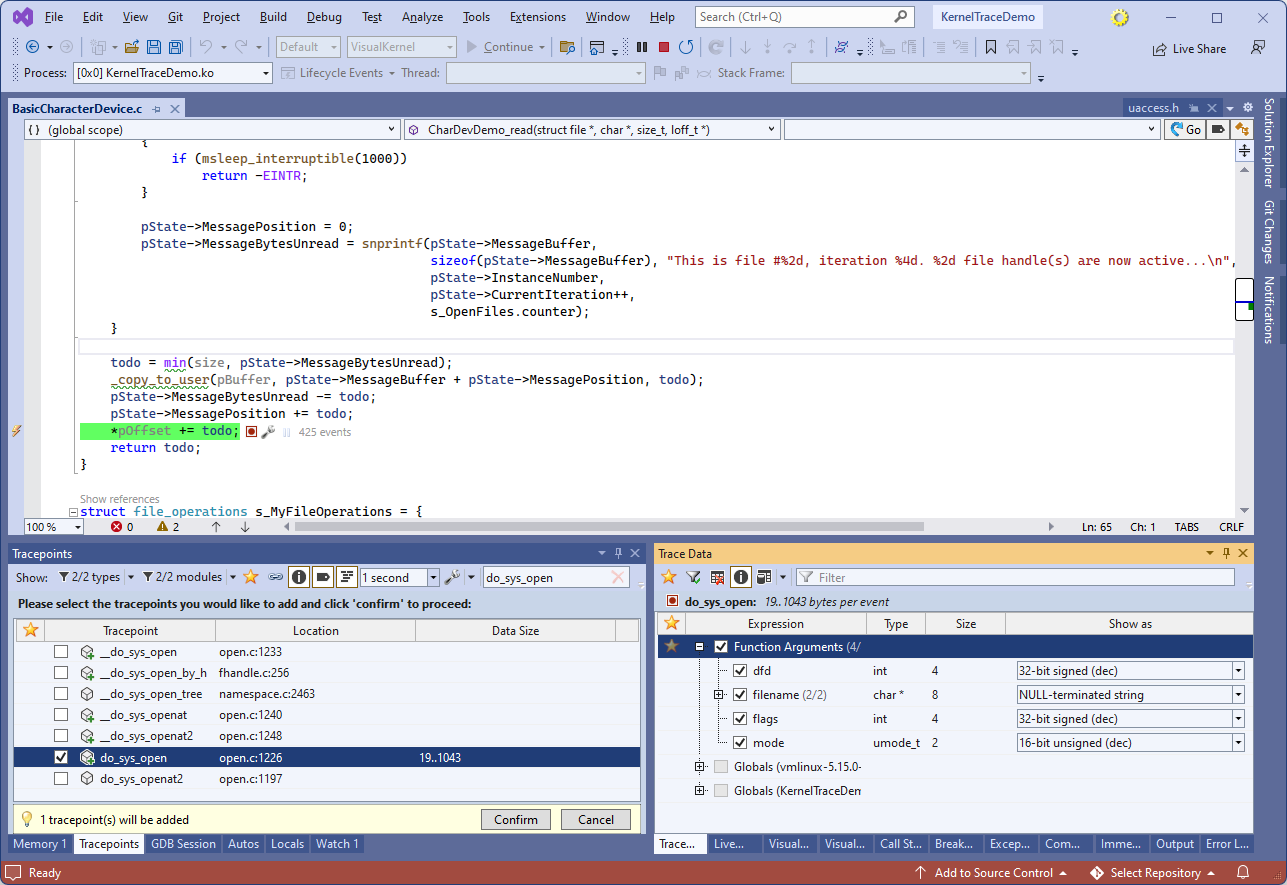
- Enter “do_sys_open” in the filter to quickly locate the do_sys_open() function. The filter box supports substrings, and regex-like “^” and “$” expressions. Once you enable the tracepoint, select to trace all function arguments:
- You can also trace arbitrary global variables. Enter “^jiffies” in the data filter and check the “jiffies” item:
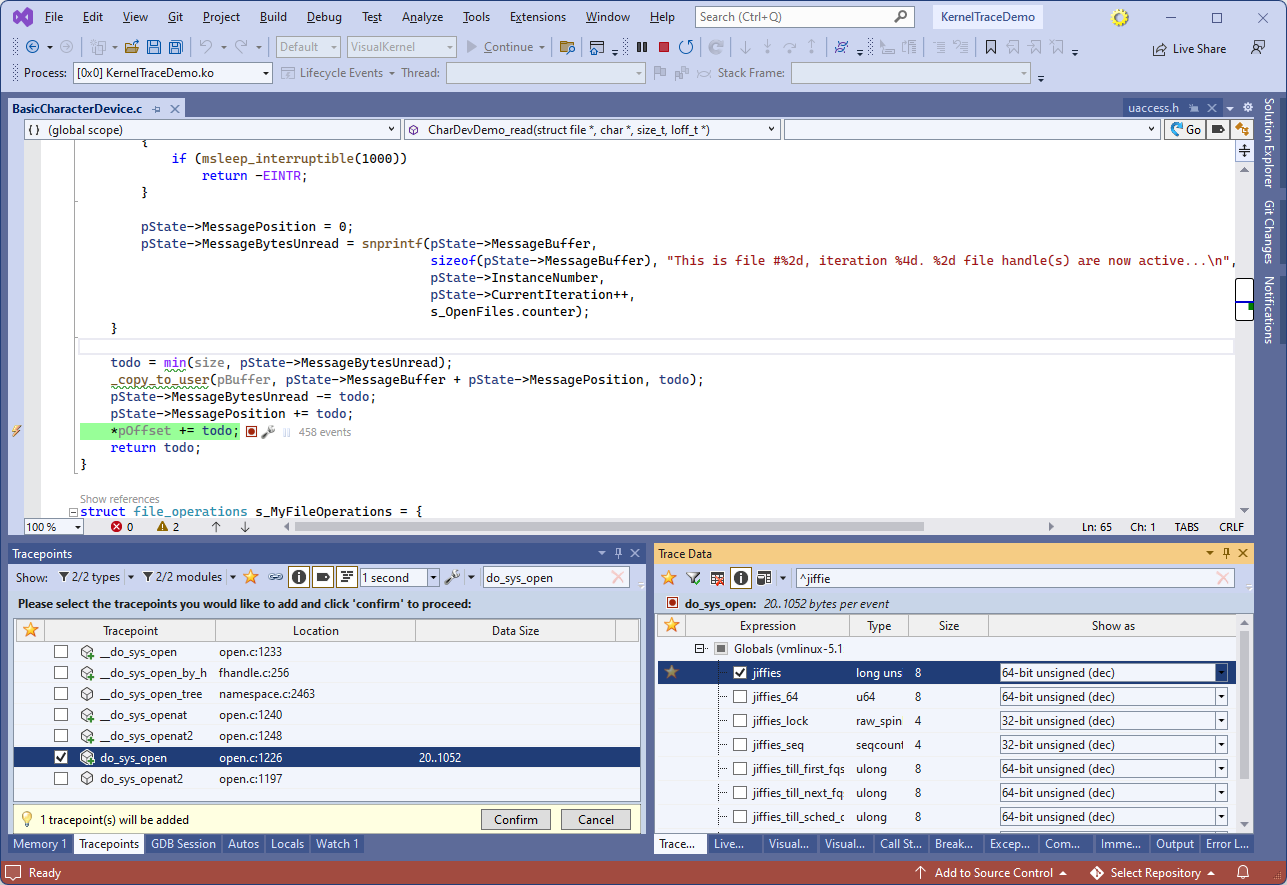
- VisualKernel will now record every call to do_sys_open(), including the inlined ones, and will record the relevant variables (e.g. flags could be optimized out for some inlining sites):
- Stop the debug session by pressing Shift-F5. VisualKernel will save a trace report to a file, allowing you to replay it later. You can view the list of reports for the current project via View->Profiling/Tracing Reports. For your own convenience, you can rename the reports or add arbitrary descriptions to them:
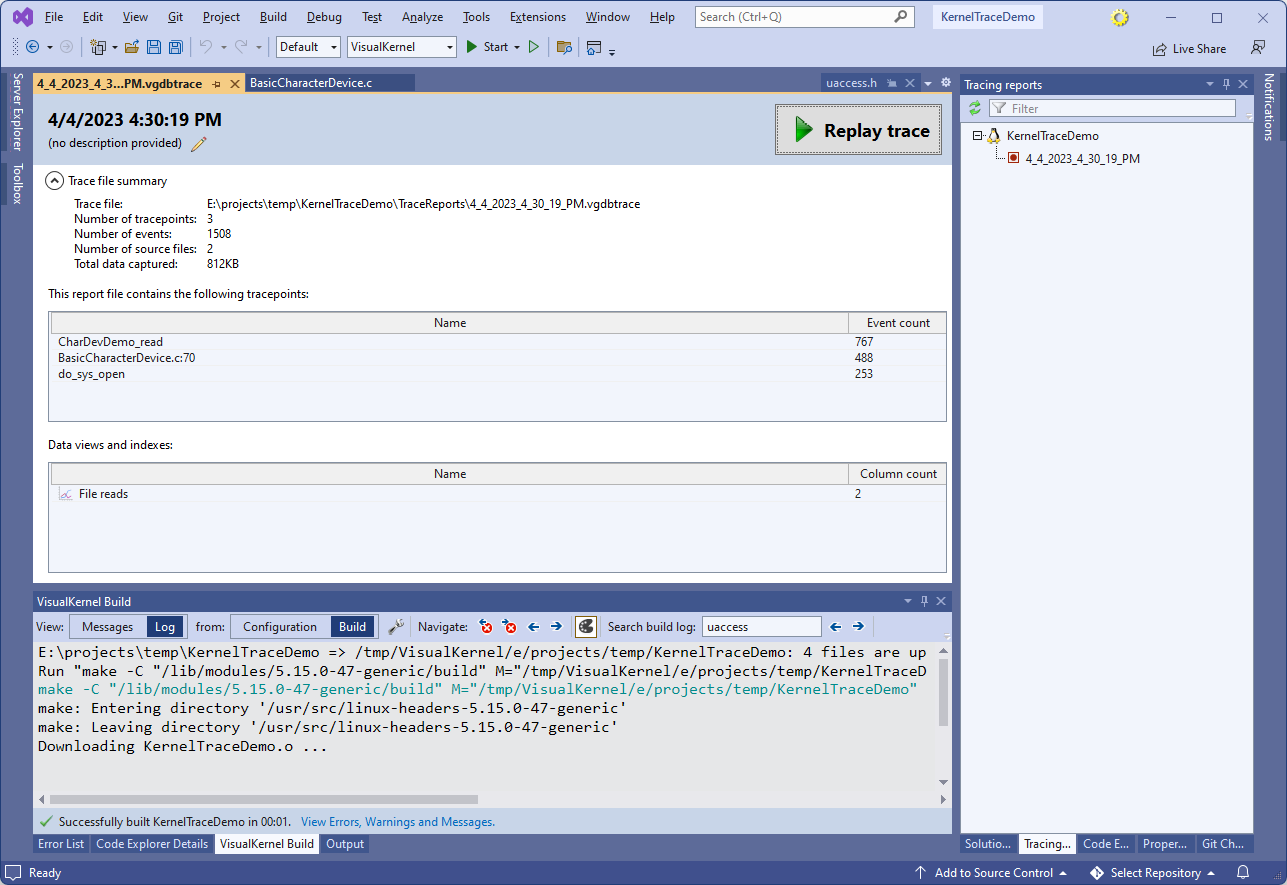
- Press the “Replay trace” button. VisualKernel will show the tracepoints and events recorded in the file. You can navigate between the events using the buttons in the event highlight, or via the Tracepoints window in Visual Studio: