The MockUp
  • Blog
  • TIL
  • Resources
  • About
Categories
All (40)
API (1)
Automation (1)
Community (1)
JSON (2)
NFL (12)
SQL (1)
TidyTuesday (4)
blog (1)
crosstalk (1)
data cleaning (1)
data visualization (9)
distill (1)
espnscrapeR (3)
functions (1)
ggplot2 (7)
gt (6)
joins (1)
magick (4)
meta (7)
nfl (1)
nflfastR (1)
nflscrapR (1)
pdftools (1)
plotly (1)
probability (1)
purrr (4)
quarto (2)
reactable (1)
reprex (1)
rmarkdown (4)
simulation (1)
statistics (2)
tables (10)
testing (1)
theme (1)
tidymodels (1)
tidyverse (25)
web scraping (4)
xaringan (1)
Author

Tom Mock

Want to support my blog? Buy Me A Coffee

Image

Removing background from GenAI art

We all deserve transparency

2023-09-15
1 min

Image

Rolling summaries with {slider} in R

Slip and slide with the tidyverse

2022-11-16
7 min

Image

Use R to generate a Quarto blogpost

The {cli} and {fs} packages make life easy!

2022-11-08
11 min

Image

Add a semi-transparent overlay to an image with {magick}

Because who has time for CSS and gradients?

2022-06-22
4 min

The hex logo for gtExtras, it is primarily a pixel-art inspired table with a computer, a gin and tonic cocktail, and a small cactus on top, below the desk is a small boston terrier.

Beautiful tables in R with gtExtras

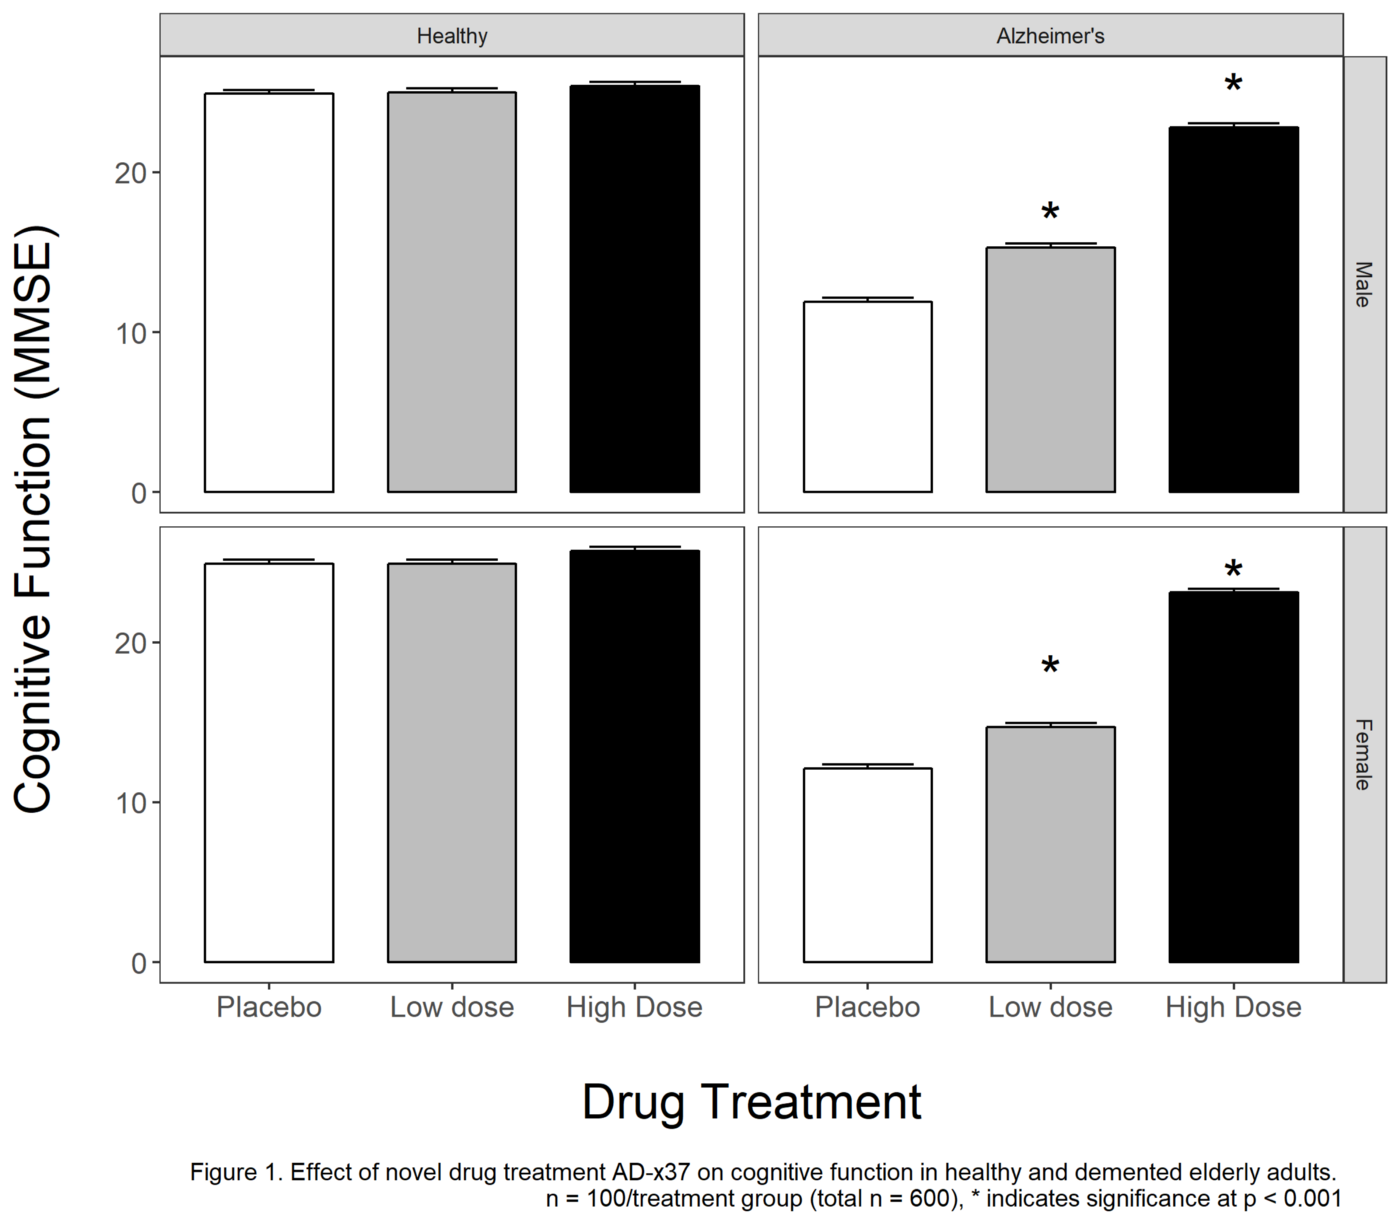
Merging static tables with graphics is a powerful combo

2022-06-13
14 min

A polaroid camera sitting lens up in a pile of fallen brown leaves

Adding session info to blog posts

A snapshot of your code state

2022-04-18
5 min

Image

Displaying verbatim code chunks in RMarkdown and Xaringan presentations

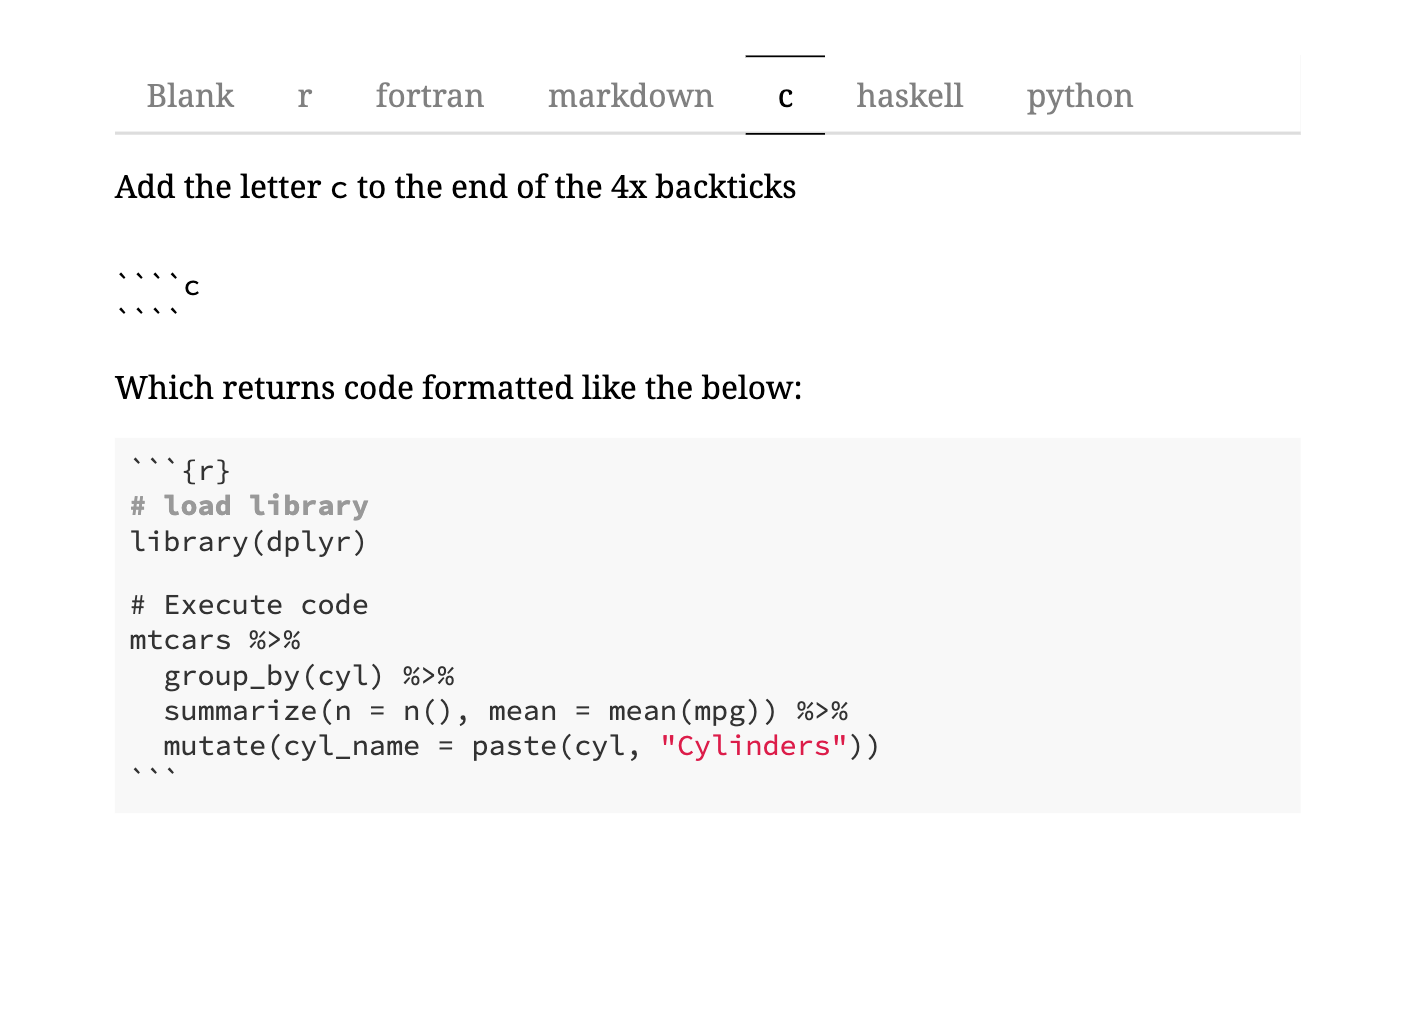
Because the best way to teach RMarkdown is with RMarkdown.

2021-08-27
7 min

A 3x3 grid facetted by quarter of the observation number on the X axis and the rolling max, min, and average on the Y-axis.

Reminder to test with a reprex

“It’s basically the rubber duck in disguise” - Jenny Bryan.

2021-07-28
11 min

Image

Three years of TidyTuesday

The future holds a deeper focus on inclusivity.

2021-04-01
18 min

Image

Including and meta tagging extra content in a distill blog

Collect and organize all your content, and then customize how it appears on social media.

2021-03-21
10 min

Image

Creating a custom gt function for aligning first-row text and testing it with testthat

Creating and testing your own functions is fun!

2021-03-07
16 min

Image

Joins vs case whens - speed and memory tradeoffs

Spoiler - joins are fastest, and can be easy to prep!

2021-02-13
28 min

Image

Removing image backgrounds with magick

Tables with dark backgrounds deserve transparent logos!

2021-01-28
14 min

Image

Reading tables from images with magick

magick is an R package for manipulating images in R

2021-01-18
19 min

Image

2020 in Review

Surviving a pandemic at home.

2020-12-31
10 min

Image

Creating and using custom ggplot2 themes

The best way to make each plot your own.

2020-12-26
40 min

Image

Extracting JSON data from websites and public APIs with R

tidyr + jsonlite are magical.

2020-12-13
27 min

Image

Bullet Chart Variants in R

Efficient display of several measures at once.

2020-11-29
20 min

Image

Embedding custom HTML in gt tables

HTML is basically a superpower.

2020-10-31
30 min

Image

Plotting Points as Images in ggplot

Trials and tribulations of the various strategies.

2020-10-11
19 min

Image

Functions and Themes for gt tables

Save time and effort in making beautiful tables

2020-09-28
22 min

Image

10+ Guidelines for Better Tables in R

Make tables people ACTUALLY want to read.

2020-09-04
61 min

Image

Heatmaps in ggplot2

It’s more than just a passing fad.

2020-08-28
23 min

Image

Building a blog with distill

I love simplicity.

2020-08-01
13 min

Image

A bar chart 5 ways in ggplot2

Andy, Tom, and ggplot2 walk into a bar…

2020-08-01
9 min

Image

Meta RMarkdown - Taxonomy and Use cases

A meta collection of all things R Markdown.

2020-07-25
13 min

Image

Client-side interactivity - do more with Crosstalk

Because sharing data is caring

2020-05-29
17 min

Image

Easily parsing JSON in R with jsonlite and purrr

It’s turtles all the way down…

2020-05-22
16 min

Image

gt - a (G)rammar of (T)ables

Not to be confused with a Game of Thrones

2020-05-18
19 min

Image

reactable - An Interactive Tables Guide

Part 2: How to draw the rest of the owl.

2020-05-15
19 min

Image

QB Salaries vs Playoff Appearances

Interactive tables make bad takes more fun.

2020-05-13
9 min

Image

Flipping tibbles for many models

Pivoting data from wide to long to run many models at once

2020-05-01
8 min

Image

Bigger, nflfastR, dbplyr

Doing more with dplyr and SQL

2020-04-28
15 min

Image

Beer and pdftools - a vignette

A guide to extracting tables from many PDFs using the pdftools package

2020-04-04
18 min

Image

Crossing 10,000 - Tidy simulation

Tidy simulation with dice rolls

2020-04-03
11 min

Image

Add a logo to your plot

Put a bird on it - Portlandia.

2019-01-09
8 min

Image

TidyTuesday enhancements

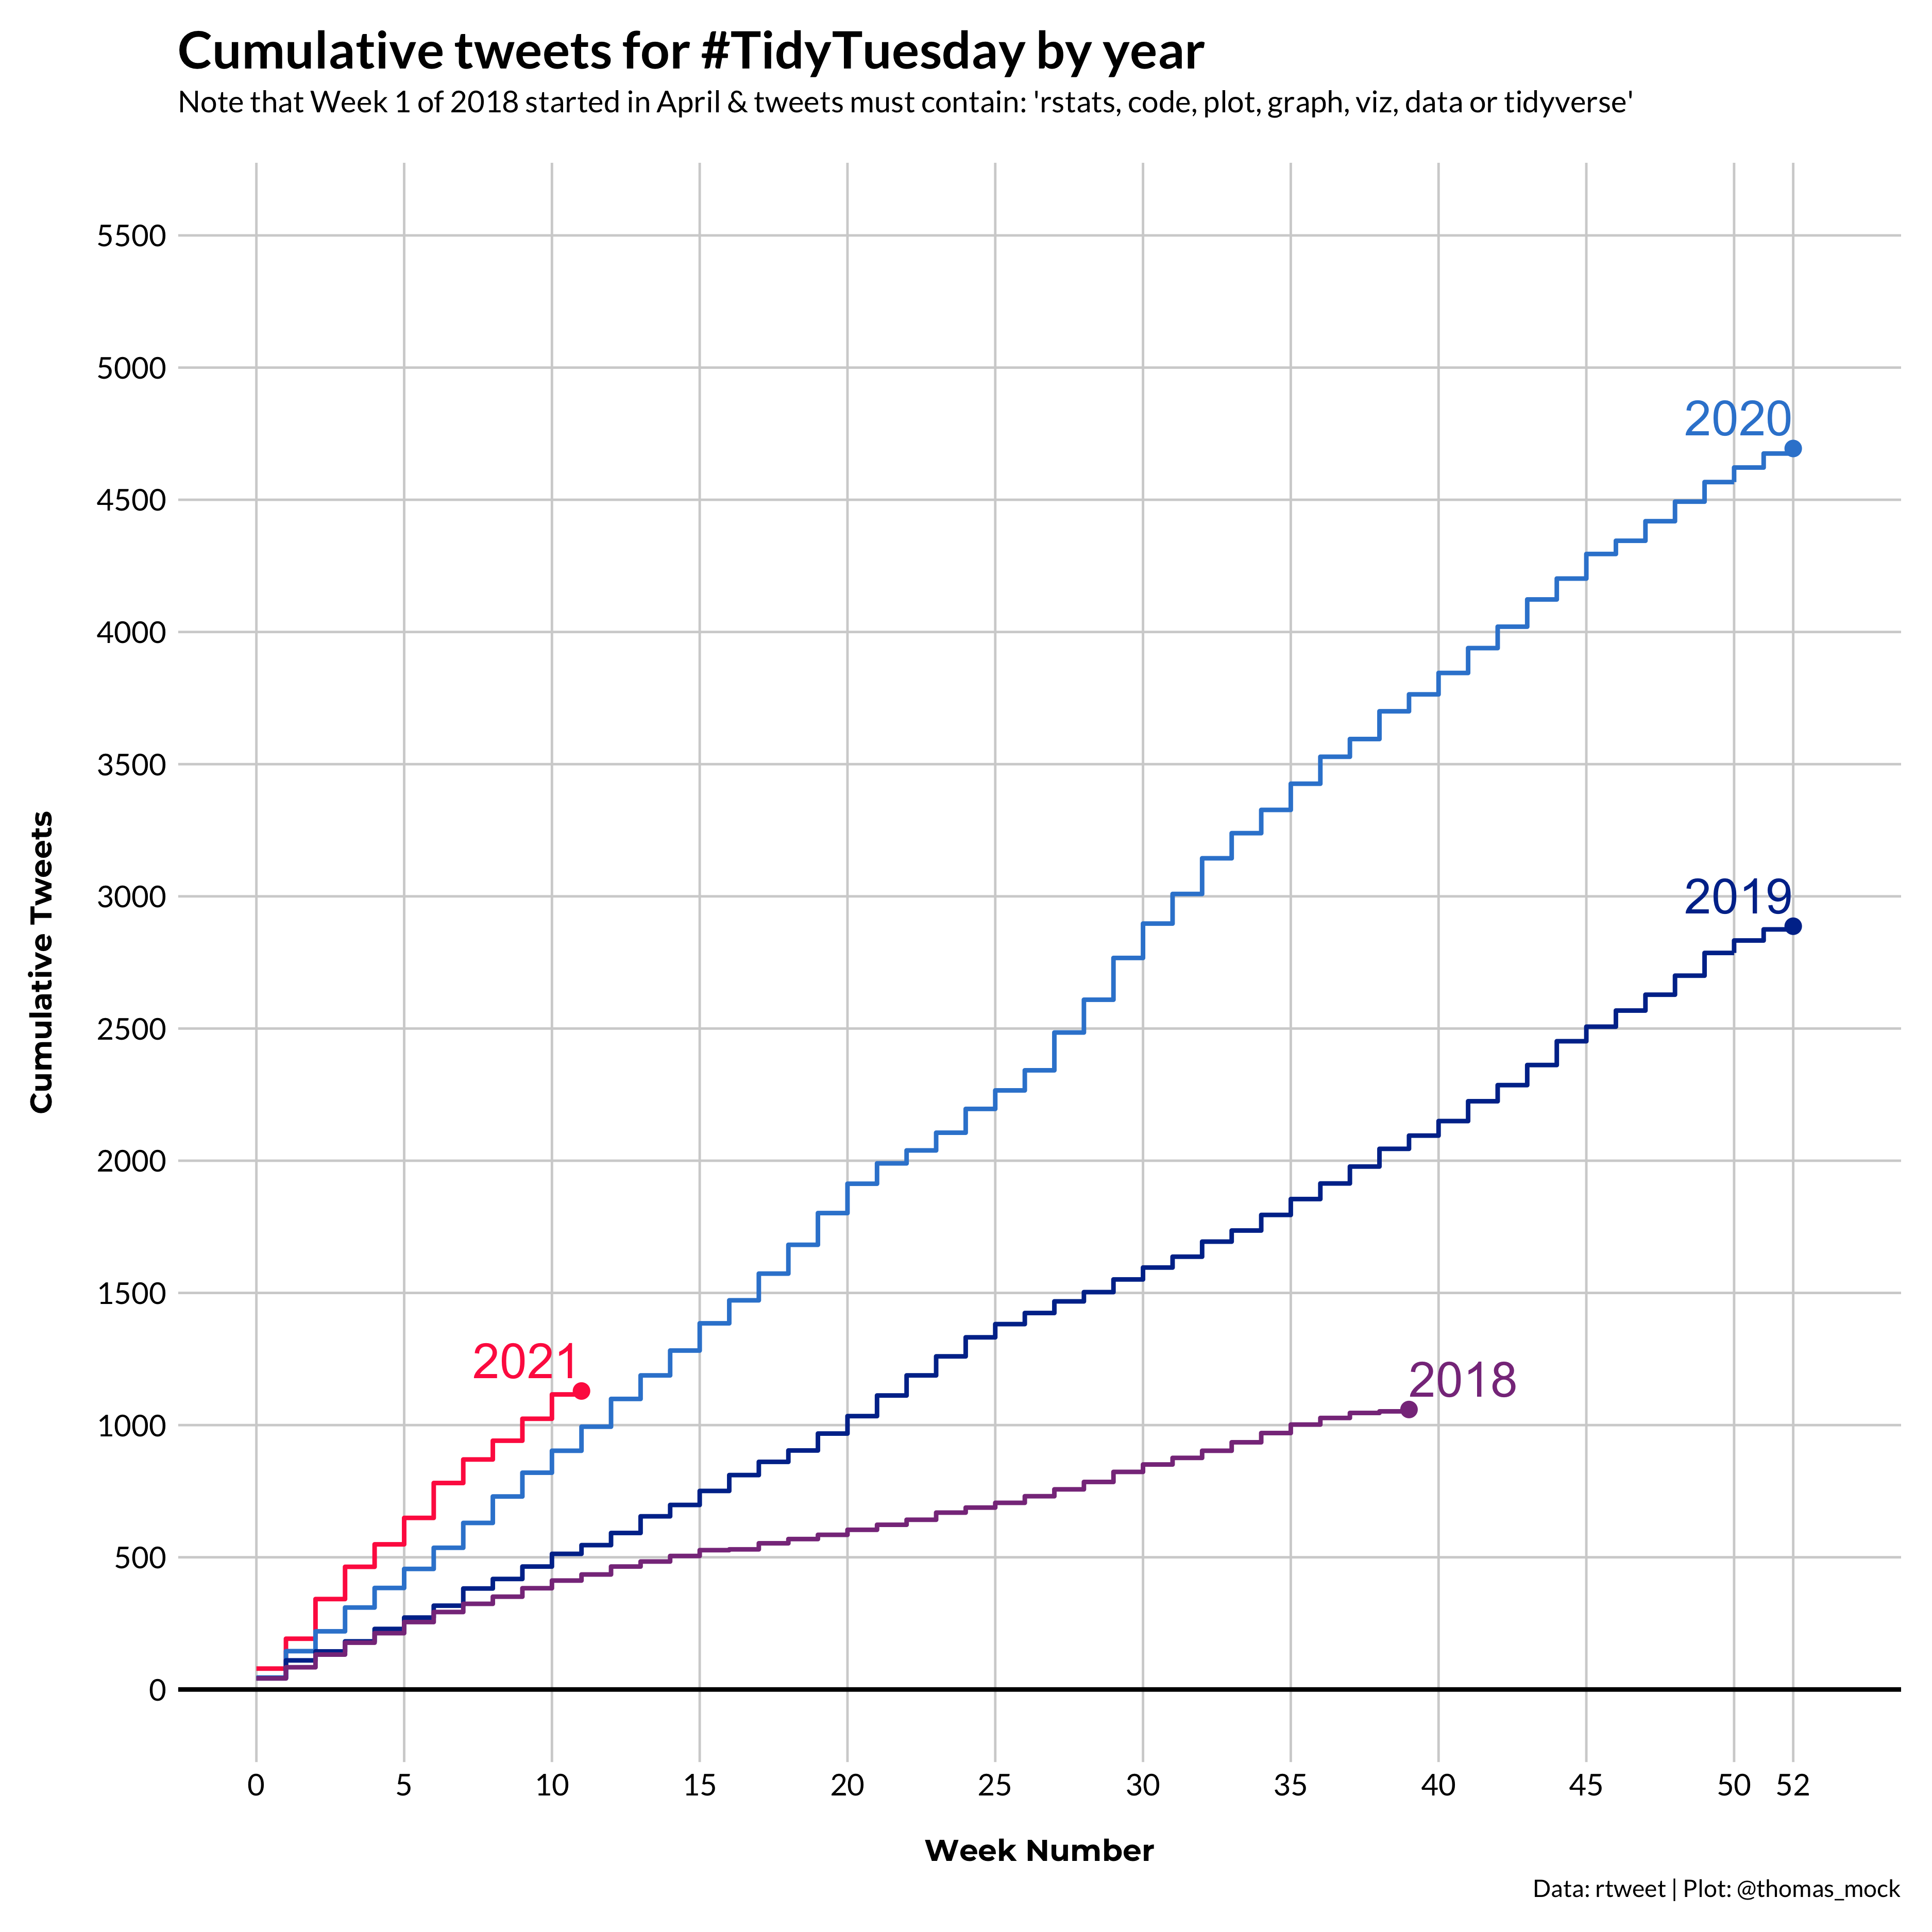
Making #TidyTuesday better.

2019-01-02
10 min

Image

TidyTuesday

A weekly social data project in R

2018-04-05
10 min

Image

Functional Progamming in R with purrr

Minimizing repetition with further replication

2018-03-18
8 min

Image

A Gentle Guide to Tidy Statistics in R

Working your way through a basic analysis

2018-03-16
24 min
No matching items
    Advertisement