Komodor changelog
Komodor changelog
komodor.io

Klaudia “Ask Me Anything” on Cluster & New Chat Experience


New


Klaudia AI


Improvement


Beta-feature


We’re introducing two major upgrades to enhance your Klaudia experience:

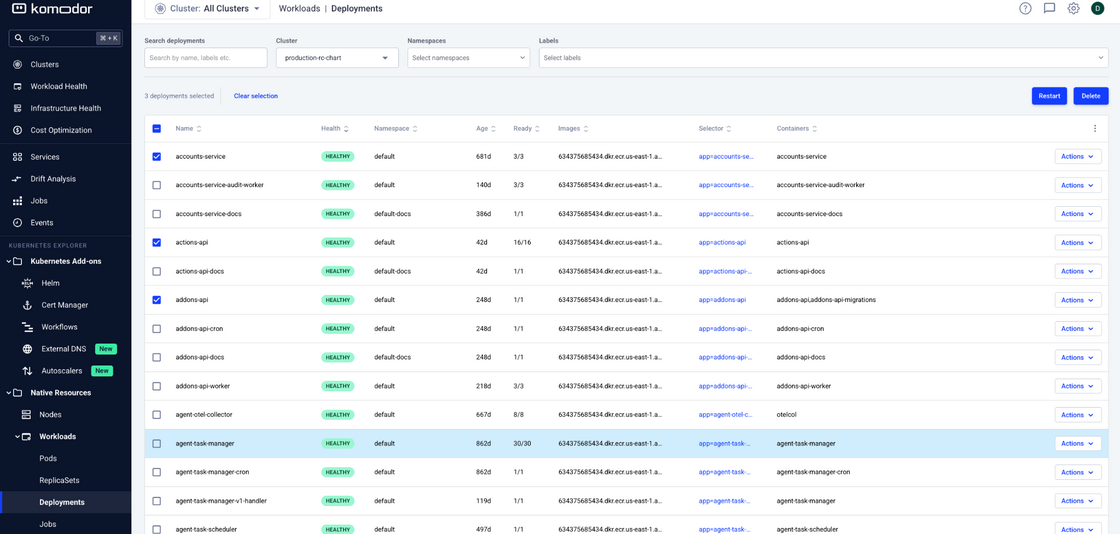
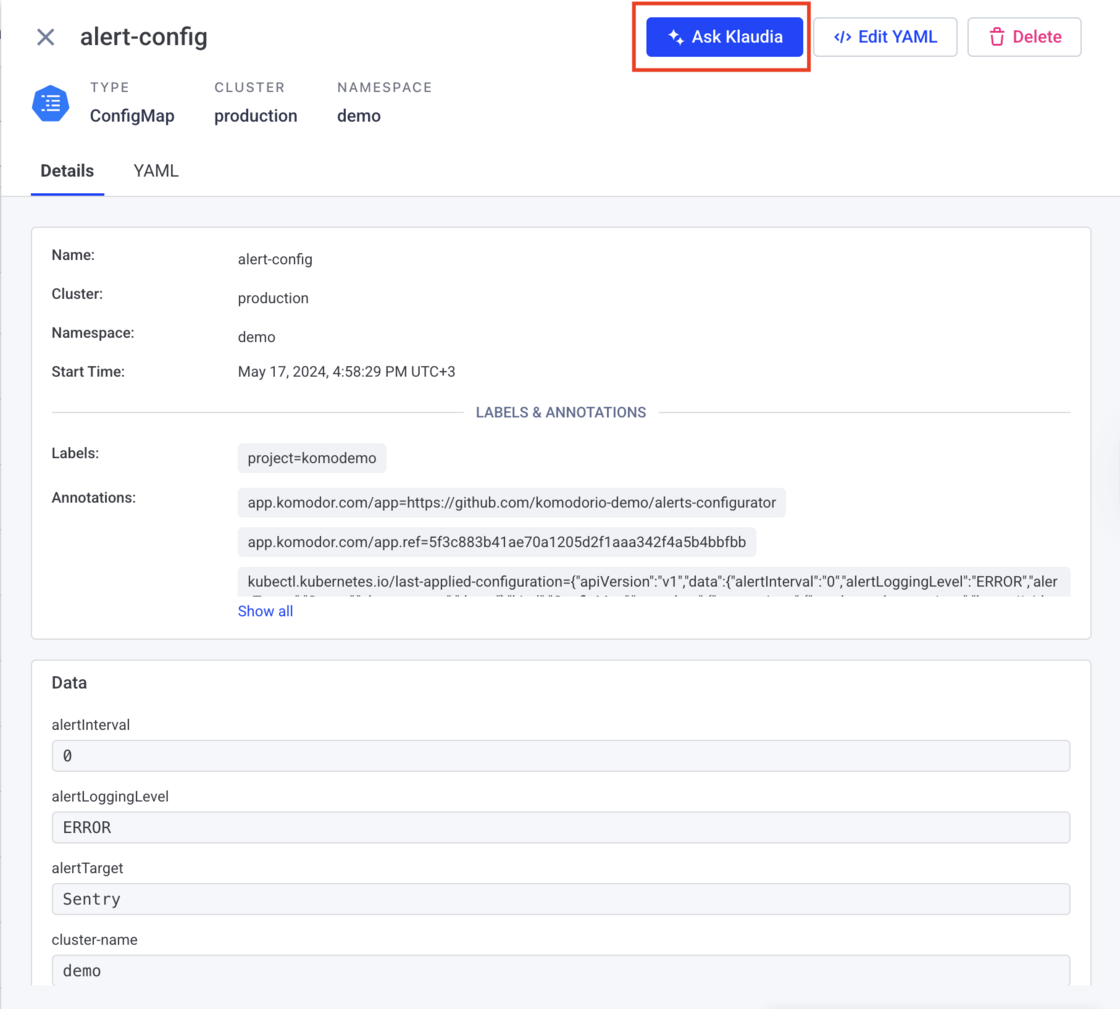
1. Klaudia “Ask Me Anything” on Cluster (CMD + I)

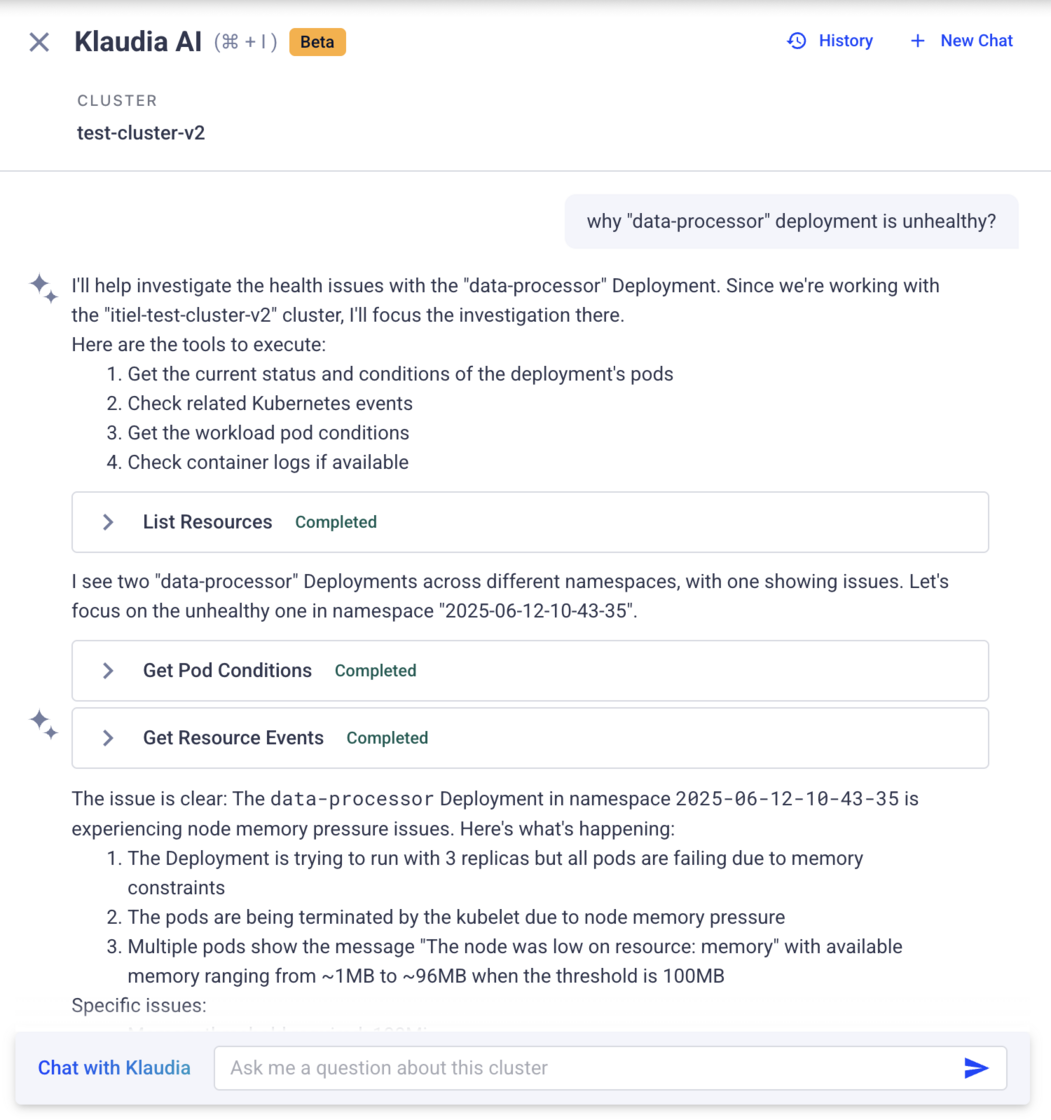
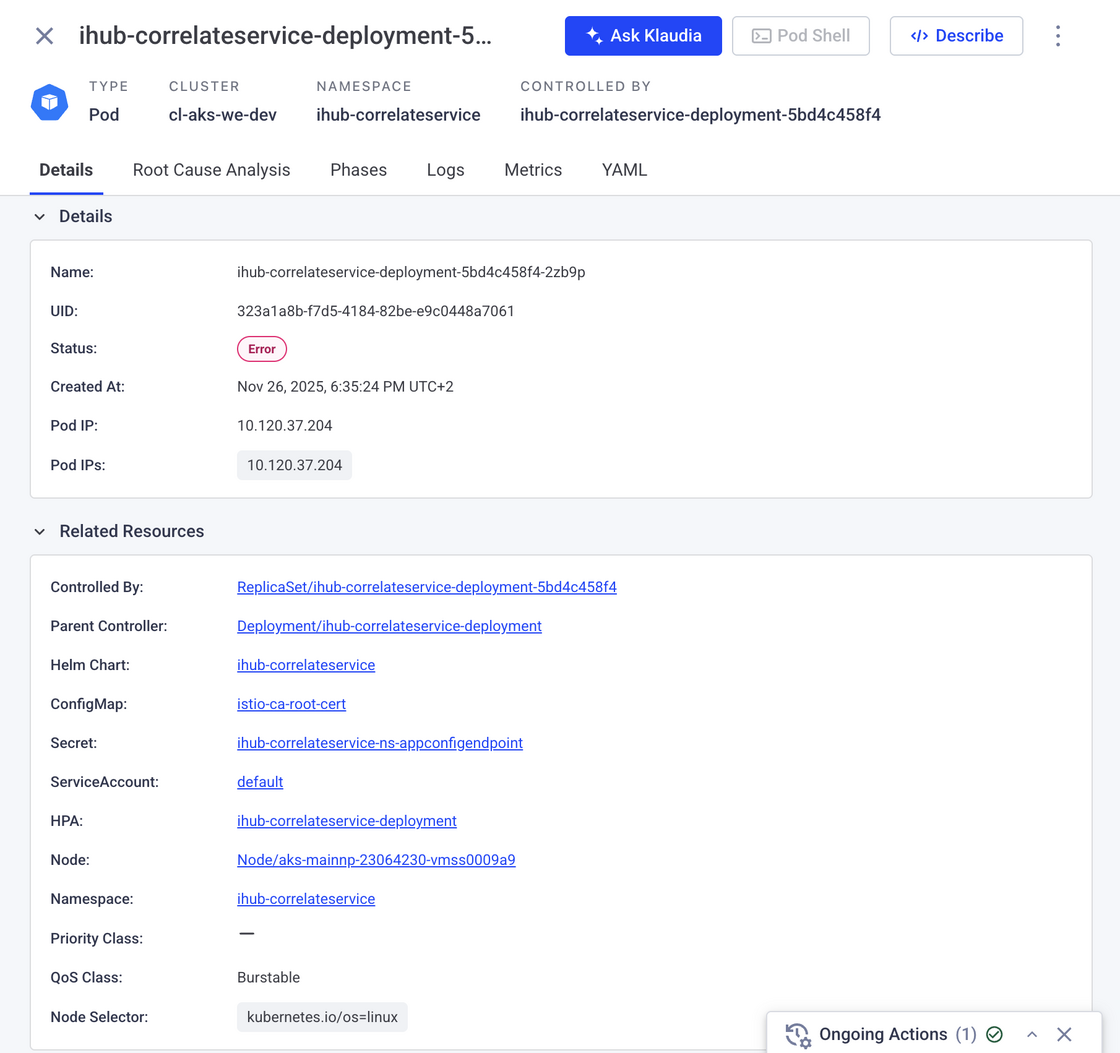
You can now open Klaudia from any screen in Komodor and ask her any question you want. Just select the cluster you want her to focus on - once selected, Klaudia will analyze the relevant data and return clear, structured answers.

Klaudia AI navbar.png

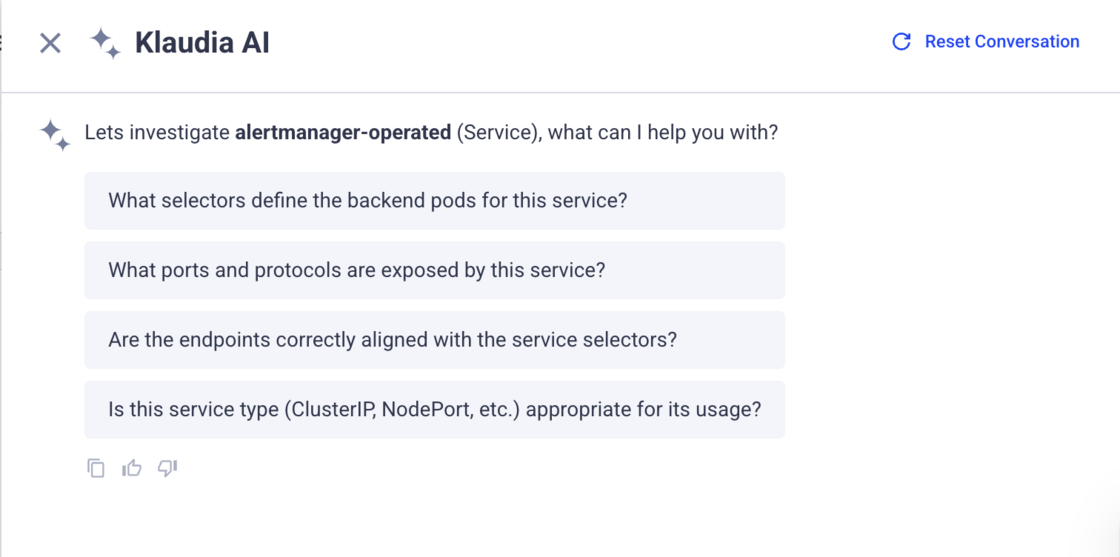
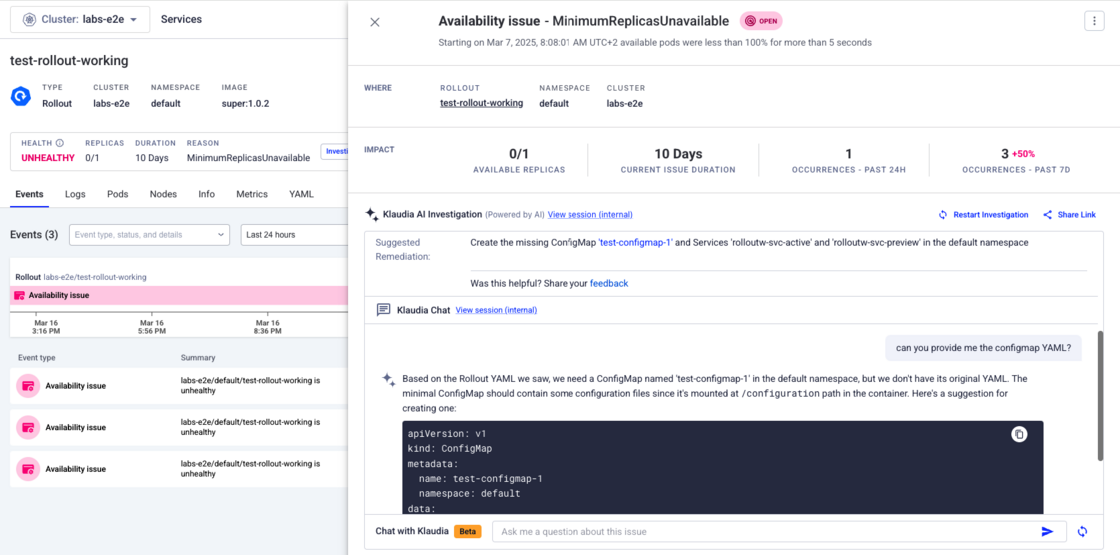
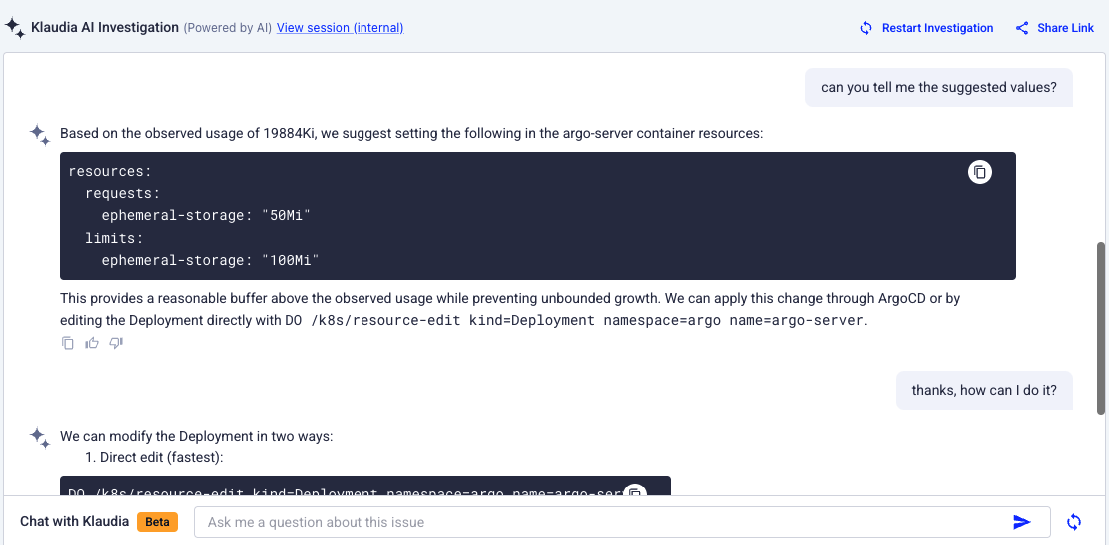
2. The New Klaudia Chat Experience

A brand-new chat brings faster performance, streaming responses, and better visibility into how Klaudia collects data behind the scenes.

new chat v2.png

⭐️ What You'll Get

Ask Me Anything on Cluster

  • Ask free-form questions focused on a chosen cluster
  • Fast navigation from the top navbar
  • See your favorites cluster first
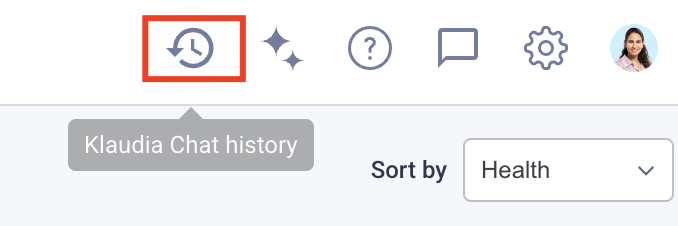
  • Get back easily to previous chats using our Klaudia history feature (top navbar)

New Chat Experience

  • Streaming answers for a smoother experience
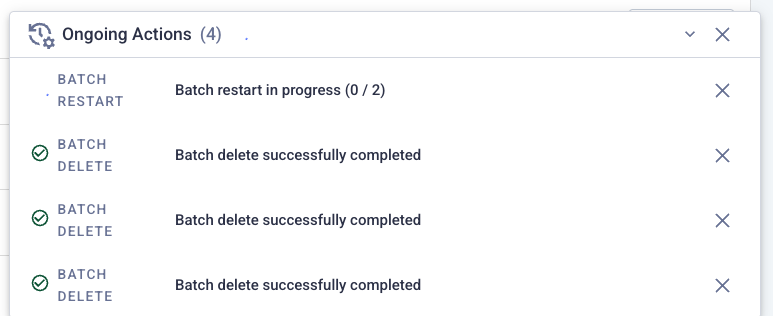
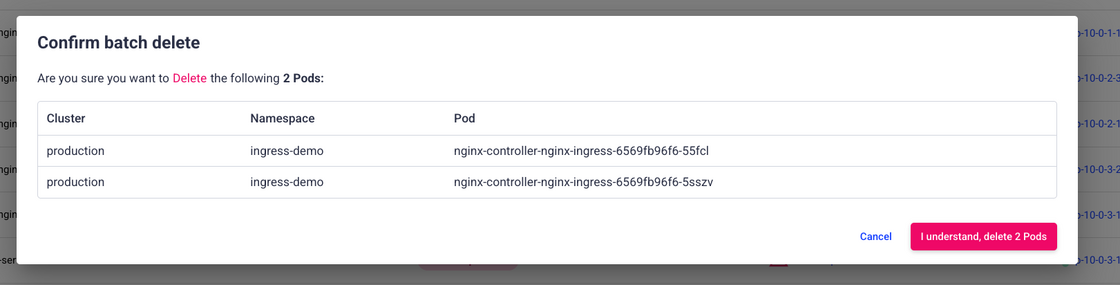
  • Tool-based actions visible to the user (e.g., fetching pods, deployments, logs)
  • Improved formatting: richer tables, YAML, bullets, and easier-to-read output

📍 Where to Find It

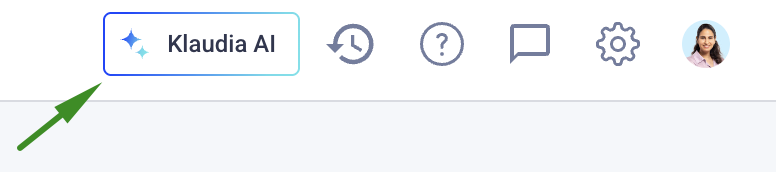
Look for the new “Klaudia AI” button in the top navigation bar 🤖 Or quickly access via CMD + I

📅 Availability

Both features are currently in Beta and are rolling out gradually to selected accounts.

🔒 Want Access?

If you’d like these features enabled for your team, please contact your Komodor account admin.

Instant Visibility Into Related Kubernetes Resources


Improvement


Operations


New


We’ve added a new Related Resources section to supported Kubernetes resource pages, giving you instant visibility into the objects connected to the resource you’re investigating.

This section surfaces relationships such as controllers, nodes, ConfigMaps, Secrets, HPAs, Services, and more — all in one place — with direct links to each related resource.

Why this matters?

  • Understand resource dependencies at a glance
  • Navigate between related Kubernetes objects faster
  • Reduce time spent switching views during investigations
  • Gain better operational context while troubleshooting

Where is it?

For the supported resource types mentioned above, you can now see links to any other resources they're related to in the enriched section of Related resources in the Details (or info) tab. Clicking on the link to the different related resources will open the relevant resource drawer.

image.png

Klaudia History – All Your Sessions, in One Place


New


Klaudia AI


🕓 Overview

You can now access a complete activity log of your Klaudia interactions, including Root Cause Analyses, Ask Klaudia chats, and Log Analysis sessions - all in one searchable view.

klaudia history.png

⭐️ Why This Matters

  • Improve continuity between investigations
  • Easily search and filter through previous sessions
  • Revisit old conversations and ask follow-up questions

📍 Where to Find It

  • Top navigation bar → Look for the new Klaudia History icon
  • Any Klaudia drawer → Tap the top-right "History" button

📅 Availability

  • View sessions from the last 30 days.
  • 🔒 Note: Session history is private - each user can only see their own sessions.

Argo CD Integration


New


Add-Ons


Troubleshooting


We’re excited to roll out native support for Argo CD in Komodor!

👁️ Overview

The Argo CD add-on in Komodor connects your Argo CD server(s) and surfaces application status, sync/health right alongside your Kubernetes data—all in one place. While the Argo CD UI is great for GitOps workflows, investigating issues through it can be hard and it often lacks critical Kubernetes context across clusters and namespaces. Komodor bridges that gap so teams can move smoothly from deploy → operate → troubleshoot, reach root cause analysis faster, and run one-click Sync or Rollback actions directly from Komodor.

✅ What’s Included

  • Argo CD Add-On Page – View all your Argo CD applications across clusters in a single, centralized dashboard.
  • Argo CD App Drawer – Get essential app data like sync status, recent commits, target cluster, and last sync time.
  • Service-Level Context – See which Argo CD app manages a service directly from the Komodor service drawer.
  • Argo CD Actions – Trigger app sync or perform a rollback directly from Komodor—ideal for faster troubleshooting and day-to-day operational workflows.

🧠 Klaudia Support

  • Ask Klaudia about any Argo CD app—get deployment context, errors, and sync insights instantly.
  • Root Cause Analysis (RCA) for degraded or out-of-sync apps, powered by historical snapshots.
  • Enhanced investigations for Availability Issues with Argo CD context built-in.

📌 To unlock the full value, you’ll need to configure a one-time mapping for destination clusters in your Argo CD integration.

🗣️ Why This Matters

While Argo CD’s UI is great for deployment visibility, diagnosing why something is out of sync or failing often requires diving into multiple tools and clusters.

Komodor simplifies this with:

  • End-to-end visibility across apps and services
  • Actionable context tied to real-time investigations
  • Integrated AI support to cut investigation time

⚙️ Getting Started

Komodor automatically detects your Argo CD apps - no setup needed for basic visibility. To unlock the full end-to-end experience, you'll need to configure a few mapping fields in the Argo CD integration (Only if you have management cluster).

This is important because Argo CD often runs in a “management” cluster, while deploying workloads to separate destination clusters. Komodor needs to know which app belongs to which cluster in order to provide accurate context and full functionality.

📚 Read the full setup guide in our documentation

📚 Klaudia Just Got Wiser – Now Learns from Your Docs


New


Improvement


Klaudia AI


Troubleshooting


👁️ Overview

You can now supercharge Klaudia’s troubleshooting powers by uploading your own documentation files into Komodor. With this enhancement, Klaudia can reference your internal runbooks, guidelines, and architecture docs—making her smarter, more relevant, and more aligned with your operations.

Whether you’re investigating a failed deployment or chatting through a complex RCA, Klaudia will use your uploaded docs to provide contextual answers rooted in your own best practices.

⭐️ Why This Matters

Troubleshooting often relies on tribal knowledge and org-specific practices. Now, you can put that knowledge to work automatically:

  • Get answers tailored to your terminology and setups
  • Leverage your own playbooks during real-time or historical issues root cause analysis
  • Increase consistency across team responses

🗂️ What You Can Upload

  • PDF runbooks
  • Markdown architecture guides
  • Internal troubleshooting checklists
  • Post mortems
  • Any static doc that helps your team resolve issues

💬 How It Works

  • Head to Account Settings → Klaudia AI → Klaudia Knowledge Base
  • Upload relevant documentation
  • Klaudia will start surfacing helpful insights from those docs during RCA and chat

🚀 Coming Soon

We're exploring broader integrations like Confluence integration and Slack channels knowledge ingestion.

📣 Interested in this feature?

Talk to your Komodor admin to share your interest—we're actively tracking demand, and your feedback will help shape what comes next!

📚 Want to learn more? Check out the full documentation → Klaudia Knowledge Base Integration 🎯

Argo Rollouts are Now Natively Supported


New


KubeX


Health Management


Operations


👁 Overview

We now officially support Argo Rollouts as a 1st class citizen in the platform!

Komodor now detects and displays Argo Rollout workloads in the Resource Inspection area, as well as through the Services page.

image.png `

🎁 What's new

  • You’ll see Argo Rollout states fully visualized, with the ability to track rollout progress and troubleshoot directly from the service drawer.
  • You can find Argo Rollouts under Workloads.
  • Get easier visibility into it (instead of searching for it in the CRDs), as well as the ability to run actions such as restart, scale and delete (with a separate RBAC action for each one)
  • Argo Rollouts are now searchable via CMD+K

Batch Actions are Here!


New


Improvement


Operations


KubeX


👁 Overview

You can now bulk delete or restart Deployments, and bulk delete Pods, directly from the UI.

This long-awaited capability is especially useful for teams operating at scale.

image.png

🔧 What’s new:

You can now:

  • Bulk restart or delete deployments, or delete multiple pods. You can take action on up to 50 resources at a time

  • For each bulk action, a tracker will be added to the "Ongoing Actions" tray on the bottom right page

image.png

  • Full audit trail, where every action is logged per-resource. You also get a clear status of your actions results.

  • When selecting items, live updates are paused to avoid unexpected refreshes

image.png

💡 Notes:

  • Pagination selection does not persist across pages (same as Gmail)

  • Failed or partially successful actions are fully trackable with error details

Got feedback or ideas for other batch actions? Let us know!

Klaudia Just Got Smarter – Now Available on Any Resource


New


Improvement


Klaudia AI


👁️ Overview

You can now chat with Klaudia, your AI-powered virtual SRE, from any Kubernetes resource—not just those tied to an incident or RCA. Start a conversation directly from any resource drawer—including Pods, Secrets, CRDs, and Nodes—no matter their health status. This enhancement turns Klaudia into a proactive companion, helping you understand and explore your environment, not just troubleshoot problems.

Klaudia for any resource.png

⭐️ Why This Matters

Troubleshooting isn’t just for what’s broken—it’s about gaining clarity across your system. With this update, you can Investigate healthy resources or validate setup and configurations quickly. Klaudia gives you contextual answers based on the resource you’re exploring, so you get precise, relevant insights—fast.

💬 What You Can Ask Klaudia

  • “What does this deployment do?”
  • “Which services are connected to this node?”
  • “Is this configuration aligned with best practices?”

You’ll also see suggested questions tailored to each resource—so you can dive in with one click.

🚀 How to Get Started

Just open any resource drawer and click the “Ask Klaudia” button.

ask klaudia.png

From there, you can:

  • Chat with Klaudia about the specific resource
  • Use free-text queries to dig deeper
  • Try suggested prompts to guide your questions
  • Share the conversation with teammates using the “Share link” button

📚 Want to learn more? Check out the full documentation → KlaudiaAI: Your Virtual SRE 🎯

Klaudia RCA Now Available via Komodor API


New


Klaudia AI


Troubleshooting


We’re expanding Komodor’s API capabilities with support for AI-powered Root Cause Analysis (RCA) via Klaudia, enabling teams to trigger and retrieve investigation results programmatically—integrated directly into your existing workflows. Swagger documentation

👁️ Overview

Klaudia’s RCA API allows you to initiate root cause investigations for any Kubernetes workload (e.g., Pod, Deployment, Job) and fetch the results once complete. This unlocks seamless integration with:

  • CI/CD pipelines (Jenkins, GitLab, CircleCI)
  • Monitoring & alerting systems (PagerDuty, OpsGenie)
  • ChatOps tools (Slack, Teams, custom bots)
  • Internal dashboards and ticketing systems

RCA screenshot.png

🛠️ New Endpoints

  • Trigger RCA Investigation

POST /api/v1/klaudia/rca

Start a new investigation for a specific Kubernetes workload.

  • Get RCA Results

GET /api/v1/klaudia/rca/{session_id}

Retrieve the root cause, confidence score, supporting evidence, and recommended actions.

⏱️ API Usage Pattern

Since investigations typically take 20-30 seconds to complete, we recommend implementing a polling pattern:

  1. Start an investigation using POST /api/v1/klaudia/rca
  2. Receive a session_idin the response
  3. Poll the results endpoint GET /api/v1/klaudia/rca/{session_id}until the investigation is complete
  4. Process the returned root cause analysis and recommendations

This asynchronous pattern ensures your integrations remain responsive while Klaudia thoroughly analyzes the issue.

🌟 Here is an example script you can use in your CI/CD

🧩 Built on Komodor’s AI-Driven Investigation Engine

Komodor’s RCA engine is powered by AI models backed by dozens of prebuilt, out-of-the-box playbooks. These cover a wide range of Kubernetes failure scenarios from day one—no complex setup required. When triggered via the API, Klaudia automatically:

  • Runs intelligent workflows based on context
  • Surfaces the most likely root cause
  • Provides actionable next steps based on known patterns and platform behavior

This enables developers and SREs to quickly resolve issues, even without deep platform knowledge.

💡 Why It Matters

  • Reduce context switching—run RCAs from the tools you already use
  • Automate investigations after failed deploys or alerts
  • Share explainable, AI-powered insights across teams
  • Accelerate resolution by integrating Komodor deeper into your stack

🚀 Getting Started

Explore the new endpoints in our public Swagger documentation. The RCA API uses the same Komodor authentication and permission model you’re already familiar with.

Klaudia Chat For Root Cause Analysis


New


Klaudia AI


Troubleshooting


👁️ Overview

Introducing KlaudiaChat, the newest feature of Klaudia, our AI-powered virtual SRE agent. KlaudiaChat delivers a dynamic, interactive experience, making it easier to follow up on root cause analysis, interpret Klaudia’s outputs. Built on Klaudia’s industry-leading troubleshooting capabilities, this enhancement provides a faster, more comprehensive solution for Kubernetes troubleshooting.

klaudia chat RCA changelog.png

⭐️ Motivation

Troubleshooting efforts require more than the initial RCA information. For example, after receiving the initial root cause analysis from Klaudia, it's important to understand:

  • Clarifications on RCA results (e.g., "What does this finding mean?").
  • Insights into resolution steps and prevention methods.
  • Contextual connections and impact analysis of the issue.
  • A way to investigate related resources, or changes easily.

With KlaudiaChat, we’ve redefined how problems are addressed. This feature provides you:

  • Reduced Mean Time to Resolution (MTTR): Faster insights lead to quicker resolutions.
  • Interactive Problem Exploration: A back-and-forth conversation simplifies troubleshooting.
  • Deeper Insights: Leverage Klaudia’s expansive knowledge base for comprehensive answers.
  • Adaptable Investigation Paths: Branch into related issues that the initial RCA doesn’t immediately cover.

By integrating these capabilities, Klaudia offers a more powerful, impactful troubleshooting experience, helping users work smarter instead of harder.

chat for changelog.png

🚀 Getting Started

You can start using the Klaudia Chat feature effortlessly by interacting with the chat box on any Klaudia RCA found in Availability Issues, Failed Deploys, Failed Pods, and more.

Ask follow up questions by using free-text queries to explore additional dimensions of the issue, including:

  • Clarifications (e.g., “Why do you think this happened?”).
  • Resolution Steps (e.g., “How do I fix this?”).
  • Historical Analysis (e.g., “Has this issue occurred before?”).
  • Impact Assessment (e.g., “How does this affect users or environments?”)

Want to share the entire conversation with a teammate? Click the “Share link” button next to the RCA results.

For more details, check out our documentation