- Data Visualization
Data visualization: How-tos, templates, and tips


Jump to:
What is data visualization?
No matter the industry you’re in, dealing with data is an important part of making informed decisions. However, considering the sheer volume of available information, it’s a challenge to comprehend it without feeling overwhelmed. This is where data visualization comes in.
Data visualization is a way to represent information through charts, diagrams, plots, infographics, maps, and other graphical forms. Often shortened as “data viz,” it translates heavy data sets or dense text into visual formats to help you analyze information efficiently. In practice, examples of data visualization look like:
- A bar chart that compares a brand’s most and least popular products by number of sales
- A heat map that shows the number of active COVID-19 cases by region
- A line chart on Google Trends(opens in a new tab or window) that track the popularity of a particular search term across 24 hours
By condensing complicated information into a simple visual, data visualization enables people to easily digest large data sets, gain insight into trends and patterns, and make data-driven strategies.
Uses of data visualization
In general, people use data visualization to turn complex data into digestible graphics, often to support data interpretation, decision-making, and visual communication.
Data interpretation
It can be difficult to work with data in its raw form. Meanings can be lost or misinterpreted due to the complexity of how it’s presented. But by transforming numerical or statistical information into a line chart or a bar graph, you can quickly spot patterns, trends, and outliers within a data set. Doing so helps in gathering fresh insights to explore and suggest actionable steps.
Decision-making
When it comes to data — whether large in size or not — it’s handy to use visualization tools that present findings in a way that decision-makers can easily understand. For example, a heat map clearly demonstrates regional performance differences, or a histogram shows the distribution of customer ages. With key insights, your organization can make data-backed decisions more confidently.
Visual communication
According to a Harvard Business Review (HBR) article Visualizations That Really Work, visual communication is a must-have skill(opens in a new tab or window) today for design- and data-minded managers. Why? Because with countless data generated every day, visualizations make analysis easier for everyone, even those without a technical background. From treemaps comparing proportions within a whole to Gantt charts(opens in a new tab or window) illustrating project timelines, data visualization brings teams on the same page.

Data visualizations, like this Gantt chart, help teams interpret data, make informed decisions, and communicate effectively in visual-first world.
Applications of data visualization
Many industries use visual tools to make data more accessible. Here are a few examples:
- Marketing: A team analyzing six-month website traffic may use a line chart to track surges and dips, which inform future strategies.
- Healthcare: Choropleth maps — a thematic map with areas shaded based on a variable — can help teams study the variation in vaccination coverage across regions.
- Finance: Bank managers may use bar graphs to highlight unusual spending patterns and understand spending priorities of different departments.
- IT: When troubleshooting a slow login process, IT teams can use a sequence diagram to map the interactions between the user interface, authentication server, and database to resolve the bottleneck.
- Data science: A data science team can use scatterplots to visualize the relationship between two variables, leading to a more focused, data-driven analysis.
Types of data visualization
There are many different types of data visualizations, ranging from graphs to plots to tables and more. A common data viz categorization is by function; essentially, what kind of insight does this chart aim to communicate?
Let’s take a look at popular functions below. Keep in mind that most charts have multiple functions and can be used to analyze data in a variety of ways.
A data-over-time graph, also called change-over-time, represents how data changes over a period of time. This identifies patterns and outliers and helps you with forecasting and monitoring.
Examples:
Use cases:
- Website traffic month-over-month
- Product sales reports
- Daily app usage activity patterns

A sample line chart that shows how data changes over time.
Comparison charts allow you to see the differences and similarities between two or more data sets, concepts, or values. This type of data visualization is especially useful in highlighting advantages and disadvantages.
Examples:
Use cases:
- Inclusions of different marketing service offerings
- Pros and cons of a specific skincare product
- Top music trends for the year by number of listens

A sample bar chart comparing the number of followers of different social media accounts.
Relationship or correlation diagrams visualize the connections between data, helping you understand how each data point is related (or not). This makes it easier to spot trends and identify how one variable affects the other. However, it’s important to remember that correlation is not causation; while you’re comparing specific values, another variable may be influencing the trend.
Examples:
- Geospatial maps (e.g., heat map, choropleth map)
Use cases:
- Weight vs. height
- Average rainfall vs. crop yield
- Advertising budget vs. sales

This scatterplot is used to communicate financial information.
Proportional or composition visualizations compare the size of two values or represent parts of a whole. This is best used when breaking down how different components contribute to a total.
Examples:
- Stacked bar chart
- Stacked area chart
- Word cloud
Use cases:
- Percentage of customers divided by age group
- Website traffic by source (e.g. social media, direct, paid ads)
- Revenue generated by salesperson

A sample donut chart that shows the different devices that people use.
The main point of hierarchy or ranked charts is to show how values are ordered in a category or system, typically from most to least or highest to lowest. Use this type of data visualization when you want to represent how different categories stack against each other based on a criteria, such as performance.
Examples:
- Ordered bar chart
Use cases:
- Top vacation destinations by number of tourists
- Most commonly searched keywords in the niche
- Results of a company poll or vote

A sample stacked row chart showing top vacation destinations in order.
Distribution charts are also called frequency charts because they represent how data is spread. These charts show a “shape” at a glance, making it one of the best and easiest forms to analyze patterns, outliers, and variability across values.
Examples:
- Histogram
- Scatterplot
- Pictogram
Use cases:
- Test scores in a given class
- Talk time per customer service call
- Sales total per order

A sample diagram that shows sales targets.
What are the benefits of data visualization?
Data visualization is a big part of today’s business communications. According to Canva’s Visual Communications Report(opens in a new tab or window), visual communication — the use of images, graphics, and other visual elements to convey information, ideas, and messages in a way that's engaging and easy to understand — is driving productivity and business communications. In fact, 91% of leaders say that visual communication makes them more efficient.
With data visualization, you can:
- Cut back on time sifting through large sets of numbers
- Share data-backed insights with no room for uncertainty or confusion
- Elevate data storytelling and increase audience engagement
- Ensure your message resonates strongly with stakeholders and decision-makers
- Provide opportunities to explore, collaborate on, and facilitate evidence-based decisions
What are the limits of data visualization?
While data visualization is an incredibly useful tool in understanding complex information, it can also be prone to misrepresentation, whether accidentally or intentionally. The most common pitfalls of data viz are:
- Using inaccurate, incomplete, or low-quality data sources
- Choosing the wrong data visualization technique
- Creating graphs with unnecessary information or elements, poor color choices, and inconsistent scaling
The consequences of erroneous data viz are no small thing. When your visualization is flawed, so are the conclusions the readers make. This renders your visualization not only irrelevant but also potentially harmful, especially if you use them to make crucial business decisions or convey a critical public message.
How to choose the right data visualization
All data visualization has a purpose: communicate a clear insight. The wrong chart choice can not only confuse your message but also lead to costly decisions, wasted time, and damaged credibility with your audience, whether that’s customers, staff, or stakeholders.
With dozens of charts with similar forms and functions, ask yourself the following questions to choose the right visualization technique for your data:

Choose from a wide range of charts and graphs on Canva.
Data isn’t just all numbers. Your data set can fall into four different categories:
- Quantitative: What we usually think of when we say “data,” this includes numerical values like sales or inventory.
- Categorical: This includes non-numerical data, such as demographics (like gender or education level), product categories (like fashion, technology, or pet supplies), and more.
- Temporal: Temporal data is time-based. Examples are leads discovered per day or annual growth reports.
- Spatial: Spatial data is location-based, such as weather forecasts and election results by city.
Depending on the information you have, some types of data visualizations may be better than others. For example, temporal data can be expressed with change-over-time diagrams like line graphs.
The size of your data set is also essential in determining the right visualization, as certain types work best with a small set. A table with dozens of rows would be difficult to read at a glance, but a pie chart with a similar number of slices would be much easier to parse.
If communication is your goal, you need to know (and understand) who you’re talking to. Simpler charts like bar or column charts are appropriate for general audiences that aren’t as familiar with your material. On the other hand, data-savvy viewers can handle — and may even appreciate — higher-level visualizations like scatterplots.
Perhaps the most important question to consider: think about the story you want to tell. Most fall under one of four purposes:
- Comparison: Compare or contrast data based on a metric, like performance or time.
- Composition: Show parts that make up a whole.
- Distribution: Represent a trend, pattern, or outlier.
- Relationship: Discover how variables are related to each other.
For example, if you want to show the success of a product line based on sales, a ranked table or bar chart can quickly communicate that idea. But if you want to tell a slightly different or more complex story — say, how many of those sales are from first-time or repeat buyers — you could use a stacked or grouped bar chart instead.
How to create data visualization
Visualizing data has never been easier, thanks to the growing number of available tools at your fingertips. Canva offers an intuitive editor, a library of editable chart templates, and powerful AI tools to speed up the work. With your team, you can break down complex data sets into compelling visuals by following this step-by-step process.


Before anything else, think of your visualization’s nature and purpose. If you convert a spreadsheet into a chart without a purpose in mind, your chart won’t tell a full story. To accomplish that, the HBR article said you must begin by asking yourself these two questions(opens in a new tab or window):
- Is the information conceptual or data-driven?
- Are you declaring something or exploring something?
The first question helps you get down to basics, simply asking whether you’ll be working with qualitative or quantitative information. Meanwhile, the second question probes into what you’ll be doing: presenting or studying data. By knowing your purpose, you can better determine what type of data visualization to use.
Skip the manual task of starting from scratch and start with a pre-made template specifically for data visualization. Canva has an extensive collection of data visualization templates to suit different needs, from comparison charts to decision trees(opens in a new tab or window) to fishbone diagrams(opens in a new tab or window). Want to ensure your visual is on brand? Just add chart styles to your Brand Kit (Pro)(opens in a new tab or window) to create personalized graphs that maintain brand consistency.
Starting with a template will save your organization countless hours. Case in point: Giant internet forum Reddit uses Canva to communicate visually(opens in a new tab or window) with ease. Within six months of rolling out Canva across the company, Reddit saved over 21,000 design hours, thanks to professionally made templates and powerful design tools.
With your template ready, it’s time to fill it out with data. On Canva Sheets, you can easily import your CSVs and Excel files to get started. Alternatively, use Data Connectors to connect your data to Google Analytics and Hubspot to refresh data or link on-brand reports.
As a rule of thumb, always present your data honestly. Avoid cherry picking to exclude information you don’t want. Your data visualization should be accurate and credible to be able to provide value to your audience.
Design is an integral part of data visualization. Designers tend to use colors, shapes, lines, and other elements to weave narrative into raw data, allowing for quicker and easier comprehension.
You’ll want your graphic to capture attention but not overwhelm the audience. It should also be able to tell a data story that’s readily understandable to everyone who may see it. Canva has a vast collection of design elements you can drag-and-drop to your visual, including icons, illustrations, shapes, and colors to help you build your narrative with just a few clicks.
That said, avoid cluttering your visual with too many design elements unless you want them to skew or obscure your data. Aim to strike a balance between form and function to keep the graphics effective.
Graphics alone are inadequate for data visualization, according to a Harvard Data Science Review article; rather, data graphics generally work best when complemented by text(opens in a new tab or window). So, make sure to provide context through labels, titles, annotations, and legends (if applicable).
Flourish outlines a four-item guide to using text in data visualization(opens in a new tab or window):
- Title: According to Flourish, the chart’s title is the elevator pitch. It serves as the first point of reference, so it must communicate the key takeaway of the data set.
- Labels: While a color legend works well in most data visualization charts, direct labels make the chart easier to understand.
- Horizontal labels: Flourish reminds people to turn people’s heads for the right reasons. So whenever possible, the text must be horizontal. Be wary especially if the chart has a Y-axis.
- Numbers: Consider the readability of numerical figures with multiple digits, and format your numbers accordingly.
Once finalized, share your data visualization with your audience to relay insights and facilitate actionable steps. You can also embed it in any Canva design.
If you’re preparing a Canva doc, add Scrollables(opens in a new tab or window), which introduces animations that play as you scroll, transforming your static document into an interactive experience. Scrollables enhance your engagement by making the content more dynamic and visually appealing.
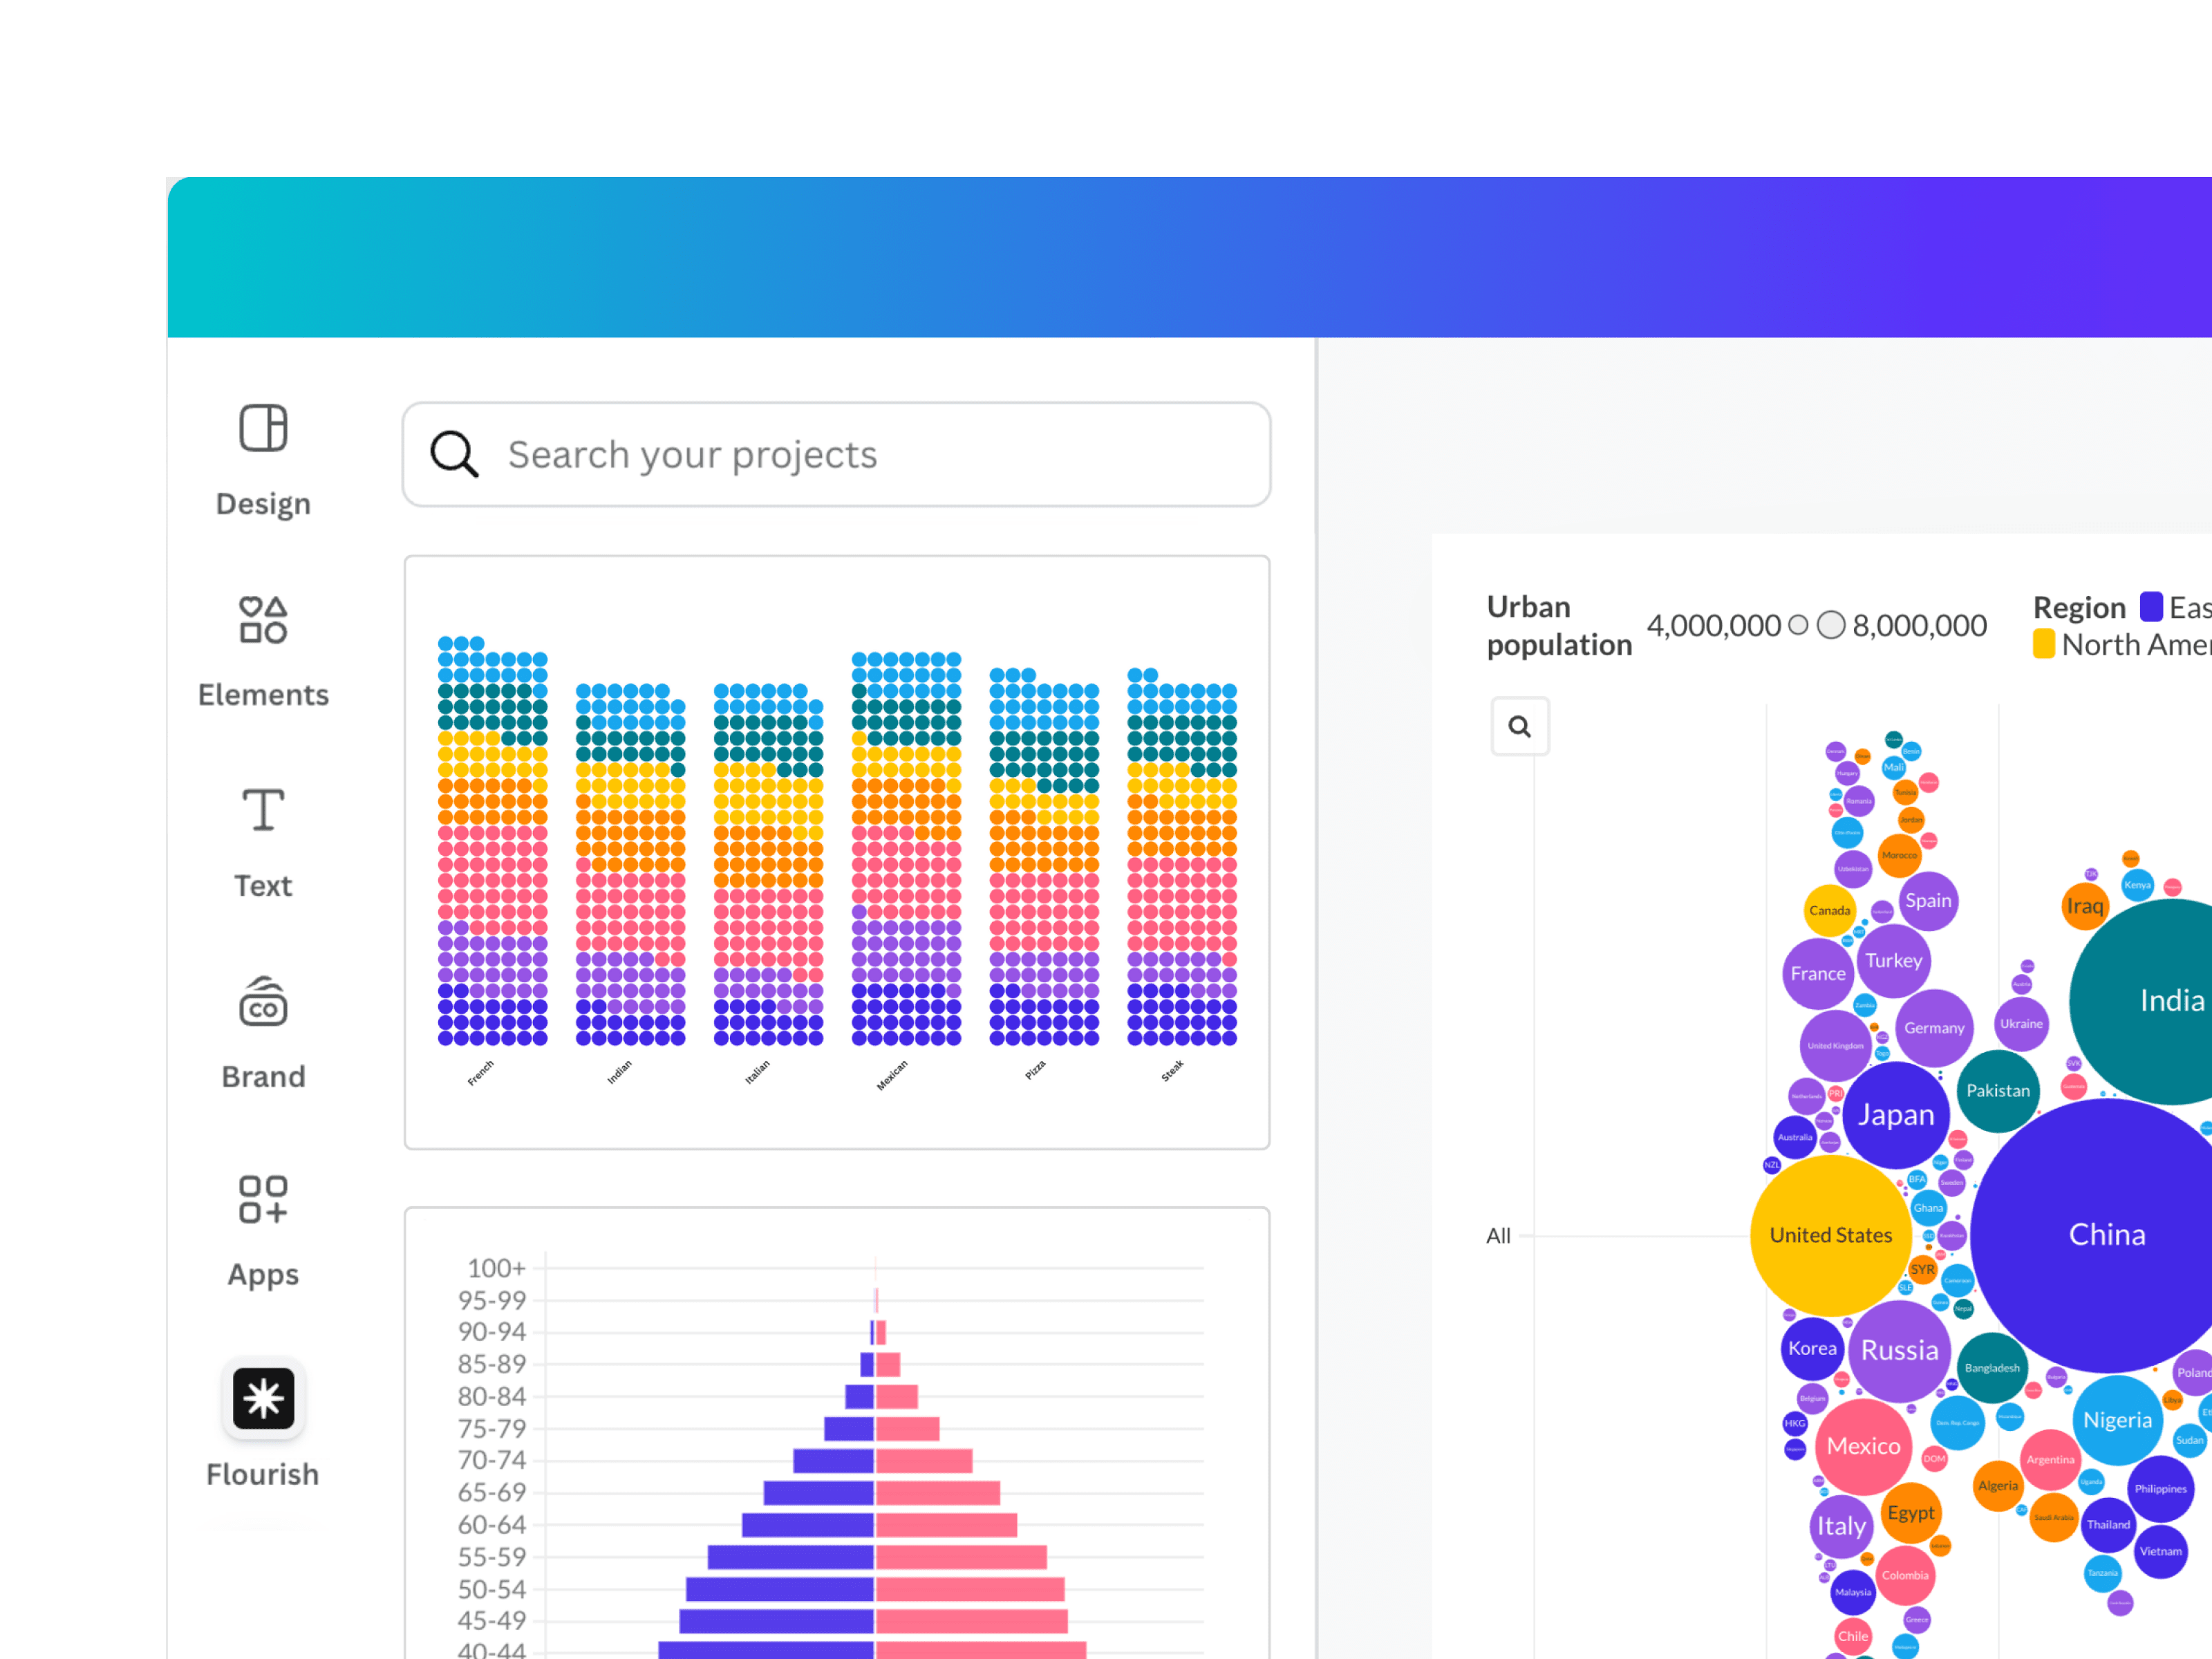
Get inspired with data visualization examples
Whether you’re looking for a pie chart to compare varying proportions or a treemap to present hierarchical data, browse our collection of interactive data visualization examples and choose the best one that suits your data. Easily fill out the template, switch out elements to make it on brand, and work with your team to create an effective chart or graph that gets the message across.


All you need in a data visualization software
Canva offers all the data visualization tools you need, from graph templates to AI-powered capabilities that supercharge your productivity. From simple data reports to animated charts, Canva empowers your team to create impactful, memorable data stories.

Rich, customizable chart library
Choose from a rich library of customizable, static and animated charts and graphs for all data viz projects.

Stay in sync across all your data sources
With Data Connectors, you can easily link on-brand reports to the data that matters most to your business.

Let data do the talking with Scrollables
Deliver data through a scrollable, interactive experience that captures attention and drives understanding.

Find the right visualization every time
Let Magic Charts choose the best chart from our library. Turn data in Canva Sheets into fully animated visualizations.

Find the story in your data
Magic Insights uncovers patterns, trends, and key takeaways, transforming data into clear, compelling summaries.

Tailor the visualization with interactive filters
Use filters to explore data dynamically and tailor the visualization to your needs, all in a few clicks.
Data visualization best practices
Great data visualization helps you effectively communicate your message and drive better decision-making. Follow these best practices to design accurate, visually appealing, and impactful visualizations.
Follow the principles of data visualization
No matter what kind of chart, graph, or diagram you’re trying to create, there are a few universal principles of good data viz design:
- Accurate: First and foremost, it’s essential that both your data and its visual representation are accurate and objective — not distorted to a particular bias.
- Helpful: Provide context to your chart that will aid your audience in understanding your data. Use elements (e.g., labels and colors) to draw attention to the most important data points and encourage viewers to explore further.
- Scalable: Adapt your design so that it’s viewable on different devices and caters to different user needs. Interactive charts are especially useful in representing complex data sets without overwhelming the viewer.
Know your audience
Audience, viewer, or reader information can help not only in choosing the type of data visualization to use but also designing the graphic. For example, simple visuals like bar graphs or line charts are likely more accessible for non-technical audiences.
When considering your audience, look out for the following factors:
- Subject familiarity
- Prior knowledge about your data
- Experience with data interpretation
Adjust your graphs, tables, or diagrams according to their expertise and ensure clarity and comprehension once you share your data-backed presentation.
Keep it simple
When it comes to data, more is not necessarily better. Only include information that sustains user attention. For example, you don’t need to label every data point or use a wide range of colors. One or two can effectively communicate your ideas without distracting your viewers.
That said, it’s also possible to oversimplify your charts to the point that they’re misleading. One question you can ask to guide your design is, “what insight does this data point to?” and go from there, adding elements that support your answer.
Ensure design accessibility
Good data visualization takes design accessibility in mind so graphics are easily understood by everyone, including people with sensory issues. To make sure your visualization is inclusive, follow the tips below as outlined by Harvard University’s Digital Accessibility Services (DAS)(opens in a new tab or window):
- Design: Simplicity is always key. Avoid animations that can be too disorienting, and if there are movements included in your data visualization, provide your audience the option to turn it off.
- Color: Be mindful of using very low- or bright-contrast colors. Some of them may overwhelm or even cause issues to people who are visually impaired, which goes against the purpose of data visualization.
- Additional visual indicator: Instead of relying on only one design element — like color — to convey information, it’s better to include an additional visual indicator such as a pattern or label to ensure the entire audience can comprehend your data.
- Text: Consider adding alternative “alt” text to provide context to your visuals for those who rely on screen readers for understanding data.
Data visualization FAQs
A data visualization tool is a kind of software that enables you to visualize data by taking raw numbers or text and turning them into graphics.
There are plenty of data visualization tools available online, including our own platform. Browse customizable chats and diagram templates, access our curated media library, and take advantage of AI-powered tools like Magic Charts to choose the right chart every time.
According to an article cited by the National Library of Medicine, the human brain processes images 60,000 times faster than text(opens in a new tab or window), with 90% of information transmitted being visual. That’s why data visualization is effective in simplifying data and making it more accessible through graphics. With charts or diagrams, it’s quick to make sense of large sets of numbers. Viewers can easily share their insights and feel empowered in making informed, evidence-based decisions.
Create on-brand data visualizations all the time with Brand Kit (Pro). Just set up your brand fonts, colors, logos, icons, imagery, and graphics to ensure brand consistency for every design, across all touchpoints. You can also try Magic Charts. With one click, you can turn complex info into interactive charts that work beautifully with your brand.
Design, create, and share all kinds of charts, diagrams, and graphs with Canva. Make area charts, pie charts, ecomaps, balanced scorecards, kanban boards, swimlane diagrams, and so much more. Check out our free graph maker(opens in a new tab or window) where chart types are classified under data charts, relationships and comparison, and processes and flows. You can also take your data viz to the next level by adding advanced charts via Flourish(opens in a new tab or window).
You can embed your data visualization into any design in our Visual Suite(opens in a new tab or window), which includes docs, sheets, online whiteboards, presentations, websites, and more.
Yes, creating data visualization is free on our platform, so you and your team can visualize your data sets for every purpose or project. That said, the built-in AI tools, like Magic Charts and Magic Insights, do use up credits, so consider signing up to Pro, Teams, or Enterprise to unlock more credits.
Was this page helpful?
Quickly analyze complex information with data visualization


