


In this article, you will learn about the fundamental differences between rows and columns with simple examples, their purpose, advantages, and limitations.
Rows and columns are the building blocks of data representation in spreadsheets, databases, and tables. Understanding the difference between columns and rows can be very helpful in data entry, analysis, and reporting.
If you are new to the world of Microsoft Excel and having trouble understanding the difference between these two words, then this article is a must-read for you.
In this article, we will learn what exactly is the difference between rows and columns, how they work, and how to use them with examples, along with their limitations.
Table of Contents:
- Row Vs Column: Key Differences Explained
- What are Rows in Excel?
- What are Columns in Excel?
- Advantages of Rows and Columns in Excel
- Limitations of Rows and Columns in Excel
- Limitations of Rows and Columns in Google Sheets, MS Excel and Database :
- Row-Oriented vs Column-Oriented Databases
- Frequently Asked Questions
- Conclusion
Row Vs Column: Key Differences Explained

Rows and columns are used to organize data in a structured and readable format, especially in tables, spreadsheets, and databases. Although both are part of the same grid system, they serve different purposes and follow different orientations.
A row runs horizontally from left to right and usually represents a single record or entry.
A column, on the other hand, runs vertically from top to bottom and represents a specific attribute or field.
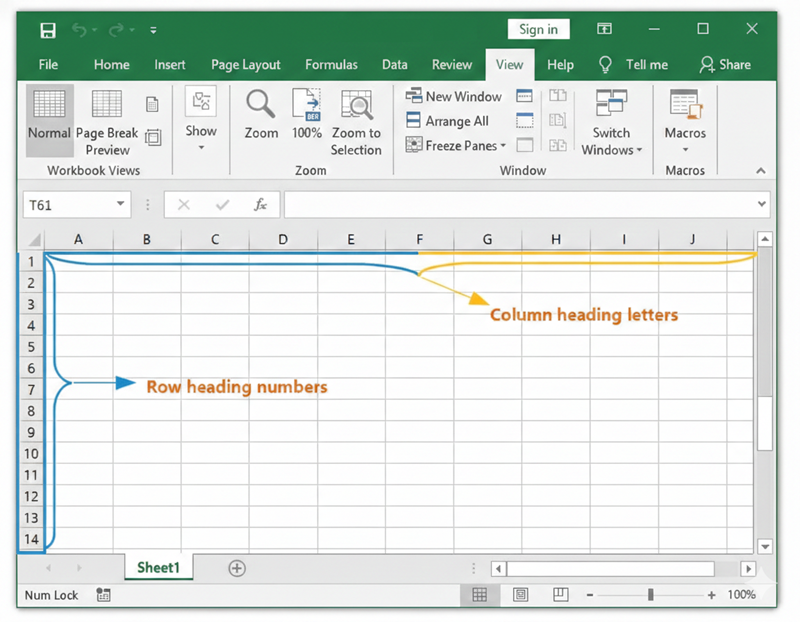
In short, Rows are horizontal (left-to-right, numbered 1, 2, 3), while columns are vertical (top-to-bottom, lettered A, B, C) in excel sheet as shown in the below excel sheet.
Understanding the difference between rows and columns is important for accurate data entry, sorting, filtering, and analysis.
Let’s get started.
We will begin by analyzing these two components, rows and columns, individually in detail.
What are Rows in Excel?
When data or data series is placed horizontally on a table (spreadsheet), we call it a Row. This data can be words, numbers, or objects. Rows can be defined as a horizontal layout of data running from left to right. With rows, data is arranged in a straight line and lies next to each other. It runs horizontally in a table and is represented by a number.
A worksheet can have a maximum of 1048576 rows. This can be understood with the help of some real-life examples. Imagine a situation when we see a group of dwelling units built next to each other.
Refer to the diagram below:

What are Columns in Excel?
Columns can be defined as the vertical arrangement of data and run from the top of the table to the bottom of the table. A worksheet can have up to 16384 columns.

Column vs Row: Difference Between Column vs Row in Excel
The diagram below shows a representation of rows and columns on a Microsoft Excel Worksheet:

To navigate to a particular cell on a worksheet, the ideal way is to talk about the row number and column letter. In the image above, if we want to look for the weight of Y, you need to look at cell D4 (which is the 4th row and column D). It is important to notice here that we always use the column first, which is followed by the row number.
Navigation
Here are some shortcuts that one can use to navigate between rows and columns on a spreadsheet:
- To move from the first to the last row: If you are a Windows user, you can use the Control key + the down navigation arrow (hold the Ctrl+ down arrow) to move to the last row.
- To move to the last column: Use Ctrl+ Right directional key (arrow) to move to the last column.
Examples of Rows and Columns
Let us understand the concept of rows and columns, taking a few examples from everyday life.
While discussing rows, a classroom with children sitting on chairs arranged in a horizontal line facing the teacher is an example of a row. In a cinema theater, the seating arrangement of the chairs is an example of a Row.
For columns, a library bookshelf is a good example. Books placed one above the other in a vertical section of a bookshelf represent a column. Another example is an apartment building where the flats are arranged one above the other from the ground floor to the top floor.
These real-life examples make it easier to remember that rows extend horizontally and columns extend vertically.
Rows vs Columns: A Comparison Table
The key differences are explained in the below comparison table:
| Points of difference | Rows | Columns |
|---|---|---|
| Meaning | A horizontal arrangement of data in a table or spreadsheet. | A vertical arrangement of data in a table or spreadsheet. |
| Direction | Left to right | Top to bottom |
| Representation in Excel | Identified by numbers (1, 2, 3…) | Identified by letters (A, B, C…) |
| Purpose | Represents a single complete record. | Represents a specific data field or attribute. |
| Database Term | Record | Field |
| Matrix Term | Horizontal array | Vertical array |
| Data Analysis Use | Useful for viewing and comparing individual entries. | Useful for calculations, filtering, and analysis. |
| Total / Sum Display | Total appears at the end of the row. | Total appears at the bottom of the column. |
Advantages of Rows and Columns in Excel
Advantages of Rows
- Rows allow for the storage and display of full records in one location.
- They are used to compare individual items, such as one student or one product at a time.
- Rows are helpful for ordering data horizontally, such as ordering data by dates or names.
- Rows in spreadsheets and databases make data entry easier.
Advantages of Columns
- The columns appear to represent particular attributes or fields, such as names, prices, or dates.
- They make data analysis, filtering, and calculations easier.
- Columns help ensure data consistency because all columns have the same kind of data. In tools like Excel, formulas and functions work efficiently on columns.
Limitations of Rows and Columns in Excel
Limitations of Rows
- Too many rows can make it difficult to read and navigate the data.
- Horizontal scrolling may be needed if there are a lot of values in the rows.
- Rows alone cannot be used to analyze specific attributes over multiple records.
- Large datasets with an excess of rows may affect performance.
Limitations of Columns
- Too many columns make the spreadsheet too wide.
- Vertical scrolling can also get confusing in the case of larger data sets.
- A set of columns alone does not make a complete record unless accompanied by rows. Poorly named columns or having too many columns can result in incorrect interpretation of the data.
- Poorly named columns or having too many columns can result in incorrect interpretation of the data.
Limitations of Rows and Columns in Google Sheets, MS Excel and Database :
#1) Limitation in Google Sheets
A Google sheet limits the maximum number of cells to 5 million either in a single worksheet or in multiple sheets. This translates to the fact that in case the upper limit of 5 million cells (either rows or columns) is reached, it will not allow any additional cells.
Google sheets which limit the total number of columns to 18,278, however, allow unlimited rows. There is also no limit specified for the number of tabs however, this is dependent on the 5 million cell limit.
The default number of cells in a new worksheet is 26000, i.e. 100 rows and 26 columns. If this limit for rows and columns is followed, we can have a maximum of 192 worksheets.
2) Limitations in MS Excel
In the case of MS Excel, the worksheets have a maximum of 16,384 columns and 1048576 rows. The last column is represented as XFD and indicates column number 16384.
As the total number of letters in the Alphabet is 26, and columns are represented by letters, after the 26th column (Column Z), the next column number is continued with the start of the letters again.
Reference =>> Excel specifications and limits
#3) Limitation of rows and columns in the database
MySQL limits columns at 4096 per table however, the effective maximum can possibly be less for a given table and depends on multiple factors like restrictions imposed by storage engines or the maximum row size as the total length of columns cannot be greater than the row size.
For instance, InnoDB limits columns at 1017 columns per table. For rows size, InnoDB sets the row size as less than half a page for 4kB,8KB, 16KB, and 32KB page size settings. Therefore, in case the page size is default 16KB, the maximum row size is a little less than 8KB.
While talking about rows, the MySQL table has an upper limit of 65,535 bytes for row size irrespective of the fact that the storage engine may be capable of containing larger rows.
Reference =>> Limits on Table Column Count
Row-Oriented vs Column-Oriented Databases
So far, we have discussed columns and rows for MS Excel. However, let us now understand rows and columns in database tables.
In the case of relational databases, the organization of data is done in two ways:
- Row oriented
- Column-oriented (This is also referred to as Columnar or C-store)
To explain the difference between these two terms, let us consider the table below:

Row-oriented databases: In these databases, data is organized by the record. In other words, it organizes all the data related to a record next to each other. This also means that rows follow each other in an immediate sequence.
This method of data storage has been popular for a long and hence is also called ‘traditional’. The row-oriented database provides the benefits of efficient reading and writing of rows. Even the columns in a single row are stored together on the same page (considering the size of the row is smaller than the size of the page).
This layout gives a boost to performance when a query is run for multiple columns of a single row. This is a very common scenario in Online Transactional Processing (OLTP) applications. To name a few examples of common row-oriented databases, PostgreSQL and MySQL top the chart.
Suggested Reading =>> Comparison between PostgreSQL vs MySQL
The data in the above table will be represented as below in a row-oriented database:

Column-oriented databases: In columnar-oriented databases, every row of a column is placed next to other rows in that same column. In other words, data from each column is stored together on a disk. Since the columns are stored together, only those blocks which contain the required data are read and unnecessary data is skipped.
This makes it quicker and faster to access data. Column-oriented databases are the preferred choice when dealing with a high volume of data. The most common usage of column-oriented databases is for Online Analytical Processing (OLAP) applications. Some common examples are Amazon Redshift and BigQuery.
The below image shows columnar storage of data:

Row-Oriented vs Column-Oriented: How to Choose
We have now come to the last section of the article, where we discuss an important question that may have struck you a few times while reading about rows and columns. We have been talking about rows, columns, data, databases, etc. however, how do you decide if the data must be stored in rows or in columns?
In other words, should the database be row-oriented or column-oriented?
Here is how this dilemma can be answered. Unarguably, one common need for all databases is that they should be fast. It is imperative to select the most appropriate database so that the queries run will respond with speed.
With a simple decision of changing how data is stored in the memory, a few types of queries can run faster, thereby impacting the performance of databases. As discussed earlier, the basic architecture of storage of data is different for row and column-oriented databases.
As the names suggest, column-oriented databases work on columns and have vertical partitions, while row-oriented databases work on rows where the partitions are horizontal. This choice can have a great impact on the performance of the query.
A columnar store is a better choice when the data that needs to be accessed is mostly saved in columns and there is no need to run a query for each field in the rows. On the contrary, if, in each row, many columns are needed to find out the relevant rows, a row-store is a better choice.
Columnar stores offer the benefit of more efficient partial reads. This is because the volume of data loaded is low since it reads only the relevant data and not the entire record. Columnar stores are relatively more recent as compared to row stores, thereby giving the term ‘traditional’ to row stores.
Frequently Asked Questions
Q #1) How to find rows and columns in a table?
Answer: The best way to find rows and columns is to look at the manner of arrangement. A vertical arrangement is a column and a horizontal arrangement is a row.
Q #2) Do rows come first or columns?
Answer: As a practice, the first to be listed are the rows followed by columns. For example, the term 3×4 (used for a matrix) means 3 rows and 4 columns.
Q #3) Is there a difference between a cell and a column?
Answer: Yes, the point of intersection of a row and column is called a ‘cell’. Each cell is recognized by its name, which has the column (corresponding letter of column-like A, B, C, etc.) followed by the row number (1,2,3, etc.).
Q #4) How many rows and columns can MS Excel handle?
Answer: MS Excel can have up to a maximum of 1,048,576 rows and 16384 columns.
Conclusion
In this article, we have discussed the two fundamental components of any table, namely rows and columns. While dealing with saving data or analysis of data, it is important to clearly understand the difference between rows and columns, as it lays the very foundation of data analysis.
For the benefit of our readers, we have explained the basic concept of row and column, followed by examples.
Also Read =>> Top MS Excel Interview Questions
Research Process:
- Our Team has created this guide by exploring how rows and columns are used in everyday tools like Excel, spreadsheets, and databases. We tested the concepts using real Excel sheets to clearly show how data is arranged and accessed.
- To add depth, we also looked at basic database storage models to understand how row-oriented and column-oriented systems work in practice.
- Total Time taken to research and publish this article: 40 Hours (Approx)
Was this helpful?
Recommended Reading
-

We will learn what is an Excel Pivot Table, why it is useful, and how to create a Pivot Table in Excel with the help of a step-by-step example: Microsoft Excel has several great features that allow us to organize and analyze data. A pivot table is yet another excellent…
-
List of the top MS Excel Interview Questions and Answers. This tutorial answers interview question on Excel with examples to help you prepare for the interview: Excel - a product of Microsoft, is a software that utilizes spreadsheets to arrange formulas, functions, and sort numbers & data in rows and…
-
This hands-on Excel Macros tutorial explains what is a Macro, how to create and use VBA Macros with plenty of examples: Most of us in the industry will surely have certain tasks that are to be performed repeatedly almost every day. Now imagine if those tasks are done with just…
-
This tutorial explains how to create and apply Excel Slicer and Timeline to single or multiple Pivot tables to filter the table and get the desired results: Filters in general are very important for any report or tables as they help us in displaying only the desired details at a…
-
This tutorial will explain VBA Array, various array types, variant array, and array methods with the help of programming examples: A regular VBA variable is a place holder that stores the value of a single data. It has a 1 to 1 relationship i.e. 1 variable for 1 value. Now…
-
This tutorial explains how to Open CSV Files to access your data. Learn multiple ways to open the CSV file format on various applications: Ever came across a CSV file on your system, and when asked what application you want it to open, you had no idea? Many of you…
-
This tutorial explains what are XML files, how to create them, and how to open the XML file with a browser like Chrome, text editor like MS Word, Excel, and XML Explorer: XML is an acronym for Extensible Markup Language. In this tutorial, we will understand what an XML file…
-
This hands-on tutorial explains what is a Pivot Chart and how to make and customize it. We will also see the difference between the Pivot Chart vs Table: Charts are considered one of the best ways to present the report. They help us understand and analyze the data more simply.…


