We use Power BI every day to present data. Do you?
Presenting data with Power BI is simple!
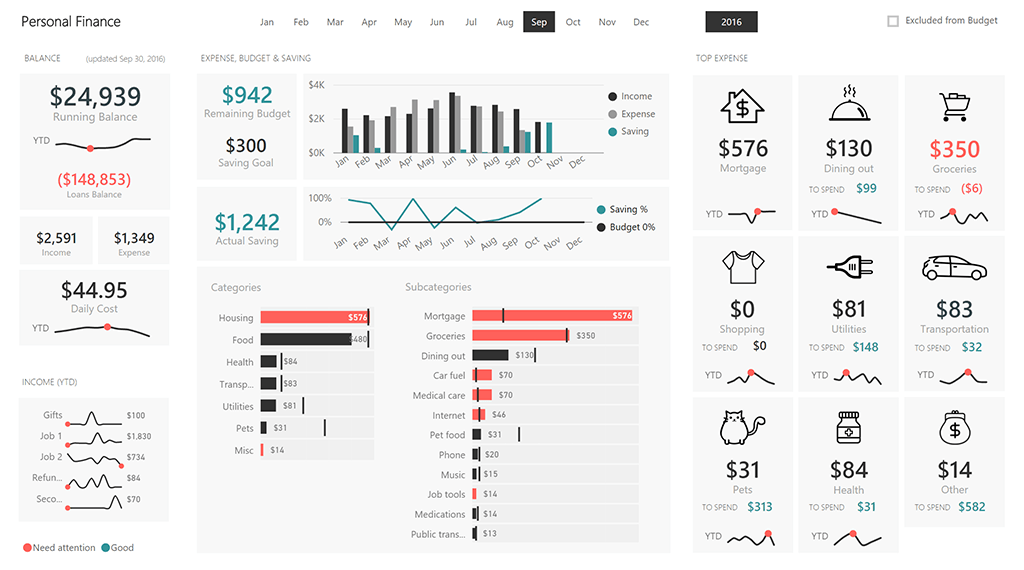
Anyone can draw charts on the canvas, connect them to a few measures and start visualizing numbers in colorful and aesthetically appealing dashboards.
Now... Is it easy to design a good dashboard?
Unfortunately, it is not.
Displaying data properly in a dashboard or in a report means making decisions, designing with a specific target audience in mind, including only the most relevant information, and picking charts carefully.
People often create reports just by dropping data on the canvas, without proper planning.
Common design pitfalls
-
 Do you know that some of the most popular Power BI visuals, such as the Pie/Donut Charts should mostly be avoided*?*We are not the only ones saying it. Take a look at the Save the pies for dessert article by Stephen Few.
 -
 Did you know that about 8% of the population has a different way of perceiving colors? As it happens, one of the patterns affected by this phenomenon is the widely used Red-Green!
 -
 Did you know that you should never use Bar Charts with time series? Or that you don't necessarily have to use Map Charts every time you are dealing with geographical data? Or that a Bar Chart should be preferred to a Treemap in 90% of cases?
It is necessary to learn rules and to apply a series of design concepts in order to display data effectively.
Enter our course.
The Power BI Dashboard Design Course is a video course for people who want to learn how to create beautiful dashboards to use every day – while avoiding common design mistakes.

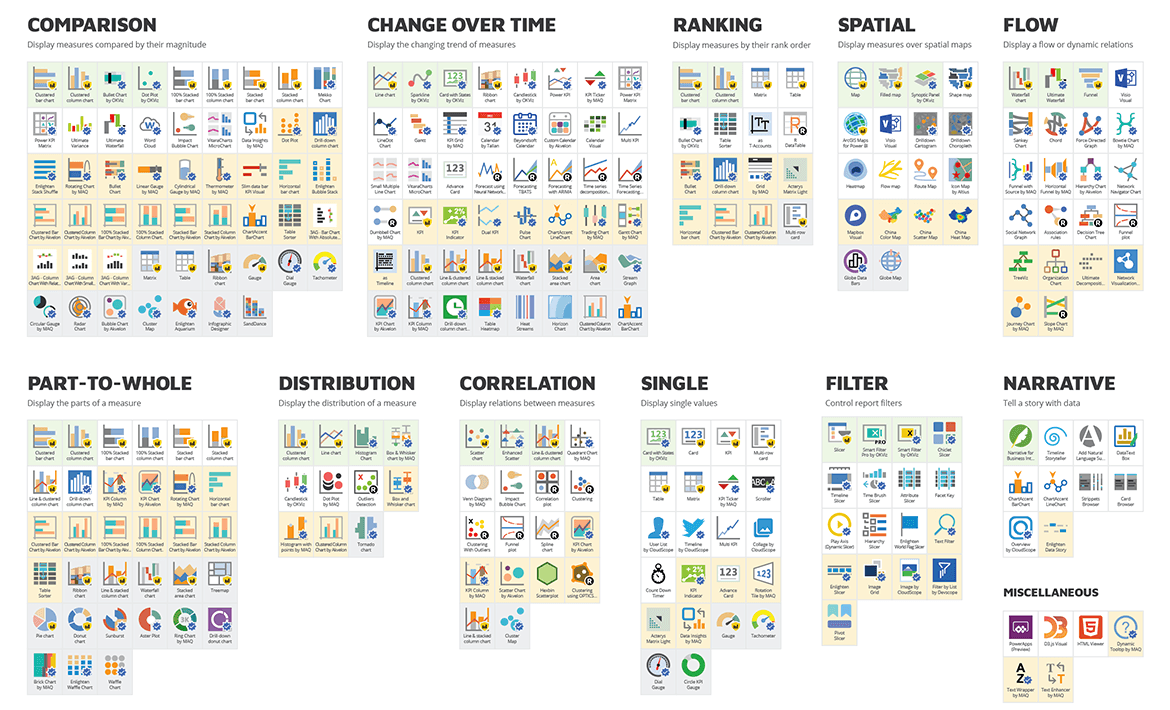
The course includes 106 video lectures, a Chart Reference – essential to choose the best visuals for your data – and these 15 design rules:
-
 Design for a target
 -
 Keep everything at a glance
 -
 Keep it simple
 -
 Align elements
 -
 Be consistent
 -
 Highlight the most relevant information
 -
 Be clear
 -
 Start from zero
 -
 Shorten the numbers
 -
 Show the context
 -
 Choose the right colors
 -
 Design dashboards, not reports
 -
 Show variations
 -
 Leave the noise off
 -
 Pick the right charts
Are you looking for the right charts for your report?
A detailed Chart Reference is included in our course. If you want an overview of all the visuals available today in Power BI, take a look at our free PDF Visual Reference.