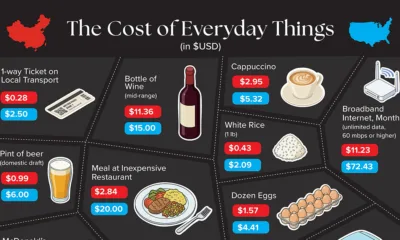
Compare the cost of everyday things in China and the U.S., from rent and milk to mobile plans and meals.


click for more →
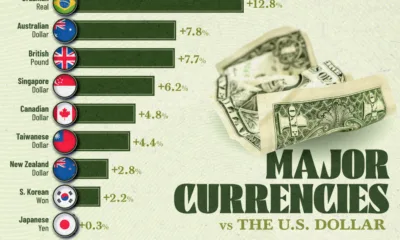

As the U.S. dollar weakened in 2025, we show the appreciation of several currencies against the U.S. dollar in a highly unpredictable year.


This visualization breaks down the U.S. $13.4 trillion ETF market by asset class, showing how ETFs allocate capital across equities, bonds, and more.
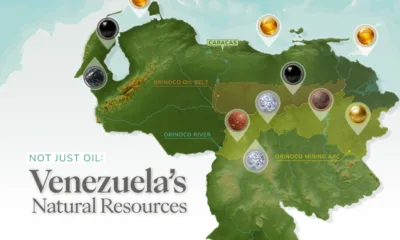

Oil dominates Venezuela's natural resources, but vast gas, gold, and mineral reserves hint at untapped potential.
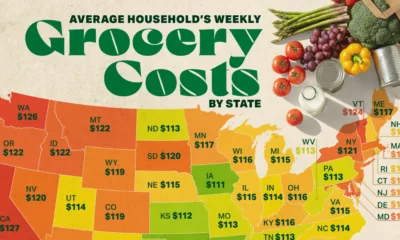

As ground beef prices rise 15% and orange juice jumps 21% in 2025, we break down the average weekly grocery bill by state.
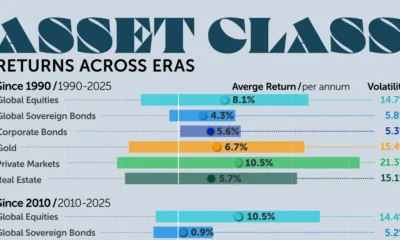

Private markets show the highest long-term returns, while gold has been the best-performing asset since 2020.
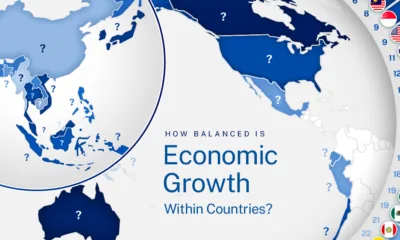

Levels of economic development differ not only from one country to another, but also dramatically within their own borders. Which countries lead versus lag?
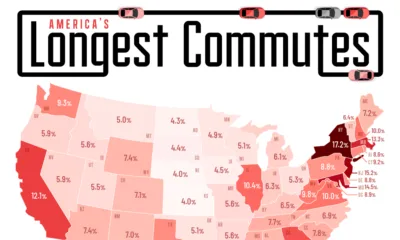

The longest commutes are heavily concentrated in the Northeast, with New York leading the way.
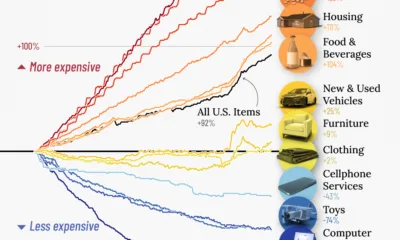

We show stark differences in U.S. inflation by category since 2000, from hospital services to college tuition.
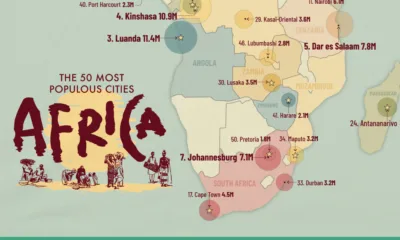

Cairo leads with a population of over 25.5 million, followed by Lagos in Nigeria.
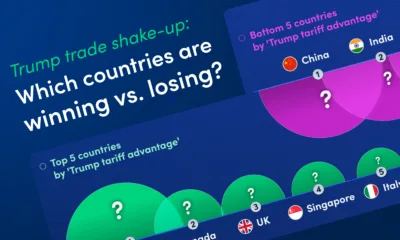

As U.S. trade policy shifts under President Trump, global exporters are facing a more uneven landscape. Which ones are winning versus losing?

click for more →


 Creator Program