Book an FP&A Audit
Financial Analytics & FP&A

Close the books faster.
Decide sooner.

We build the FP&A operating layer for mid-market and PE-backed organizations at $30M-$500M ARR: automated close, driver based forecasts, and board ready reporting that reads live from your ledger.

Reads live from [NetSuite] Automated close. Driver forecasts. Built on your stack.

Automated close Ledger wired into one model 10→2 days to variance
Driver forecasts Named drivers, versioned 18mo rolling horizon
Variance analysis Budget, actual, forecast 4hrs per scenario
Built on your stack No rip and replace ledger migrations
The Gap

Where finance is reporting the past instead of shaping the next quarter.

The finance
disconnect

GAP-01 · CFO / Finance Leadership

The board deck is a story about last quarter, not next quarter.

Actuals close on day ten. By the time variance is explained, the quarter is already half over. No one is planning, everyone is reporting.

GAP-02 · The Business

Every forecast is a spreadsheet nobody trusts by week three.

Assumptions drift, versions fork, and by the time you present the model the underlying pipeline, hiring, and usage numbers have already moved.

GAP-03 · Operations

Budget owners find out they're over spend after it's spent.

Departmental budgets live in one system, invoices in another, POs in a third. Variance shows up in the month-end close, not in time to correct.

GAP-04 · Executive Team

You cannot answer, cleanly, what a 10 percent revenue miss actually costs.

Contribution margin by segment, cash runway sensitivity, headcount plan compression. The model exists in someone's head, not in a shared source of truth.

The Operating Layer

One financial model

  1. Automated close feeds a variance panel the CFO opens on day two of the month, not on day fifteen.

ownership & handoff

Ledger to decision

actuals forecast
Budget Owners commitments / POs Trending over budget in week two
Board Layer reads live No manual assembly on Sunday night
Ledger gl / sub ledgers NetSuite, QuickBooks, Xero stay the record
Chart of Accounts dimensions / tags Sliced by segment, product, team
Driver Model named drivers Pipeline, ramp, churn, hiring plan
Variance day two, not fifteen Budget, actual, forecast, variance
Forecast 12 to 18 months Scenarios in hours, not weekends
Decision one shared view One number the whole exec team trusts
hover a stage to inspect
What It Costs

Every finance workflow leaks.

Data pulled by hand. Versions forked overnight. Variance surfaced after the quarter is decided. Each leak is small. Together, they are the reason finance is always explaining, never steering.

Books Close DAY 10 / ACTUALS ARRIVE
Data Pulled by Hand EXPORTS, PASTES, RECONCILES
Model Rebuilt VERSIONS FORKED OVERNIGHT
Variance Explained DAY 15 / AFTER THE FACT
Decision Made QUARTER ALREADY HALF OVER
Variance visible on day two MODEL UPDATES ITSELF
0

of FP&A time is spent assembling the numbers, not analyzing them.

LEAK/01 Manual pulls Actuals arrive on day ten. Variance is explained on day fifteen. The quarter is already half over before anyone can act.
LEAK/02 Version drift The forecast is a single spreadsheet that one person owns. Assumptions live in cell comments. Nobody trusts it by week three.
LEAK/03 Late variance Budget owners find out they overspent when the invoice hits the ledger. The conversation is always retrospective.
Where You Are

Four stages
of finance maturity.

Most mid-market and PE-backed organizations at $30M-$500M ARR sit at Reporting. The goal is Steering: finance in the room, forecasts that move with the business, and decisions grounded in one shared model.

L0 · Reactive

Reactive

Finance closes the books. Everything after that is manual, ad hoc, and email based.

L0
L1 · Reporting

Reporting

Monthly and quarterly reports exist. Variance is explained after the fact, one department at a time.

L1
L2 · Planning

Planning

Annual budget and rolling forecast are in place. Actuals are compared to plan but the plan rarely changes.

You are here
L3 · Steering

Steering

Driver based forecasts update on live data. Scenarios are run in hours, not weeks. Finance is at the table, not behind it.

L3
The Shift

From explaining last quarter to steering the next one.

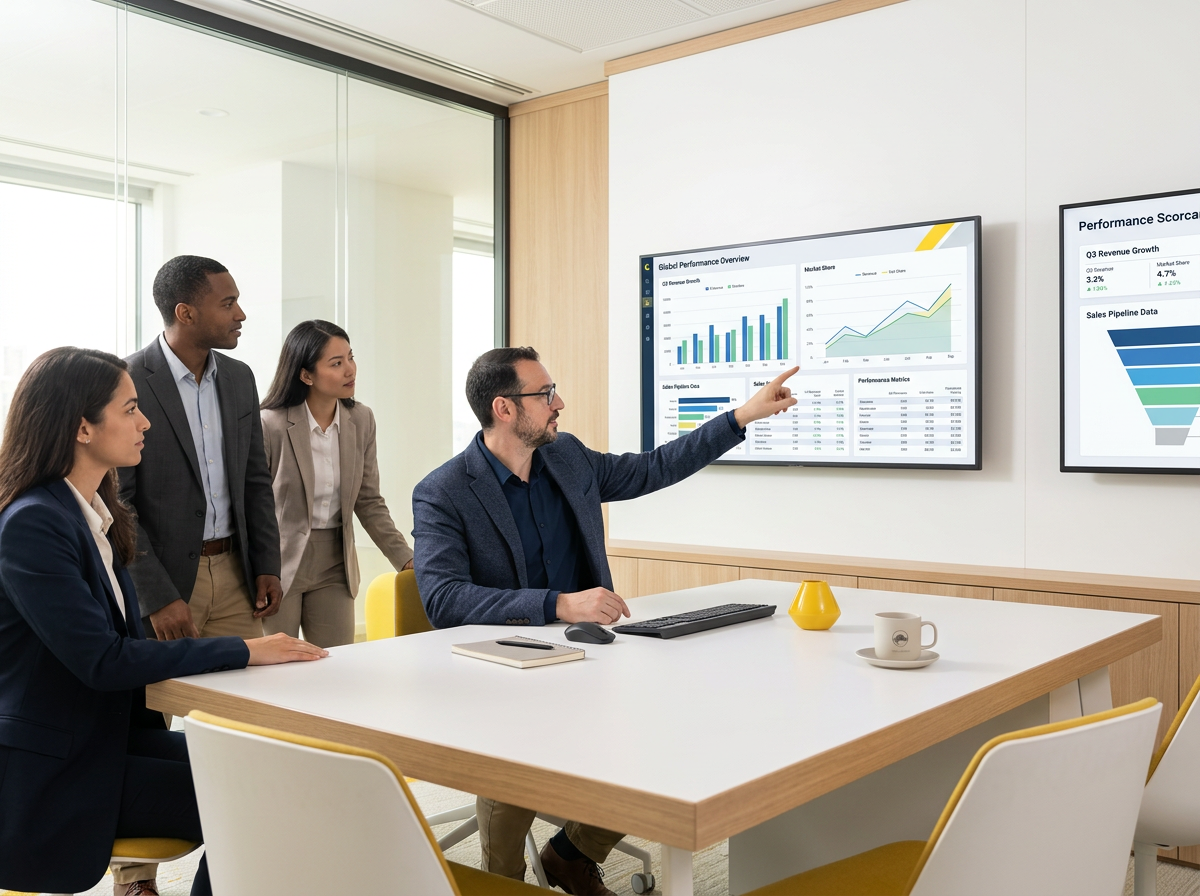
Finance team reviewing a live variance panel

Variance visible on day two.

Automated close feeds a variance panel the CFO opens on day two of the month, not on day fifteen.

Actuals arrive on day ten. Variance is explained on day fifteen. The quarter is already half over before anyone can act.
Image

Driver based, versioned, auditable.

Forecasts are built on named drivers (pipeline, ramp, churn, hiring plan). Every version is stored. Every change has an owner.

The forecast is a single spreadsheet that one person owns. Assumptions live in cell comments. Nobody trusts it by week three.
Image

Budget owners see commitments, not just actuals.

POs, commitments, and accruals feed the same view. Owners see they are trending over budget in week two, not month three.

Budget owners find out they overspent when the invoice hits the ledger. The conversation is always retrospective.
Methodology

Four stages.
Twelve to fourteen weeks.

  • → Data map, reconciliation gaps, close bottlenecks

    We inventory every source the finance function touches: general ledger, sub ledgers, expense system, HRIS, billing, CRM. We document the actual reconciliation path and where the numbers diverge today.

The Stack

Built on the tools you already use.

We do not rip and replace. We meet your ledger, planning tool, and BI layer where they are and build the model, drivers, and reporting on top.

The Core One financial model

Ledger, planning tool, and BI layer stay yours. Every chart pulls from the same numbers.

  • NetSuite — Ledger
  • QuickBooks — Ledger
  • Xero — Ledger
  • Pigment — Planning
  • Cube — Planning
  • Anaplan — Planning
  • Sheets — Modeling
  • Looker — Reporting
  • Metabase — Reporting
  • Sigma — Reporting
  • Tableau — Reporting
  • Automation — Close workflows
Layer I · Ledger and Close

The system of record.

NetSuite · QuickBooks · Xero

Where actuals live. We do not replace your ledger. We build on it, feed it cleanly, and pull from it into the model.

Layer II · Planning and Modeling

Where the forecast is built.

Pigment · Cube · Anaplan · Sheets

Driver based, versioned, owned. We meet you on the tool your team already uses, or we help you pick one that fits your stage.

Layer III · Reporting and BI

Where finance meets the business.

Looker · Metabase · Sigma · Tableau

Board deck, executive dashboards, department views. One semantic layer so every chart pulls from the same numbers.

Architecture

From ledger to board deck, wired end to end.

ERP, CRM, billing, and spend data land in one finance model. Reconciled, mapped, and tested on every run, then published to your planning tool and reporting layer.

Deliverables

What you walk away with.

D-01

Financial data audit report

Output Inventory of every source, reconciliation path, and gap. Delivered in weeks one and two.
D-02

Chart of accounts and driver dictionary

Output Restructured COA, dimensional taxonomy, and the drivers your forecast will run on.
D-03

Automated close pipeline

Output Ledger and sub ledgers wired into a shared model. Variance computed on day two, not day fifteen.
D-04

CFO variance panel

Output One view: budget, actual, forecast, variance. Owned by finance, opened by the exec team.
D-05

Rolling forecast and scenario model

Output Twelve to eighteen months forward. Driver based. Scenarios in hours, not weekends.
D-06

Board ready reporting layer

Output Executive dashboards and a board deck template that reads live from the model. No manual assembly.
Case Study

Proof, not promise.

Case Study · Unblu

Unblu needed to switch providers on a tight deadline without breaking a platform of 500+ pages. We inventoried every form, scripted the extraction and replacement, added visual regression tests, and ran the switch in production in minutes.

50+

forms moved across 500+ pages

<10d

of preparation, scoping, and execution

0

minutes of downtime during the provider switch

Read the full case study
Who This Is For

Built for finance leaders who want to steer, not just report.

Role profile · 01 / 04

CFO

Signals
  • Close takes ten plus days.
  • The forecast is one person's spreadsheet.
This is you if
  • You want to move from reporting to steering.
  • You need one number the whole exec team trusts.
  • You are tired of week long fire drills for every board update.
Not a fit
✕ 01

Companies below $10M ARR without a finance function to partner with.

✕ 02

Teams looking for a bookkeeper or outsourced controller. We build the operating layer, we do not run your close for you long term.

✕ 03

Buyers who want a licensed tool without the model, dimensions, and drivers built for them.

What changes after the build.

0→2
Days from month end to variance visible to the exec team.
0mo
Rolling forecast horizon, updating on live operational data.
0hrs
Time to run a full scenario. Prior state: a weekend rebuild.
Testimonials

What finance leaders say after the build.

NITROPACK
“When it comes to a high-scale revenue delivery initiative, DevriX gets the job done, period. They quickly jumped in on a partially-started project and led it to completion in record time. They worked with our team to iron out the finer details while building the full picture. Communication, attention to detail, and attentiveness were all 5-star. Stellar work.”
MS Mihail Stoychev Co-founder, CEO of NitroPack (acquired by WP Engine)

Strategy is common.
Execution is what matters most.

15+ years of engineering technical infrastructure. Built for complex businesses.

We have been in business for more than fifteen years, building and running technical infrastructure for companies across SaaS, fintech, media, ecommerce, healthcare, and professional services. The reason to work with us is not a framework. It is the complex problems we have already solved, and an engineering approach proven across that many industries.

  • SaaS
  • Fintech
  • Media
  • Ecommerce
  • Healthcare
  • Professional services
15+ Years in business

Building and running infrastructure through every cycle.

Complex Problems solved

Messy data, legacy systems, scale. We have seen it before.

Proven Engineering approach

One standard, applied across industries and stacks.

Why DevriX

Why not just build this internally?

“We already have a controller and a bookkeeper.”

Good. They own the ledger and the close. We build the layer above: the driver model, the variance workflow, and the reporting that turns their output into decisions.

“We just bought an FP&A tool.”

A tool is a canvas. We build the model, the dimensions, the drivers, and the reporting on top of it. Teams that skip this step end up with a licensed spreadsheet.

“Can our team not just do this over a quarter?”

They could. It usually takes two to three quarters, they get pulled onto close every month end, and the model is still owned by one person when they finish. We do it in twelve to fourteen weeks, alongside them, and hand off ownership.

  • We build the model. Your team owns it after handoff.
  • Ledger, planning tool, and BI layer stay yours. We do not rip and replace.
  • Driver based, not tab based. Every assumption has a name and an owner.
  • Board deck reads live from the model. No manual assembly on Sunday night.
Get Started

Stop explaining last quarter. Start steering the next one.

Start with an FP&A audit. Two to three weeks, fixed scope. You get a data map, the reconciliation gaps, and a prioritized plan for the close, the model, and the reporting layer.

FAQ

Frequently raised questions.

01 Do you replace our accounting system?

No. We build on top of your ledger. NetSuite, QuickBooks, or Xero stays the system of record. We wire it into a model your team can actually plan with.

02 How long does an engagement take?

Twelve to fourteen weeks for the full build: audit, chart of accounts, automated close, rolling forecast, and reporting layer. Some clients start with the audit only, which is two to three weeks.

03 Do you work with our existing FP&A tool?

Yes. Pigment, Cube, Anaplan, and Sheets are all fair game. If you have not chosen one, we help you pick based on stage and complexity, not the vendor with the loudest sales team.

04 What data do you need from us to start?

Read access to the ledger, HRIS, billing, and CRM. A finance lead who can answer questions in week one. A commitment to name the drivers, not delegate that.

05 Who owns the model after you leave?

Your finance team. Every driver is documented, every assumption is named, and we spend the last two weeks on handoff. If we disappear, the model still runs.

06 Do you handle the monthly close going forward?

No. That is your controller's job. We build the pipeline that shortens the close and turns it into a variance view. We do not run it for you month after month.