Four monitoring primitives.
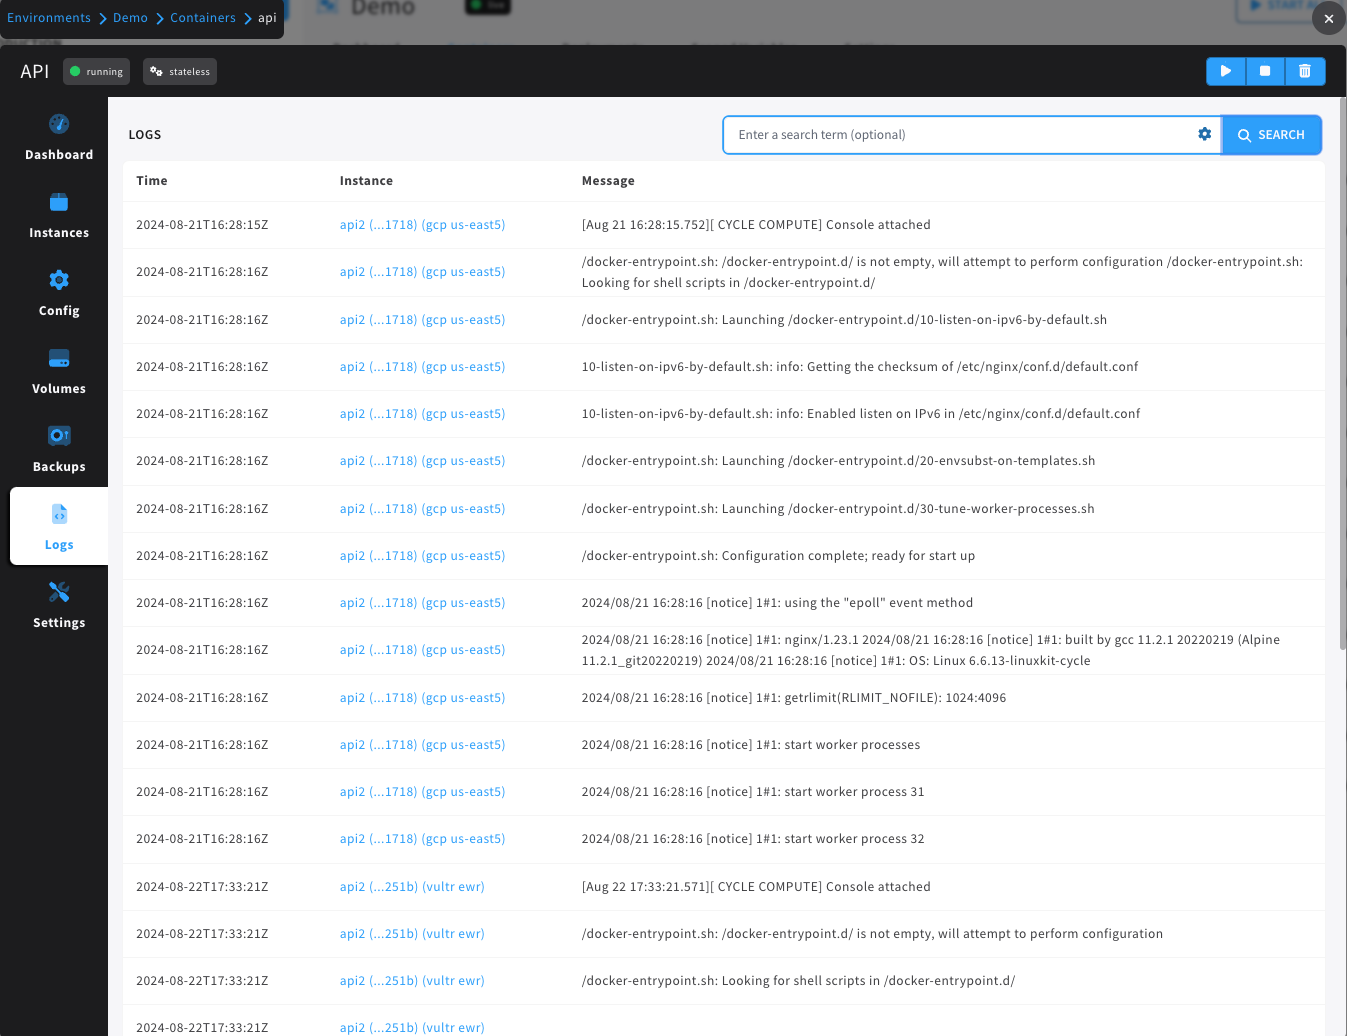
With Cycle, you get instant access to your metrics, logs, events, and audit trails without configuring a single third-party plugin. Need to ingest your metrics to elsewhere? Configure an events/metrics endpoint, or log drain, and Cycle will begin streaming your observability data to the provider of your choice.
Metrics
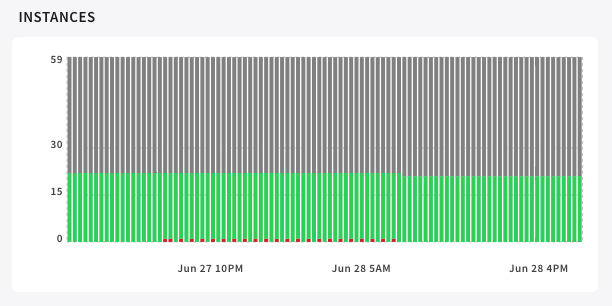
Whether it's container and virtual machine resource usage or the number of logins to your application, Cycle provides an integrated API for storing, aggregating, and querying granular metrics.
"points": [
[ ISODate("2026-04-21T17:51:14.745+0000"), NumberLong(76) ]
]
Events
From container restarts to node updates, all meaningful actions or notices yield point-in-time events.
Application & Server Logs
Cycle automatically captures and aggregates stdout and stderr from both your underlying servers and containers.
Hub Activity
Complete accountability. Maintain a strict audit trail of exactly which team member, or which programmatic API key, executed any action.
Push Custom Telemetry.
Use the internal API socket to extend Cycle's default observability data points by pushing your own application-specific events and metrics.
'%20fill='none'%20/%3e%3cpath%20d='M105.8,90.4l-38,22.3-38-22.3V45.8l38-22.3,38,22.3ZM135.6,67l-11.1-7a59.32,59.32,0,0,0-2.4-10.3l8.1-9.1a71.49,71.49,0,0,0-11.7-18.8l-12.6,2.8a52.86,52.86,0,0,0-5.9-4.7l.5-12.7A69,69,0,0,0,79-.4L71,10c-1.1-.1-2.1-.1-3.2-.1s-2.1,0-3.2.1L56.7-.3A66.56,66.56,0,0,0,35.2,7.3L35.7,20a52.86,52.86,0,0,0-5.9,4.7L17.2,21.9A66.64,66.64,0,0,0,5.5,40.7l8.1,9.1a61.53,61.53,0,0,0-2.4,10.3L0,67.1v1.7A64.92,64.92,0,0,0,2.6,86.9L14,88.5a56,56,0,0,0,6.4,12.4l-4.5,11.2a69.4,69.4,0,0,0,14.5,13.1l9.6-6.1A57.9,57.9,0,0,0,54.9,125l3.5,11a65.79,65.79,0,0,0,18.8,0l3.5-11a53.29,53.29,0,0,0,14.9-5.9l9.6,6.1a66.74,66.74,0,0,0,14.5-13.1l-4.5-11.2a58.63,58.63,0,0,0,6.3-12.5l11.4-1.6a64.92,64.92,0,0,0,2.6-18.1V67'%20transform='translate(0%205)'%20fill='%23fff'%20/%3e%3cpath%20d='M88.9,45.2,60.6,61.8,67.8,66,96.1,49.4Z'%20transform='translate(0%205)'%20fill='%232aa7ff'%20/%3e%3cpath%20d='M78.3,39,50,55.6l7.2,4.2L85.5,43.1Z'%20transform='translate(0%205)'%20fill='%232aa7ff'%20/%3e%3cpath%20d='M67.8,32.8,39.5,49.4l7.2,4.2L75,37Z'%20transform='translate(0%205)'%20fill='%232aa7ff'%20/%3e%3cpath%20d='M76.7,98V64.8L69.4,69v33.3Z'%20transform='translate(0%205)'%20fill='%232aa7ff'%20/%3e%3cpath%20d='M66.1,102.3V69l-7.2-4.2V98Z'%20transform='translate(0%205)'%20fill='%232aa7ff'%20/%3e%3cpath%20d='M87.2,91.9V58.6L80,62.8V96.1Z'%20transform='translate(0%205)'%20fill='%232aa7ff'%20/%3e%3cpath%20d='M97.8,85.7V52.4l-7.2,4.2V89.9Z'%20transform='translate(0%205)'%20fill='%232aa7ff'%20/%3e%3cpath%20d='M55.6,96.1V62.8l-7.2-4.2V91.9Z'%20transform='translate(0%205)'%20fill='%232aa7ff'%20/%3e%3cpath%20d='M45,89.9V56.6l-7.2-4.2V85.7Z'%20transform='translate(0%205)'%20fill='%232aa7ff'%20/%3e%3c/svg%3e)
Stream observability metrics anywhere.
Configure global endpoints to stream metrics, events, and logs directly to the external tools your team already uses.
