

Available tables
runs: contains all task run data including status, timing, costs, and task output. Run metadata (key-value set in your task) is not available on the Query page.metrics: contains metrics data for your runs including CPU, memory, and your custom metricsllm_metrics: contains LLM/AI metrics including token usage, costs, latency, and model performance data from GenAI spans
metrics table columns
See Logging, tracing & metrics for the full list of automatically collected metrics and how to create custom metrics. You can visualize this data on Dashboards.
prettyFormat()
Use prettyFormat() to format metric values for display:
bytes, percent, duration, durationSeconds, quantity, costInDollars.
Using the Query dashboard
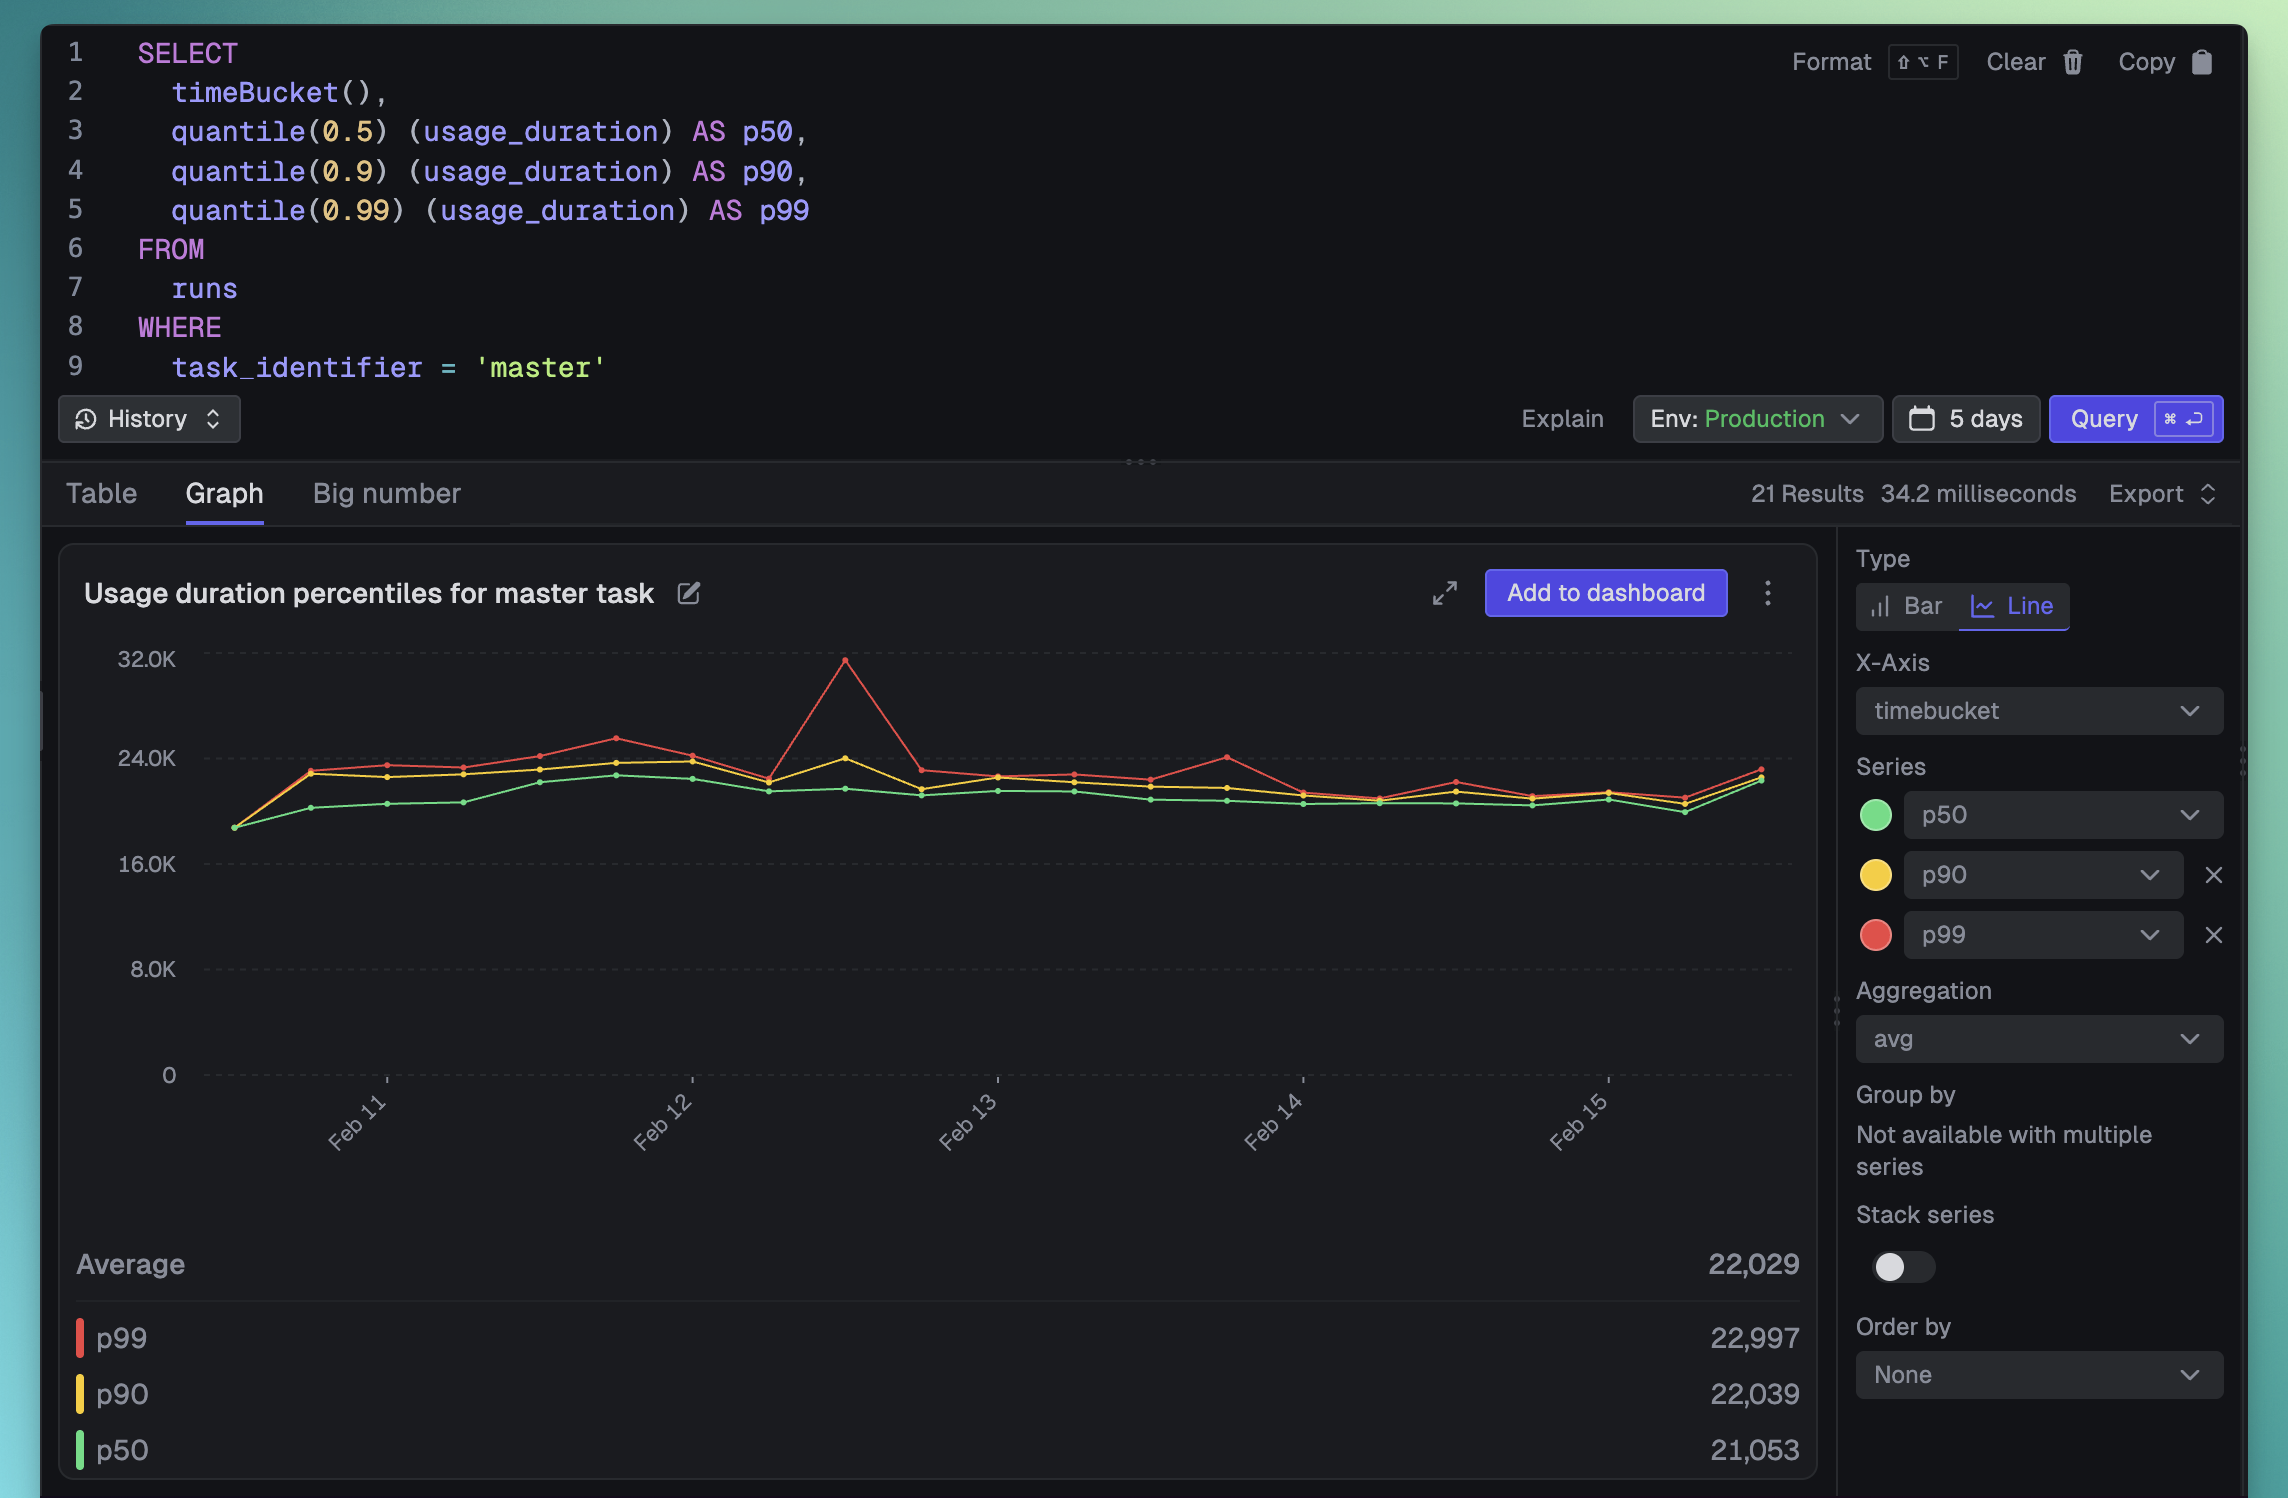
Navigate to the Query page to write and execute queries. The dashboard provides:- AI-powered query generation - Describe what you want in natural language
- Syntax highlighting - SQL syntax highlighting for better readability
- Query history - Access your previous queries
- Interactive help - Built-in documentation for TRQL syntax and functions
- Export options - Download results as JSON or CSV
Querying from the SDK
Usequery.execute() to run TRQL queries programmatically from your backend code:
Type-safe queries
Use theQueryTable type for nice inferred types in your query results:
Query options
CSV export
Export query results as CSV by settingformat: "csv":
Querying from the REST API
Execute queries via HTTP POST to/api/v1/query:
TRQL syntax guide
Basic queries
Select columns from a table:AS:
Using *
Note that when you useSELECT * we don’t return all the columns, we only return the core columns. This is for performance reasons (the underlying ClickHouse database is columnar and selecting lots of columns isn’t efficient).
You should specify the columns you want to return.
Filtering with WHERE
Use comparison operators:Sorting and limiting
Sort results withORDER BY:
Grouping and aggregation
UseGROUP BY with aggregate functions:
Available functions
TRQL provides a rich set of functions for data analysis.Aggregate functions
count()- Count rowscountIf(col, cond)- Count rows matching conditioncountDistinct(col)- Count unique valuessum(col)- Sum of valuessumIf(col, cond)- Sum values matching conditionavg(col)- Average of valuesmin(col)- Minimum valuemax(col)- Maximum valuemedian(col)- Median value (50th percentile)quantile(p)(col)- Value at percentile p (0-1)stddevPop(col)- Population standard deviationstddevSamp(col)- Sample standard deviation
Date/time functions
Time bucketing:now()- Current date and timetoday()- Current datetoDate(dt)- Convert to datetoStartOfDay(dt),toStartOfHour(dt),toStartOfMonth(dt)- Truncate to start of periodformatDateTime(dt, format)- Format datetime as string
String functions
length(s)- String lengthlower(s),upper(s)- Case conversionconcat(s1, s2, ...)- Concatenate stringssubstring(s, offset, len)- Extract substringtrim(s)- Remove whitespacereplace(s, from, to)- Replace occurrencesstartsWith(s, prefix),endsWith(s, suffix)- Check prefixes/suffixes
Conditional functions
if(cond, then, else)- Conditional expressionmultiIf(c1, t1, c2, t2, ..., else)- Multiple conditions (like CASE)coalesce(a, b, ...)- First non-null value
Math functions
Array functions
Useful for working with tags and other array columns:JSON functions
Theoutput, error, and metrics.attributes columns are already JSON, so use dot notation to read or filter on them. You don’t need JSONExtract* for these (those are for string columns).
Query scopes
Control what data your query can access:environment(default) - Query runs in the current environment onlyproject- Query runs across all environments in the projectorganization- Query runs across all projects in the organization
Time ranges
We recommend avoiding addingtriggered_at in the actual TRQL query. The dashboard, API, and SDK have a time filter that is applied automatically and is easier to work with. It means the queries can be executed with multiple periods easily.
Using period shorthand
Using explicit dates
Example queries
Failed runs (in the last 24 hours)
Task success rate by day
Top 10 most expensive runs
Average compute duration over time
Runs by queue and machine
CPU utilization over time
Track process CPU utilization bucketed over time.Memory usage by task (past 7d)
Average process memory usage per task identifier over the last 7 days.Available metric names
List all distinct metric names collected in your environment.Best practices
- Use the built-in time filtering - The dashboard, API, and SDK have a time filter that is applied automatically and is easier to work with. It means the queries can be executed with multiple periods easily.
- Use LIMIT - Add a
LIMITclause to reduce the rows returned if you don’t need everything. - Use appropriate aggregations - For large datasets, use
uniq()instead ofuniqExact()for approximate but faster counts
Limits
We have several limits to prevent abuse and ensure performance:- Concurrency limit: We limit the number of concurrent queries per organization.
- Row limit: We limit the number of rows returned to 10k.
- Time restrictions: We limit the time period you can query.
- Time/Memory limit: We limit the memory a query can use and the time it can run for. As well as other limits like AST complexity.
