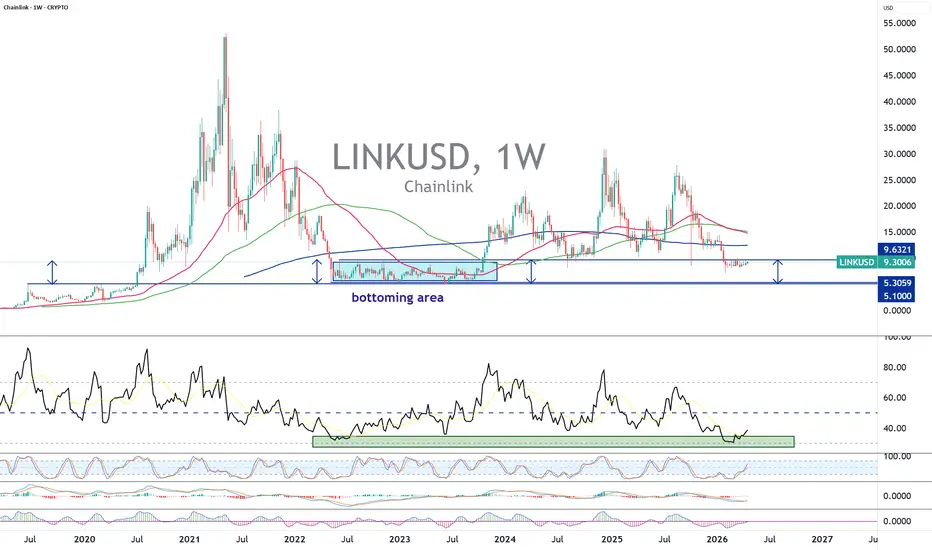
LINK, accumulation zone between $5 and $9While the Clarity Act is in its final phase of drafting and validation for the United States Senate, altcoins that are critical within the interoperability and decentralized finance (DeFi) segment are those that will benefit the most from the adoption of the Clarity Act as a law in the United States

The best trades require research, then commitment.
Get started for free$0 forever, no credit card needed

Scott "Kidd" PoteetPolaris Dawn astronaut

Where the world does markets
Join 100 million traders and investors taking the future into their own hands.
GBPJPY Bullish Structure Holds With Strong Trend ContinuationI’m looking at GBPJPY and this is one of those charts where you don’t want to overcomplicate things. The move up was clean, aggressive, and structurally sound. What we’re seeing now isn’t weakness, it’s digestion. Price pulled back into a defined demand zone and immediately found buyers again. That’

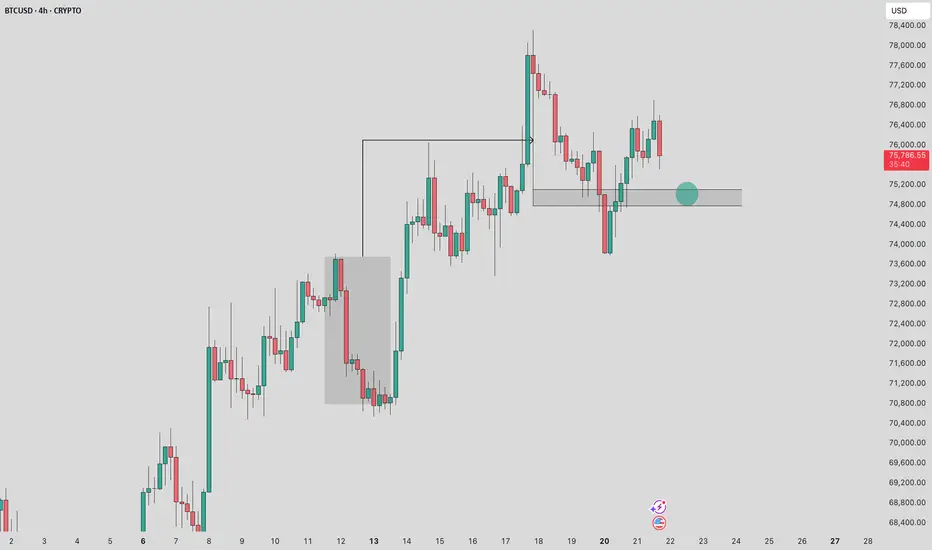
Could be a trade topIt's possible we topped today. If so, the market should keep dropping under 7k. If they hold 7k, then it's just a pullback and we'll go higher for sure. My feeling is things may go south very quickly. The president has another deadline for Iran on Wednesday, the market is probably waiting mostly to

Bearish Breakdown in Gold After a Compression StructureI observed a clear bearish structure forming after a prior bullish move, where price created a strong upward impulse followed by a sharp rejection, indicating the presence of supply at higher levels. After this rejection, the market transitioned into a sequence of lower highs and lower lows, confirm

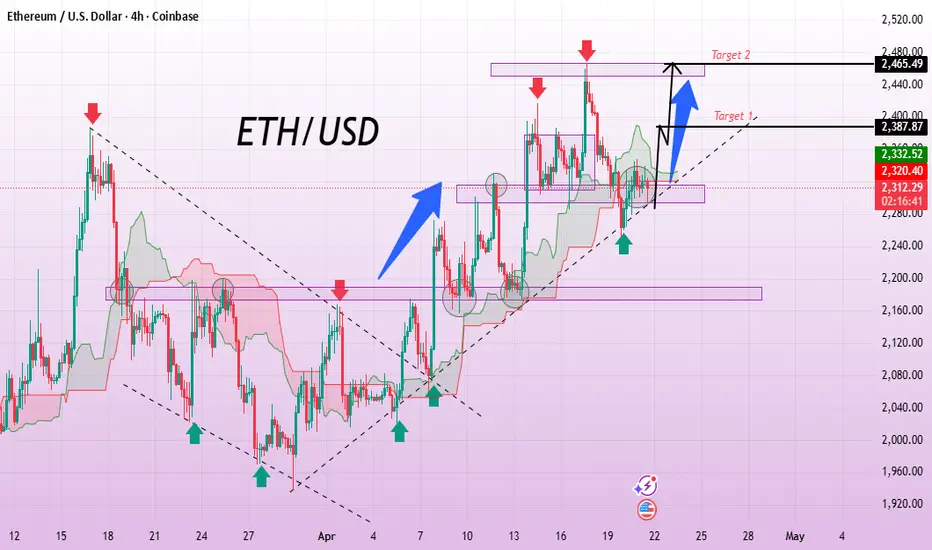
ETH/USDT: Trend Breakdown and Bearish Continuation StrategyHi!
The technical landscape has shifted decisively. While we always keep an eye on the $2,355 "breakout or bust" level, the weight of the evidence is now heavily skewed to the downside. The market has signaled a fundamental shift in character, moving from a trend of higher lows to a structural brea

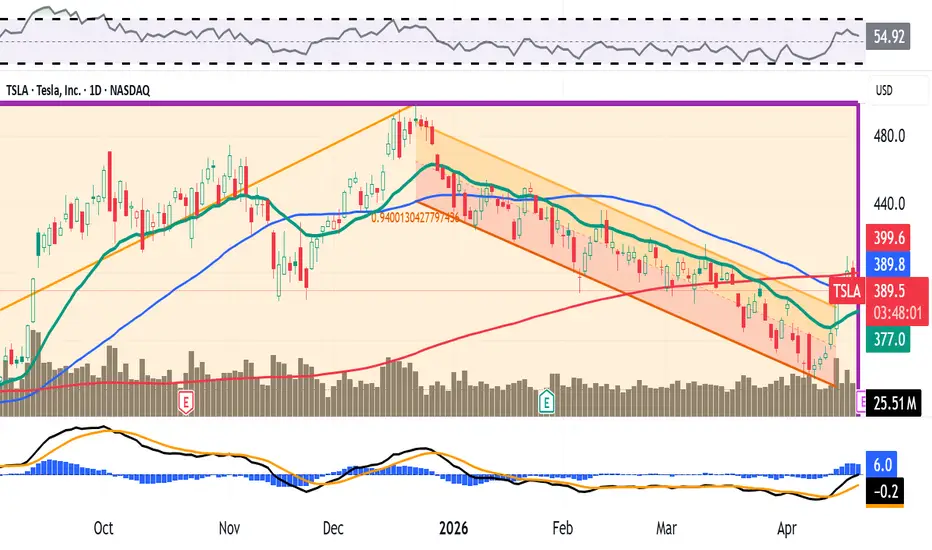
What Does Tesla's Chart Say Heading Into This Week's Earnings?Tesla NASDAQ:TSLA soared 7.6% one day last week -- its best single session in more than nine months -- and has gained some 15% in less than two weeks as the EV giant prepares to report Q1 earnings. I don't personally like when stocks run upward into earnings, but Tesla's technicals and fundamental
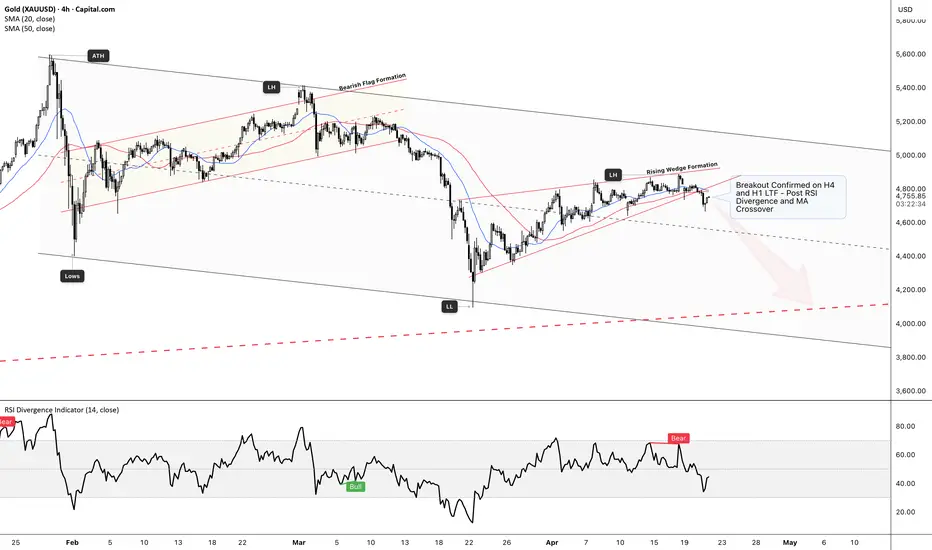
XAUUSD (Gold) – Structure Breakdown & Bearish OutlookHTF - D1 View
CAPITALCOM:GOLD is currently trading within a broader descending channel, respecting long-term bearish structure despite recent short-term bullish attempts.
On the left side of the chart, we saw a bearish flag formation form after the ATH, which led to continuation downside — set
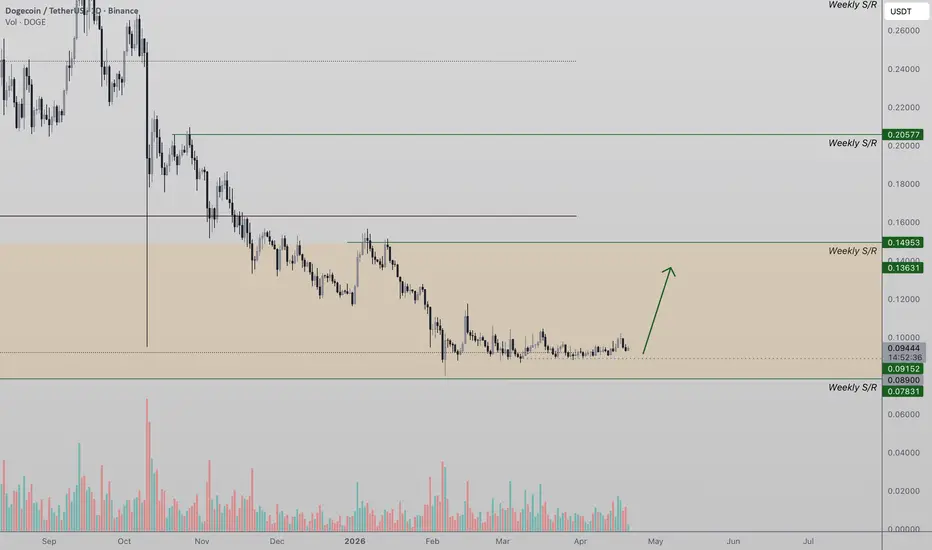
Dogecoin (DOGE) Update bullish potential Dogecoin is currently consolidating within a tight local range, signaling a potential expansion move on the horizon as volatility continues to compress.
Price action has been accompanied by declining volume, which typically precedes a breakout scenario. As the range tightens, the market is building
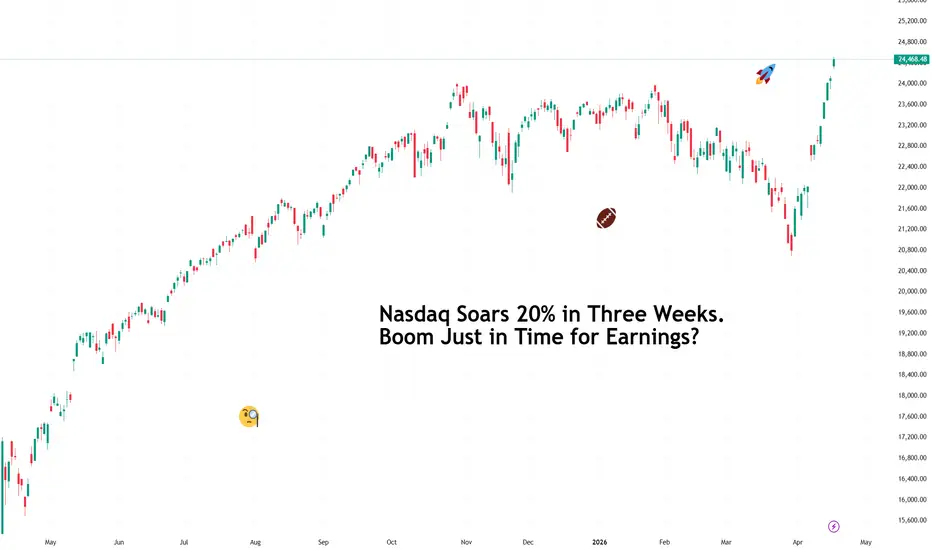
Nasdaq Soars 20% in Three Weeks. Boom Just in Time for Earnings?The tech-heavy Nasdaq Composite NASDAQ:IXIC has climbed nearly 20% from its March 30 low, delivering the fastest rebound traders have seen this year. Moves of that size usually arrive alongside strong catalysts, shifting expectations, or a sudden improvement in global mood.
This time the spark ca
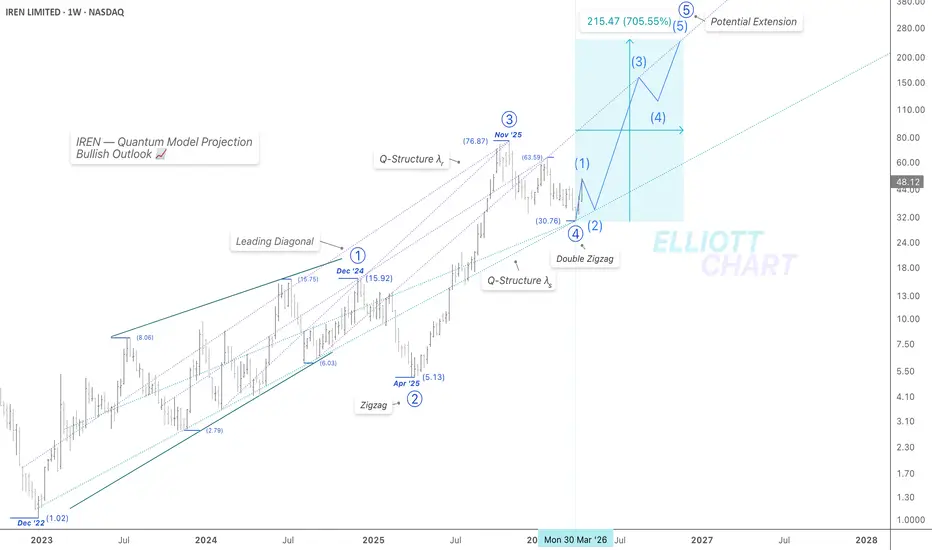
IREN | WeeklyNASDAQ:IREN — Quantum Model Projection
Bullish Outlook | Projected Extension Underway
IREN has advanced 62% since late March, firmly supported by the Q-Structure λₛ at precise confluence, as projected—reinforcing the Primary degree Extension in Wave ⓹ now underway.
Wave Analysis
This impu
See all editors' picks ideas
Focus Bars [Kioseff Trading]Hello Traders!
🔹 Focus Bars
Focus Bars is a lower-timeframe reconstruction tool designed to break each candle into a price-based internal structure .
Instead of viewing a bar as a single OHLC print, this tool redistributes intrabar participation across price levels, showing where activity, del
Pine Script® indicator

Carrier Volatility [Pumori]Carrier Volatility
This is the foundational Pulse component of the ET Massif Framework research suite.
Description
Pumori is a high-resolution volatility and impulse response tool built around an ultra-short fractional length (0.1 EMA). It is a high-frequency carrier framework that exposes the
Pine Script® indicator

Multi Timeframe Volume Profiles [TradingIQ]Hello Traders!
🔹 Multi-Timeframe Volume Profiles
Multi-Timeframe Volume Profiles is a visualization tool designed to show how volume and participation develop across multiple timeframes - all in one view.
Instead of switching between charts and trying to mentally piece together context, this to
Pine Script® indicator

CVD Profiles [TradingIQ]Hello Traders!
🔹 CVD Profiles
CVD Profiles is a profile-based order flow visualization tool designed to show how participation distributes across price levels - not just over time, but through price itself .
Think volume profile data + TPO time segmenting!
Instead of looking at cumulative delt
Pine Script® indicator

Volume Bubbles [QuantAlgo]🟢 Overview
The Volume Bubbles indicator is a multi-layered volume cluster detection system that identifies statistically significant volume events directly on your price chart, classifying them by magnitude (Small, Medium, Big) and direction (Buy, Sell, Mixed). By combining adaptive percentile t
Pine Script® indicator

Monte Carlo CT [SS]This is the Monte Carlo CT indicator.
CT stands for "central tendencies" and is the real distinguishing characteristic of this indicator against other Monte Carlo based indicators.
In statistics, Central Tendency is a single value that attempts to describe a set of data by identifying the central
Pine Script® indicator

HTF Volume Spike & Imbalance Projection [LuxAlgo]The HTF Volume Spike & Imbalance Projection indicator provides a comprehensive multi-timeframe analysis tool that projects higher timeframe (HTF) candle structures, volume spikes, and volume profiles directly onto the current chart. This script aims to bridge the gap between different time horizon
Pine Script® indicator

Swing Structure Forecast [BOSWaves]Swing Structure Forecast - Statistical Swing Projection System with Volatility-Adaptive Support and Resistance Detection
Overview
Swing Structure Forecast is a statistically-driven swing analysis system that maps directional price structure through confirmed pivot identification, where supp
Pine Script® indicator

TASC 2026.04 A Synthetic Oscillator█ Overview
This script implements a Synthetic Oscillator as presented by John F. Ehlers in the April 2026 TASC Traders' Tips article "Avoiding Whipsaw Trades". The indicator aims to provide a smooth, low-lag oscillator for timely trading signals by dynamically mapping a sine wave to price data
Pine Script® indicator

Volume Spread Analysis IQ [TradingIQ]Hello Traders!
🔹Volume Spread Analysis IQ
This indicator was most voted on for our indicator competition - so here it is! Hope you guys like it :D
Volume Spread Analysis IQ is a chart-reading tool built to help traders judge effort, result, and background context in a way that is visual and
Pine Script® indicator

See all indicators and strategies
Community trends
Microsoft - Your last buying opportunity!🎖️Microsoft ( NASDAQ:MSFT ) is now starting the bullrun:
🔎Analysis summary:
Microsoft has been correcting about -30% over the past couple of months. But at this exact moment, Microsoft is also retesting significant support. Since we already saw bullish confirmation, Microsoft is now clearly r

ONDS: Huge Ascending-Wedge-Formation, Confirmation Zones!Hello There,
welcome to my new analysis about ONDS. I am analyzing the stock from the 2-day timeframe perspective. In recent times I have spotted major bearish signs, which should not be underestimated. Especially the initial bearish pullbacks towards the downside show crucial implications that de

What Does Tesla's Chart Say Heading Into This Week's Earnings?Tesla NASDAQ:TSLA soared 7.6% one day last week -- its best single session in more than nine months -- and has gained some 15% in less than two weeks as the EV giant prepares to report Q1 earnings. I don't personally like when stocks run upward into earnings, but Tesla's technicals and fundamental
COIN – Big Base, Big Level | Base Breakout at 211 COIN has been building a massive base while most of the market was extended and chasing. That's exactly the kind of setup I want to be in right now.
BTC is pushing again. When crypto gets momentum, COIN is the leveraged play on the move. This is the stock that benefits most when the crypto trade com

Tesla Inc. Stocks & Crypto: We Are All One!What one does, the rest follows.
Tesla (TSLA) hit bottom in January 2023. It has been moving within a rising channel, higher highs and higher lows since.
Volume was moving down until December 2024. The drop in volume was the preparation for a correction. Volume has been rising and 7-April 2025 pro

PLTR Ready for a DeclineHigh-asymmetry setup on NASDAQ:PLTR just got even more extreme.
The 140 PUT is now trading around $0.30 (~$30 per contract).
If Palantir pulls back toward $130, this option could reprice toward ~$10 (~$1,000).
That completely changes the payoff profile.
Risk: 30Reward: 1000⇒RR≈33.3
You’re now

SLNH Cup and handle patternI expect a cup and handle pattern to form, with accumulation beginning when the price reaches 1.2-1.05. The stop-loss is a daily close below 1.05.
T1: 2.11
T2: 2.65
T3: 3.5
T4: 5

POET is going to $150, eventually.The ol' inverse H+S on the weekly and busting that historic trendline, this is all voodoo science anyway. But it works.

APPLE Descending Triangle got rejected on its Top.Apple (AAPL) has been trading within a Descending Triangle since the October 10 2025 Low (that formed its Support). Yesterday it marginally broke above its Top (Lower Highs trend-line) but today it got rejected.
If it holds, this is technically the pattern's new Bearish Leg. The last one hit the 1D

XomHas accumulated here at the bottom of that 145 support.
Currently at resistance of this yellow downtrend... I'm expect a breakout either tomorrow or Thursday and a move headed back to 165-170..
Stop loss below 145.00
Entry 148-150
1st target - 158 or 20sma

See all stocks ideas
Today
VRTVertiv Holdings, LLC
Actual
1.17
USD
Estimate
1.00
USD
Today
AMRXAmneal Pharmaceuticals, Inc.
Actual
0.27
USD
Estimate
0.17
USD
Today
TELTE Connectivity plc
Actual
2.73
USD
Estimate
2.69
USD
Today
ELVElevance Health, Inc.
Actual
12.58
USD
Estimate
11.03
USD
Today
OTISOtis Worldwide Corporation
Actual
0.89
USD
Estimate
0.90
USD
Today
TMHCTaylor Morrison Home Corporation
Actual
1.01
USD
Estimate
0.86
USD
Today
GEVGE Vernova Inc.
Actual
17.44
USD
Estimate
1.95
USD
Today
WABWestinghouse Air Brake Technologies Corporation
Actual
2.71
USD
Estimate
2.51
USD
See more events
Community trends
$BTC UPDATE !!CRYPTOCAP:BTC UPDATE
Price is currently compressing inside a triangle structure just below a key resistance zone. You can see multiple rejections from this area, showing sellers are active here, but at the same time, higher lows indicate buyers are still stepping in.
There is a clear liquidity c

Bitcoin - LifeTime Opportunity! (right now, watch this)I see a lifetime opportunity on the chart of Bitcoin! First, let's take a look at technical analysis. The price of Bitcoin has been inside this red bearish flag for around 10 weeks, and soon we will see either an explosive pump or a critical dump. Bitcoin has been in a pretty strong bear market sinc

BTCUSDT Trend Support Holds - Push Higher LikelyHello traders! Here’s my technical outlook based on the current BTCUSDT (4H) chart structure. BTC previously moved under a descending resistance line, confirming bearish pressure. After a breakout from this structure, price found a bottom and entered a consolidation range, signaling accumulation bef

ETH/USDT: Trend Breakdown and Bearish Continuation StrategyHi!
The technical landscape has shifted decisively. While we always keep an eye on the $2,355 "breakout or bust" level, the weight of the evidence is now heavily skewed to the downside. The market has signaled a fundamental shift in character, moving from a trend of higher lows to a structural brea
Potential Continuation in BTCUSD After Pullback in 4HI observed a bullish structure developing after a corrective phase, where price formed a strong impulsive move upward from a demand zone, creating higher highs and higher lows. Before this expansion, the market showed a brief consolidation and a final bearish push that swept liquidity below prior lo
BTC Bulls Back? Key Levels Will Decide the Next MoveBTC is approaching a decisive inflection point across both the weekly and daily structures, with price reclaiming short-term strength from the main demand zone while still trading below a critical macro supply.
On the weekly timeframe, price remains capped below the 87K sell-off zone, which has his

BTCUSDT Long: Reclaims Support – Bullish Move Toward 77KHello traders! Here’s my technical outlook based on the current BTCUSDT (2H) chart structure. Bitcoin broke out of a descending channel and shifted into an ascending channel, forming higher lows. Price reclaimed the 73,500 demand zone, confirming strong support.
Currently, price is trading within t

BNB Tests Dynamic Resistance — Weak MomentumBNB is currently approaching a key dynamic resistance zone, a level that has the potential to act as a turning point within the current market structure. Price is trading slightly above its local Point of Control (POC), but the move higher has been supported by relatively low volume, raising concern

ETHUSD Targets Higher Zones with Buyer StrengthThe ETH/USD chart reflects a clear transition from a bearish phase into a developing bullish trend 📉➡️📈. Initially, price respected a descending channel, forming lower highs and indicating sustained selling pressure. However, a breakout above this structure marked a significant shift in momentum, su
Bitcoin After the Rally — Is a Bigger Drop Loading?Last week, as investor optimism rose, especially alongside the stock market and the S&P 500 ( FX:SPX500 ), Bitcoin ( BINANCE:BTCUSDT ) didn’t miss out on the rally, reaching around $78,600. However, over the weekend, Bitcoin began to decline. One reason is the possibility of renewed military tensi

See all crypto ideas
XAU/USD – Temporary Dip Before a Stronger Rally?Gold is pulling back, but in my view, this decline looks temporary rather than a true bearish reversal. The recent weakness is largely driven by a stronger U.S. dollar, higher Treasury yields, fading expectations of Fed rate cuts, and short-term profit-taking after the previous move up. In other wor

Gold Testing Mid-Fibonacci Zone Below ResistanceGold is currently trading near the 0.5–0.618 Fibonacci retracement zone, reacting below a key resistance area while maintaining bullish structure above the order block.
If price holds above the 4,736–4,760 order block support, buyers may regain momentum and push toward the 4,890 weekly high resista

XAUUSD – Price Action & Structure Outlook📊 XAUUSD – Price Action & Structure Outlook
🔍 Market Overview
Gold has recently transitioned from a consolidation phase into a more structured upward movement, signaling early signs of accumulation. The market has established a stable base, from which price is now attempting to expand higher.
The

XAU/USD | Gold Fills Gap – Market Back at Decision Zone!By analyzing the #Gold chart on the 4H timeframe, we can see that price behaved exactly as expected. After tapping the $4893 supply, Gold completed more than 900 pips of return and then entered a correction phase, closing the week around $4832.
With the new session open, price dropped sharply to $4

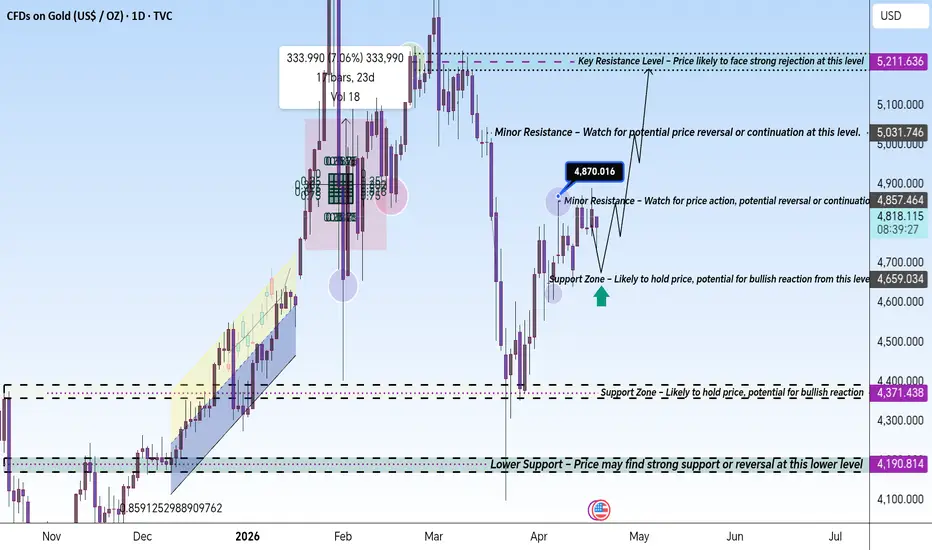
Gold Price Analysis – Key Resistance, Support Levels, and Trend This chart presents a detailed technical analysis of Gold (XAU/USD), emphasizing key support and resistance zones. The Key Resistance at 5,211.636 USD represents a strong level where the price is likely to face significant rejection, while Minor Resistance at 4,870.016 USD may lead to a potential pr
Wedge Breakdown Shifts Focus Lower XAUUSD — Wedge Breakdown Shifts Focus Lower as Iran Deadline Risk and Warsh Headlines Harden the Macro Backdrop
XAUUSD has now moved out of the prior rising wedge to the downside, and that technical break is occurring at a sensitive macro moment. The chart is no longer dealing with a simple correc

Gold - Bears taking over control?Gold is currently approaching a key decision point after a strong recovery from the lows. While the short-term structure has been bullish, price is now running into higher timeframe resistance, where reactions are starting to appear. This suggests that momentum is slowing and the market could be pre
GOLD - A pullback before an upward move FX:XAUUSD is forming a long squeeze at a key support zone and recovering from yesterday’s decline. The rise from the local low amounted to 2.5%. Before the rally continues, a pullback to 4738 is possible as traders seek liquidity.
Trump unilaterally extended the ceasefire, giving the dollar a tem

XAU/USD | Close the gap, what next? (READ THE CAPTION)As you can see in the 4H chart of Gold, it reached the high of 4891 last week and then closed at 4831, and today it opened at 4774 which is a rather big gap, and then it dropped to 4736 before bouncing back up and currently is being traded at 4820, which is above the April 20th NWOG C.E.. This huge
Hellena | GOLD (4H): LONG to 5000 area.Colleagues, I think we can tweak the previous idea a bit.
The plan is exactly the same as before—the target is 5,000. The price has gotten a bit stuck in consolidation, but I believe the 5,000 mark will be reached.
This is Wave 1 of the intermediate order and Wave 5 of the minor order in an upward

See all futures ideas
22.04.26 Daily ForecastPairs on Watch -
FX:EURJPY : This pair in line with the JP225 is still looking bullish and we have a clear target to aim for with a gap being left at the high. I will be looking for a small insurance entry here to mitigate trying to catch a falling knife with the current nature of price. Once we

GBPUSD Monthly CLS - Big Short + COT Hi Friends, New CLS Range has been created and Im looking for Short Model 1 trade setup. As always after the manipulation in to the Key Level, above the CLS range and reaction, we need to see a confirmation switch from the manipulation phase - CIOD (change in order flow) in the the expansion.
⏳

USD/JPY | NWOGs awaiting Ninja! (READ THE CAPTION)As you can see in the 4H chart of USDJPY we can see that after dropping to the 158.55 level, it bounced back up and closed inside the April 20th NWOG and then started going higher and reached 159.25, just below the March 23rd NWOG Low, and then dropped, currently being traded at 159.13.
I expect US

EURUSD: Forms Triangle Pattern - Signals Potential PullbackHello everyone, here is my breakdown of the current EURUSD setup.
Market Analysis
EURUSD previously traded inside a range, showing consolidation before a strong breakdown, confirming bearish pressure. After the drop, price continued inside a descending channel. Later, the market found a bottom an

EURUSD Consolidation bearish stepped in aggressively.EUR/USD is showing downside reaction mainly due to a combination of technical rejection and underlying dollar strength.
Tecnically , price was moving inside an ascending channel and recently pushed into a strong supply/resistance zone around 1.1800–1.1820. That area previously acted as a distributi

CHF/JPY Bullish Rectangle Pattern (22.04.2026)CHFJPY Bullish Rectangle Pattern | Breakout Setup Toward 204.83 & 205.32
CHFJPY is currently forming a bullish rectangle pattern on the 30-minute chart , showing a healthy consolidation after a strong upward move. Price is holding above the cloud support zone, which keeps the bullish structure int

GBPUSD is showing a bearish trend 📉 GBPUSD MARKET UPDATE ₿🔥
GBPUSD is showing a bearish trend with sellers defending the key resistance area 💪📊
📍 Entry Zone: Sell on pullbacks near resistance with confirmation
🎯 Technical Targets:
🥇 1st Target: 1.35300
🥈 2nd Target: 1.35000
🥉 3rd Target: 1.34800
⏰ Time Frame: 1 Hour Chart
📊 Mome

CAD/JPY: Intraday Bullish MoveWe saw a breakout of daily horizontal resistance on 📈CADJPY.
Following this violation, the market initiated a correction within a contracting wedge pattern.
The violation of the wedge pattern's resistance line has re-established bullish market sentiment.
We anticipate that bullish price movement m

USDJPYHello Traders! 👋
What are your thoughts on USDJPY?
On the 8-hour chart, USD/JPY is exhibiting a well-defined bearish structure in the medium term. After several failed attempts to break and hold above the 160.000 psychological resistance level, price action is now signaling a shift toward a bearish

Short-Term Weakness After Failed Recovery in GBPUSDI observed a short-term bearish structure forming after a recovery move, where price failed to sustain higher levels and started creating lower highs. The market initially showed a bullish reaction from the lows, but this move lacked continuation and ran into resistance, forming a supply zone. From

See all forex ideas
Trade directly on Supercharts through our supported, fully-verified, and user-reviewed brokers.


