
Dashboards & Reports
Always know how you’re performing
Visualize your performance in one place, then ask AI what’s driving it and what to do next.
Trusted by 20,000+ teams worldwide








From scattered data to one clear view of performance
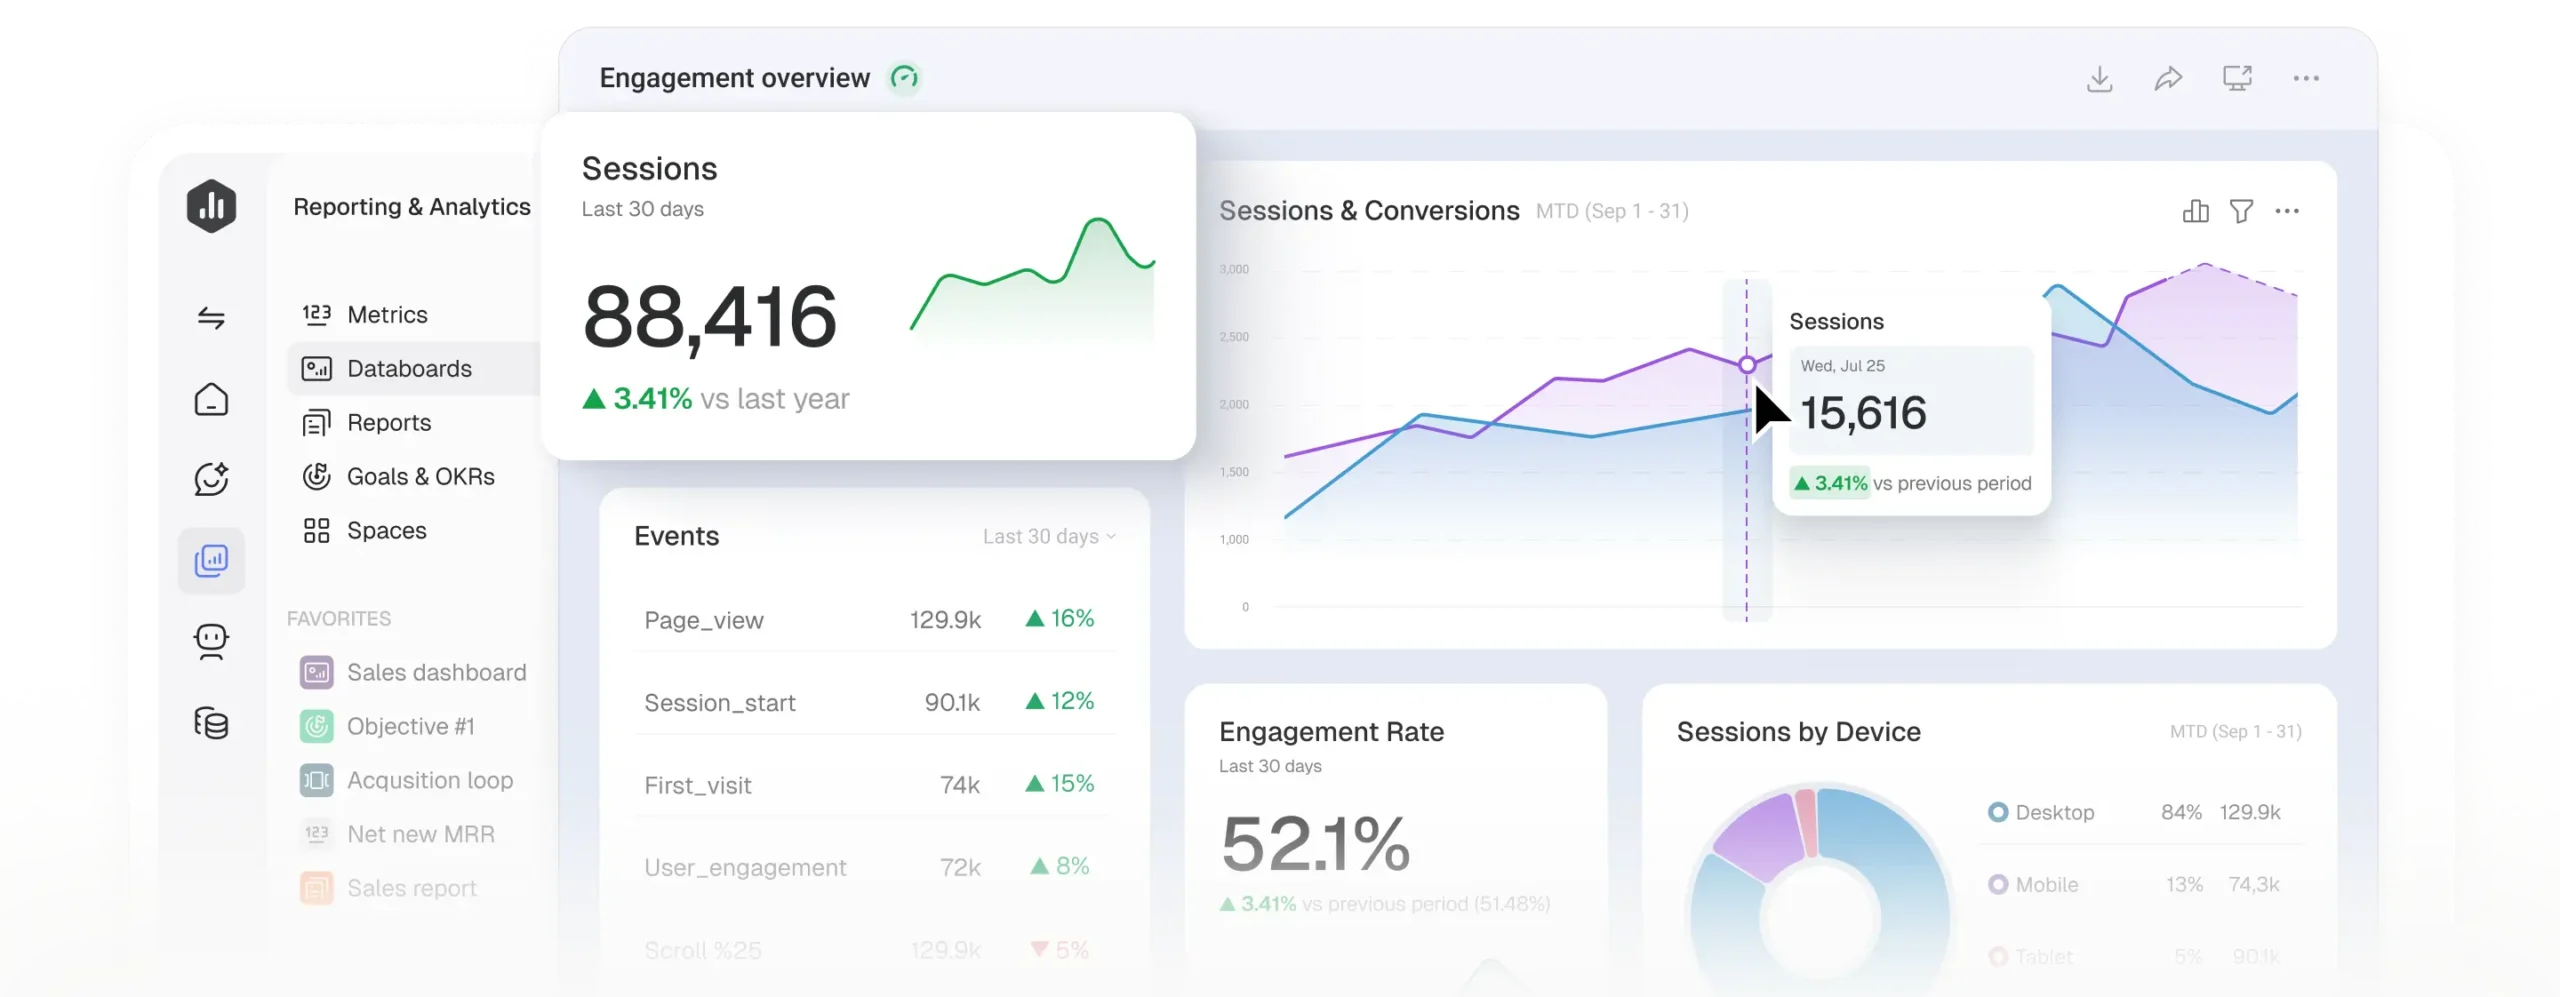
Your numbers live in ten different tools. Databox dashboards pull them into one live view. Pick any visualization, filter by dimensions, see performance in real-time, and share it with anyone who needs to see it.

How JARS Digital saved 10-15 hours a month on reporting
“I think it’s safe to say Databox easily saved us 10 to 15 hours a month on reporting. If you quantify that in terms of salary, that’s like a quarter of someone’s annual salary we saved.”
 Jason Spooner
President and Founder, JARS Digital
Jason Spooner
President and Founder, JARS Digital
Dashboard designer
Build any dashboard, without code
Go from connected data to a dashboard your team understands at a glance, in minutes.
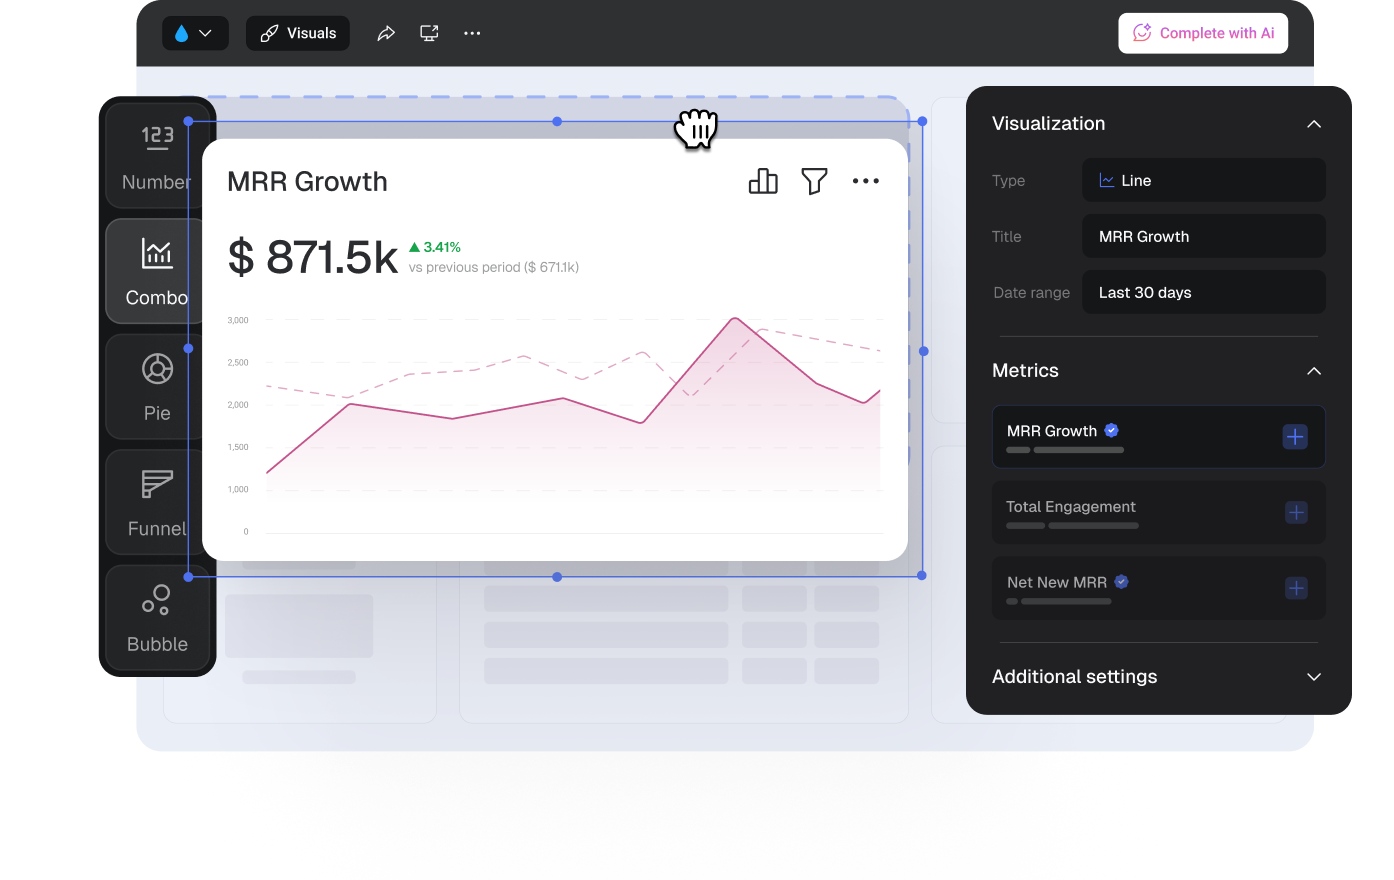
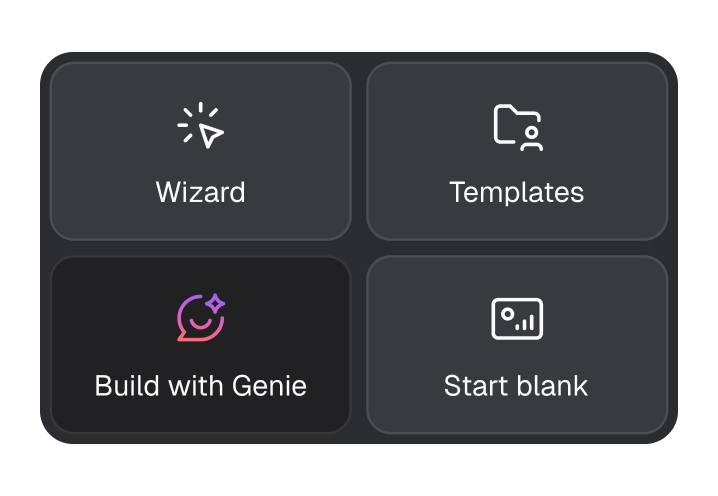
Built in seconds
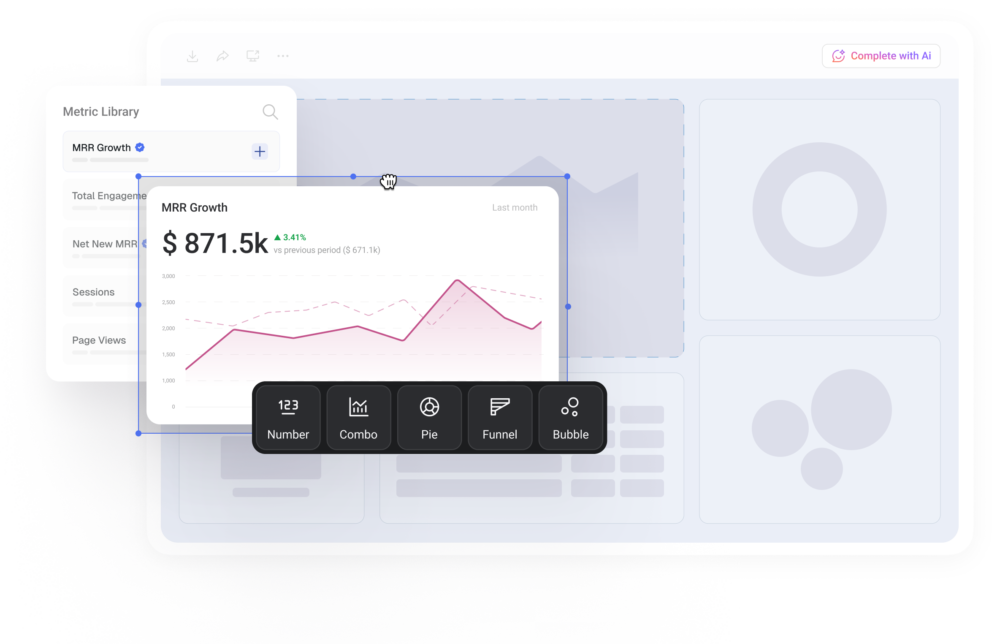
Ask your AI Analyst to build it, start from a template, or drag your metrics onto the dashboard canvas. Then arrange, resize, and format everything in a few clicks.
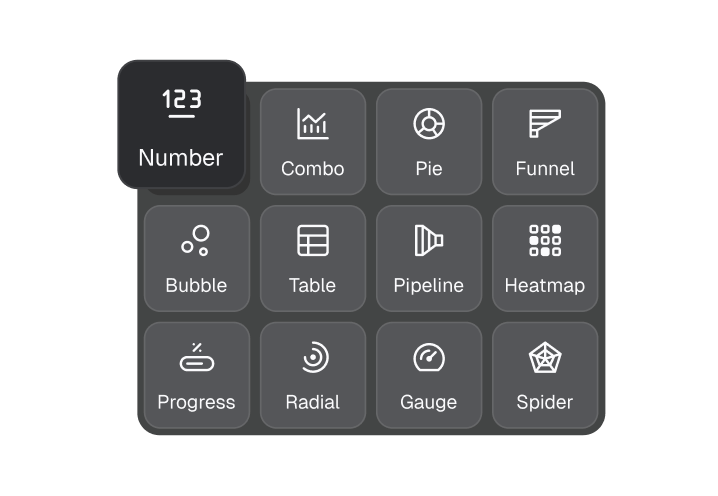
Flexible visualizations
Pick the chart that makes each metric obvious. Toggle between visualizations in one click until the story is clear.
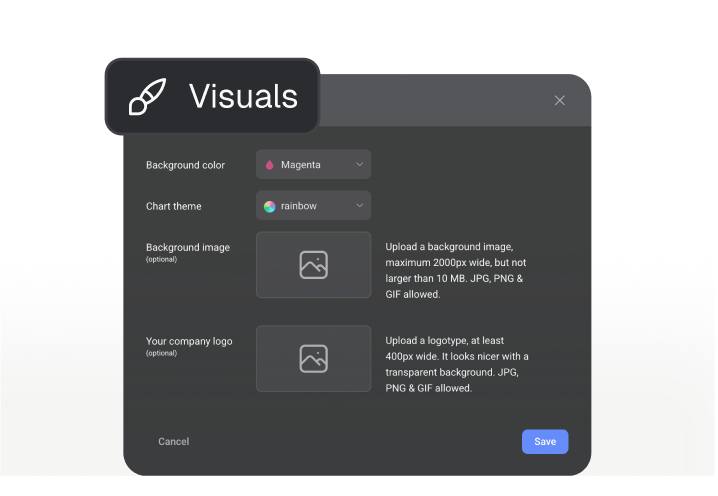
Customizable branding
Add your colors, logo, and background, so every dashboard matches your brand. Or go fully white-label with our add-on when you share with clients.
Analyze
Explore the story behind every number
Follow any metric down to the detail that explains it, so you know not just that performance changed but exactly where to act.
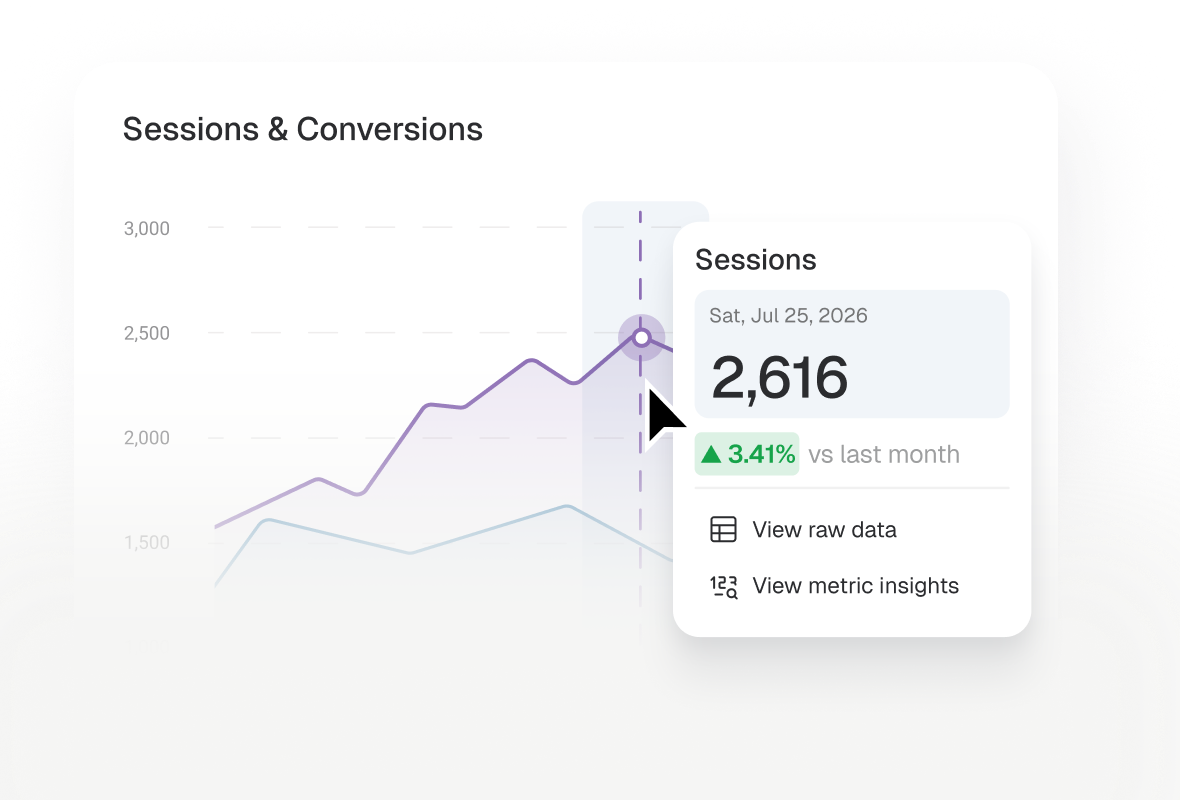
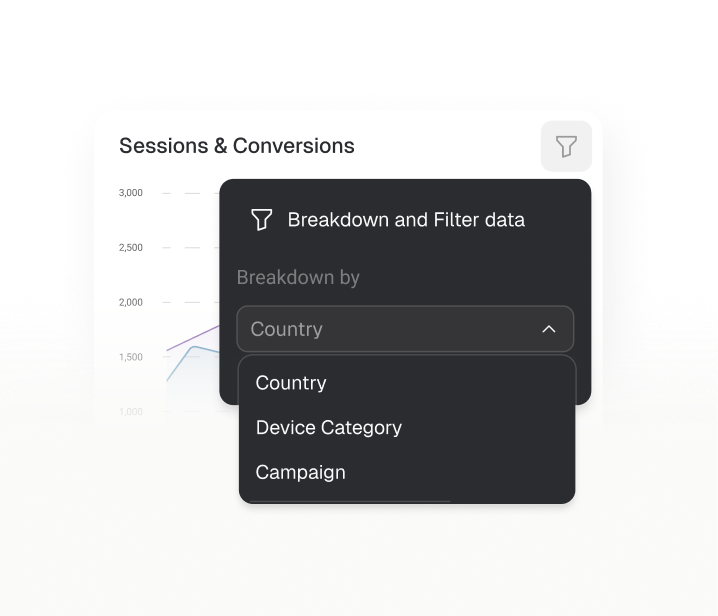
Filter and break down by dimension
Break any dashboard down by campaign, channel, or segment in one click.
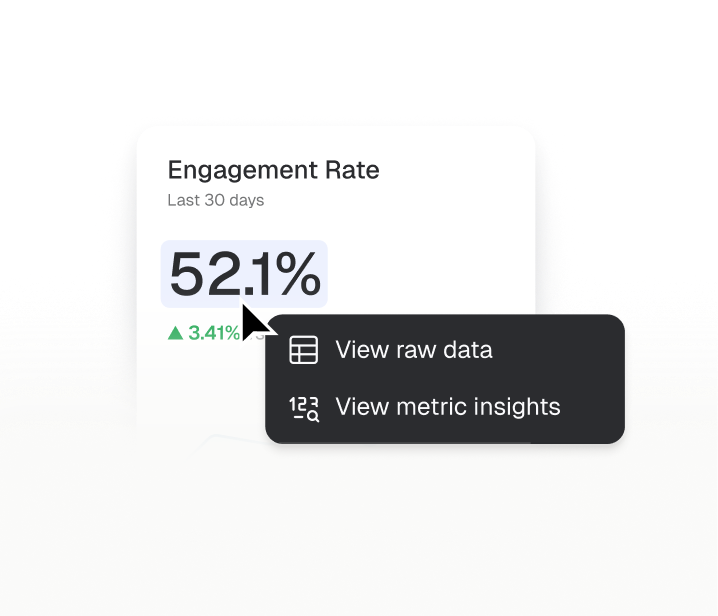
Drill down to the detail
Click any metric built from a dataset to see the individual records behind the number.
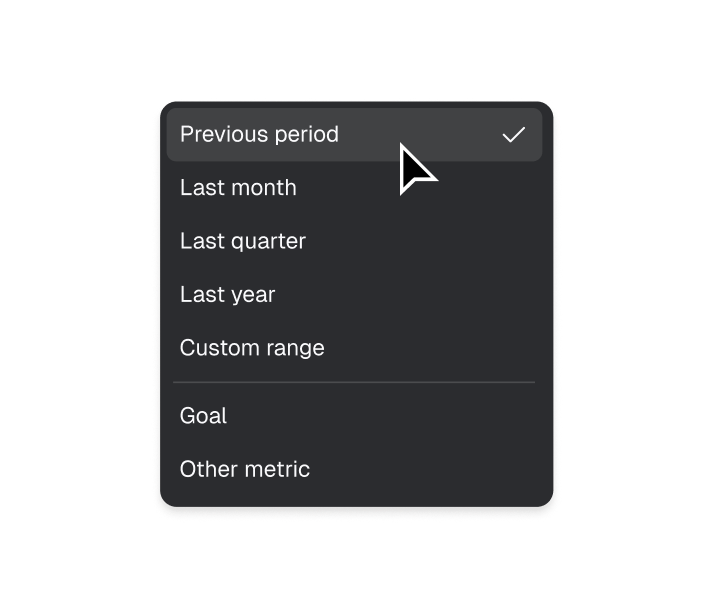
Compare periods
Check performance against last month, last quarter, or last year, side by side.
Share
Share performance with anyone
Get the right view in front of your team, your leadership, and your clients, wherever they already are.
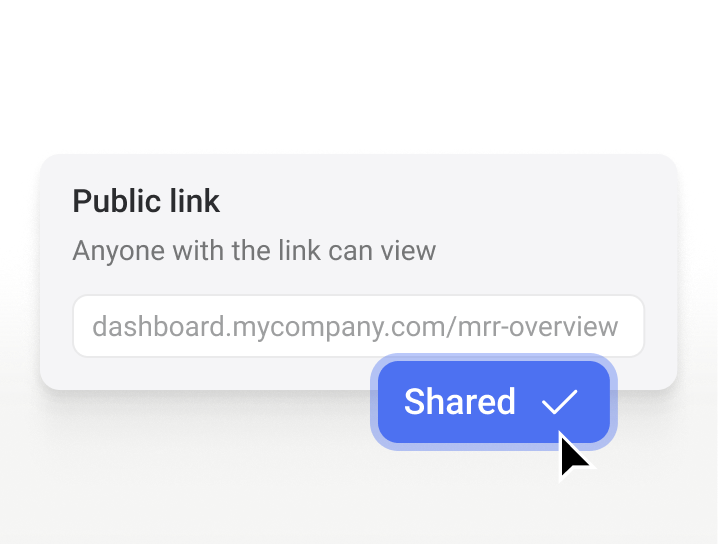
Share a link
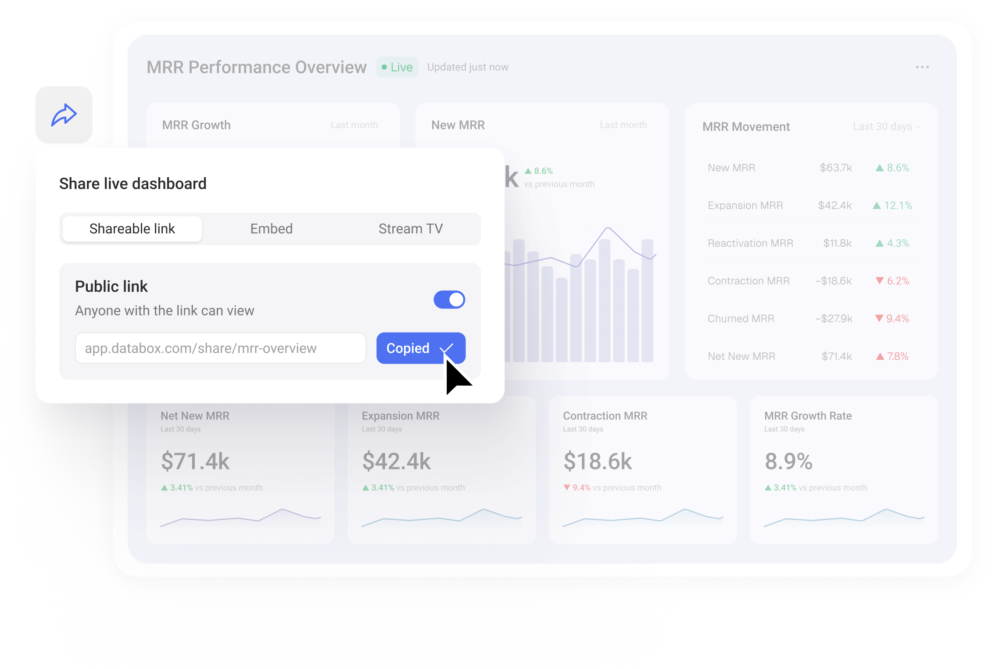
Share a live dashboard through a single link that always shows current data, no login required.
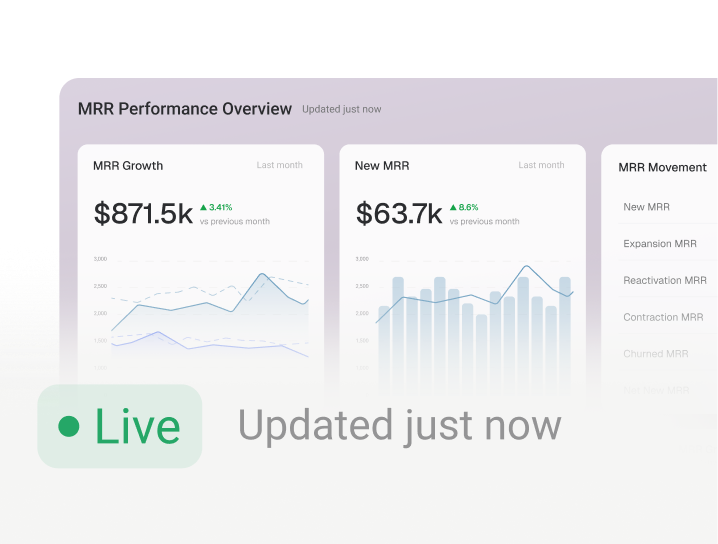
Stream to TV
Cast any dashboard to a smart TV in the office, so performance stays visible to the whole team.
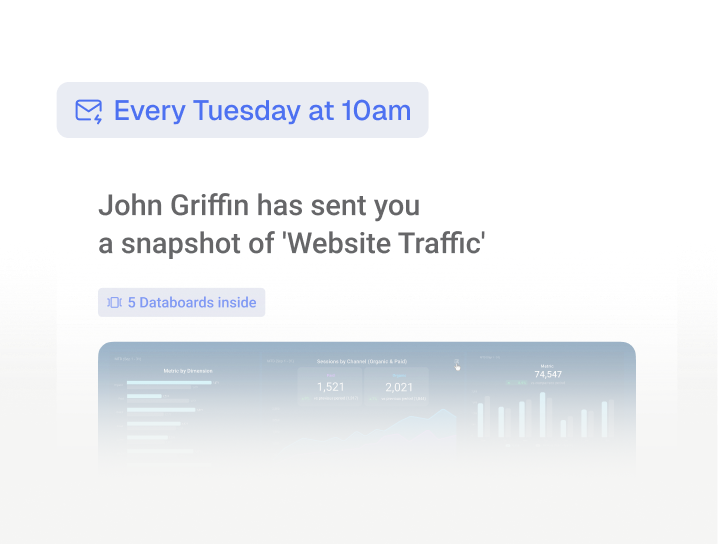
Schedule a snapshot
Send a PDF or image of any dashboard to email or Slack, automatically, on your schedule.
Unlock more insights
An AI Analyst that works with you
Every Databox plan comes with an AI Analyst built in. It answers your questions, builds dashboards for you, and helps you decide what to do next, all in plain language.
Build
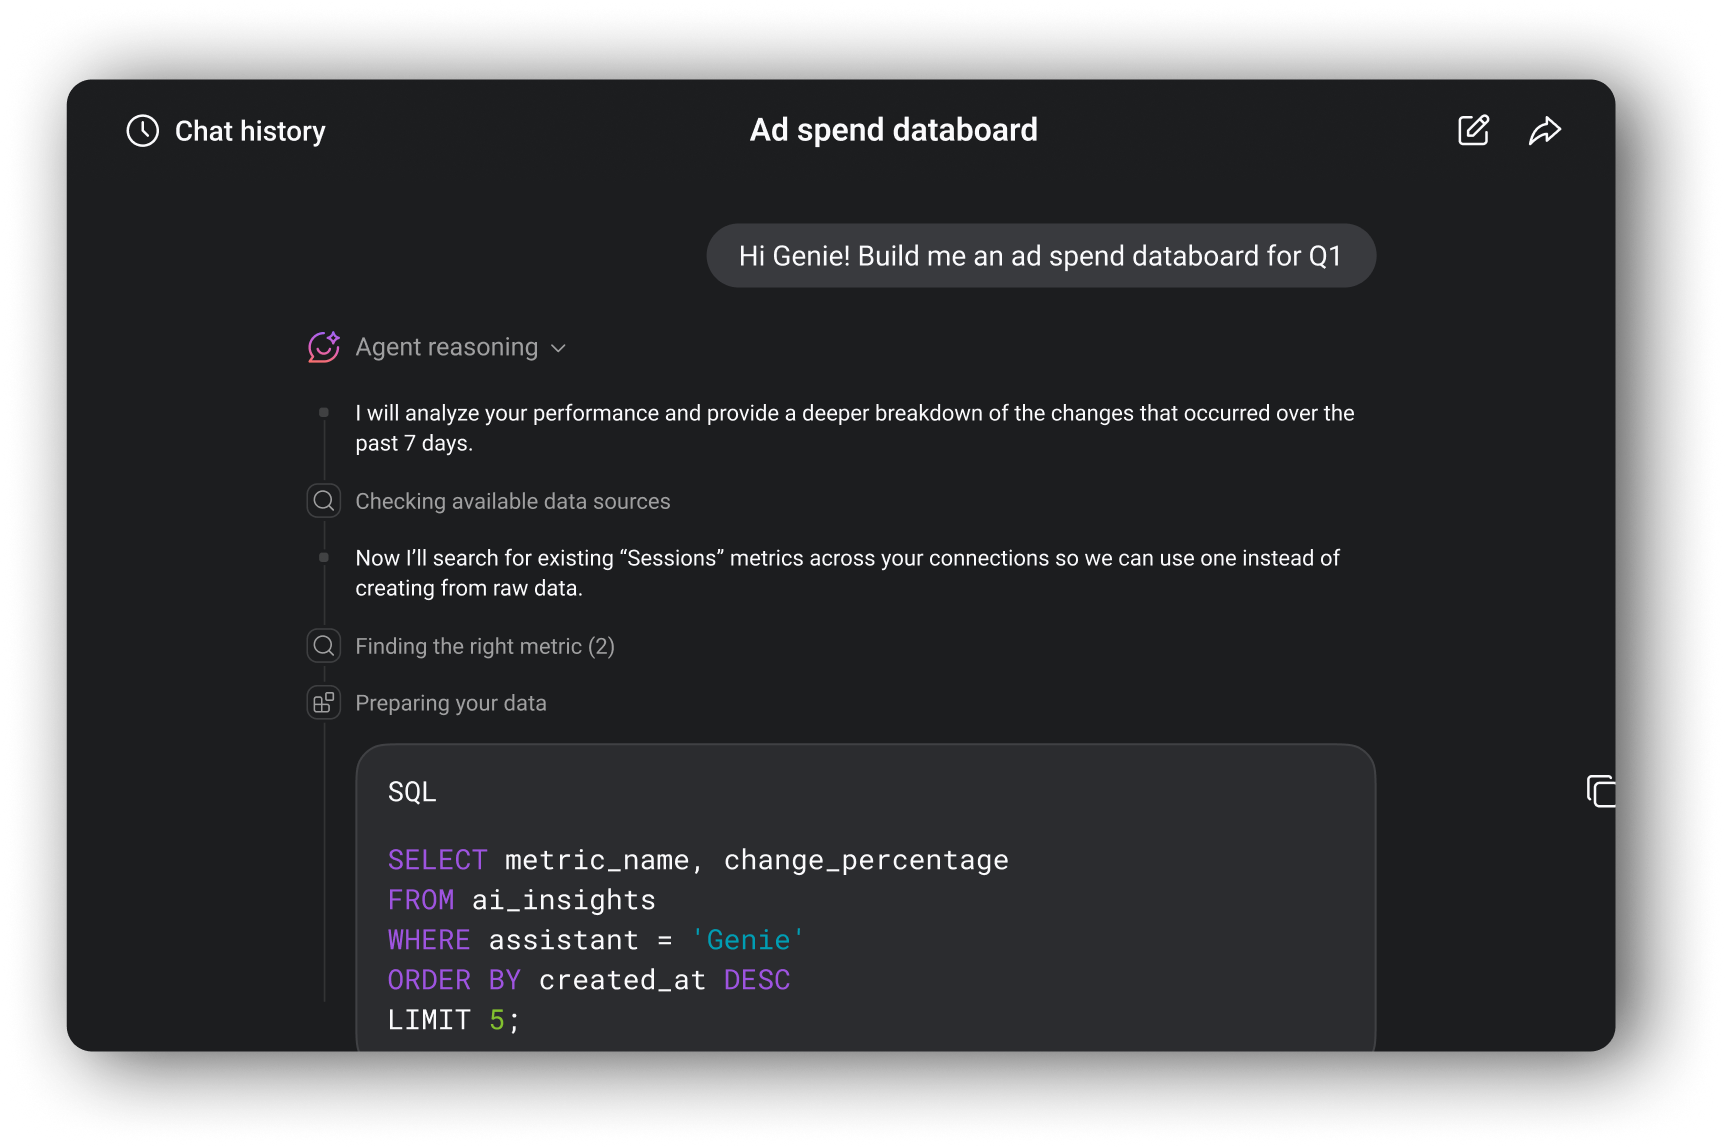
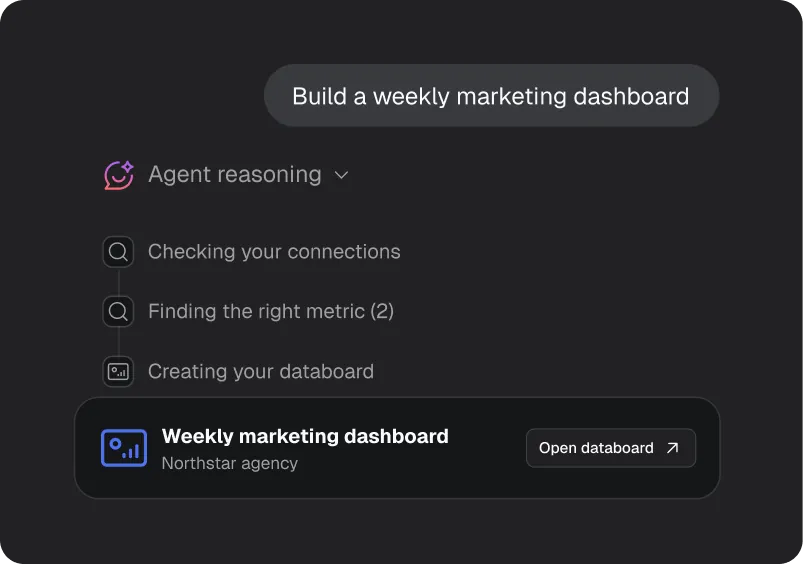
Describe what you want
Describe the dashboard you want and your AI Analyst picks the metrics and builds it for you, so you skip the point-and-click work.
Analyze
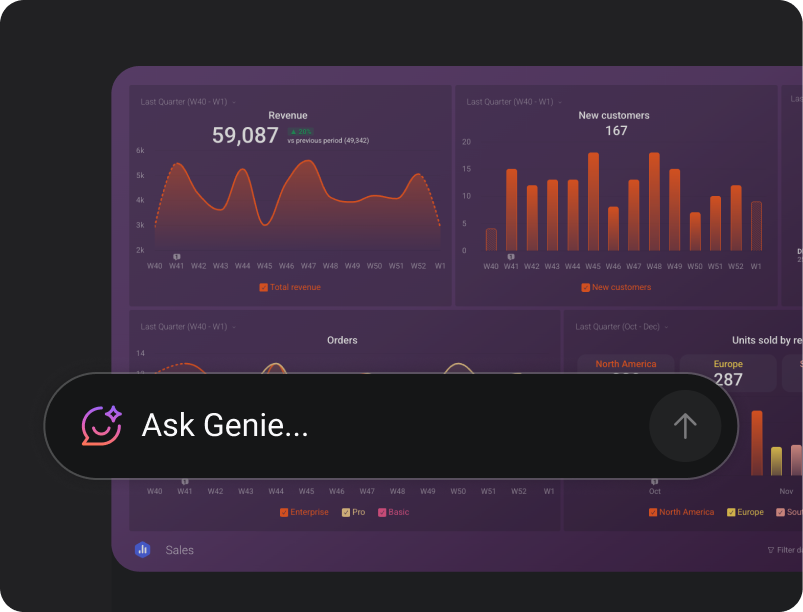
Ask for more context
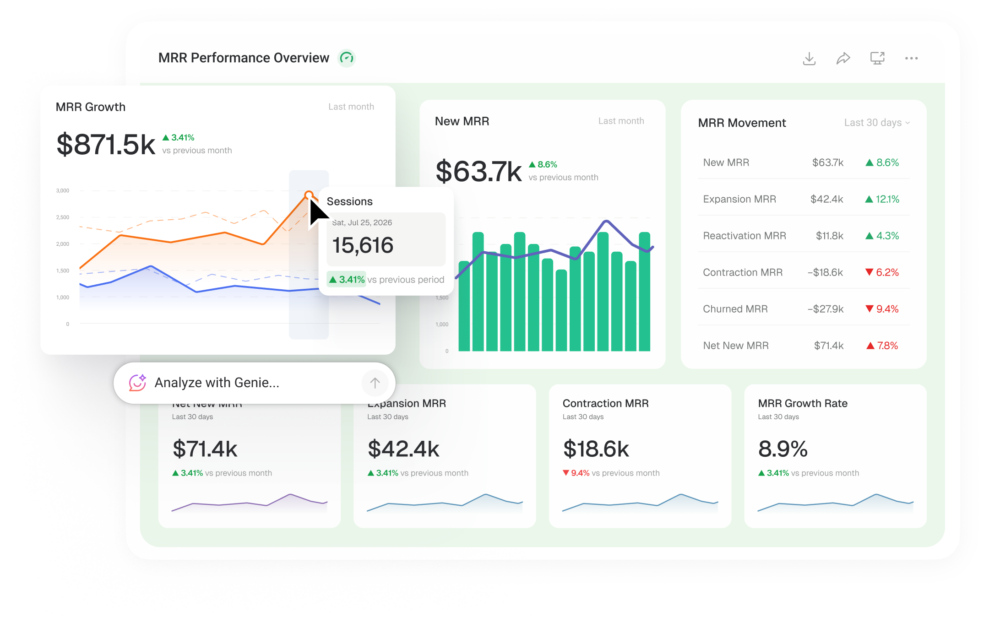
Dig deeper by asking your AI Analyst to explain what's going on with the data on any dashboard.
Decide
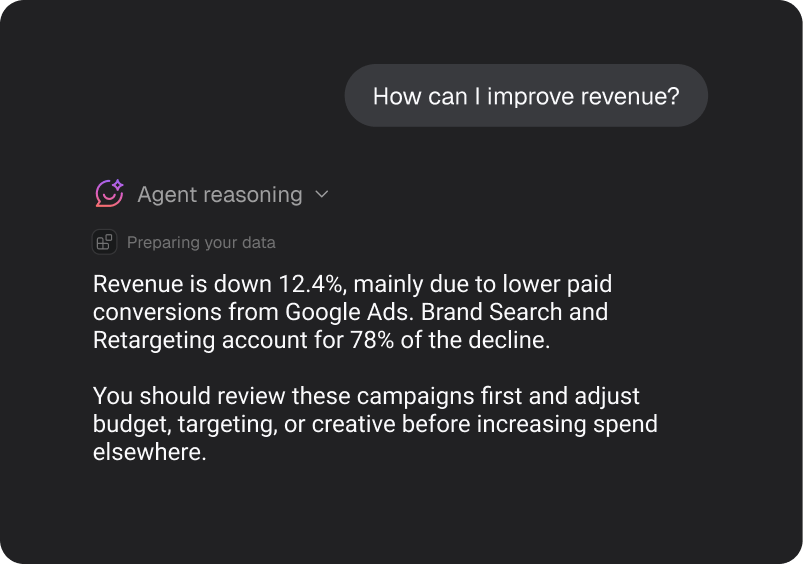
Know what to do next
Your AI Analyst interprets data across multiple sources, surfaces what changed, and tells you what to do next.
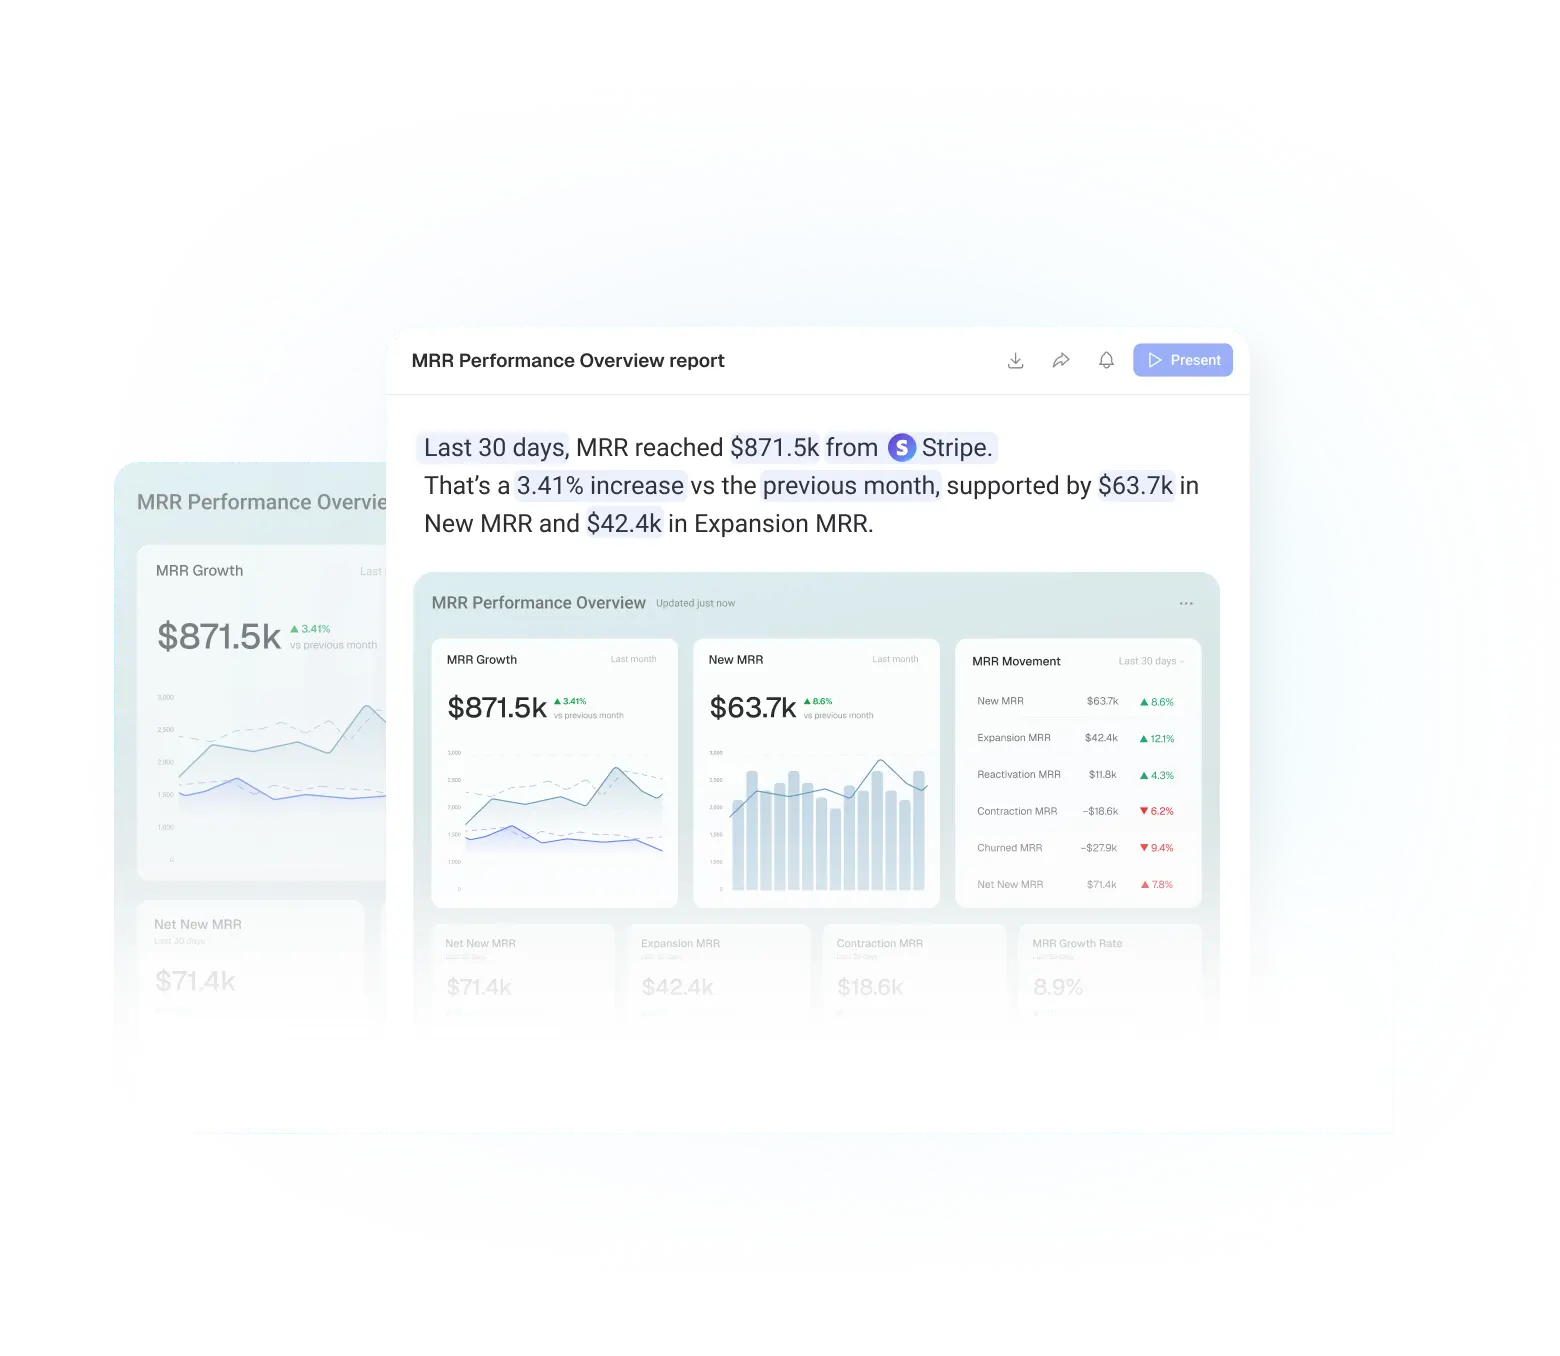
Turn your dashboards into a report worth reading
Combine the dashboards you track into one report, add the narrative of what changed and why, and send it on a schedule, so leadership and clients get a recap they actually read.
Start from a template, not a blank canvas
Browse hundreds of prebuilt templates for marketing, sales, finance, and more.
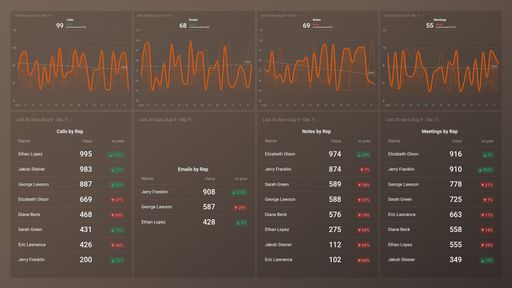 HubSpot CRM Sales Rep Activity
Learn more
HubSpot CRM Sales Rep Activity
Learn more
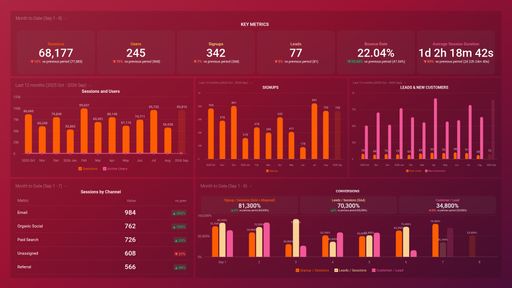 SaaS Marketing Dashboard (CMO)
Learn more
SaaS Marketing Dashboard (CMO)
Learn more
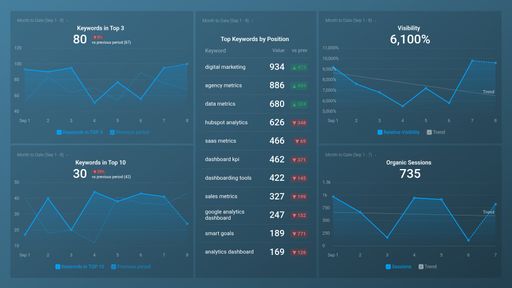 Semrush SEO Keyword Performance
Learn more
Semrush SEO Keyword Performance
Learn more
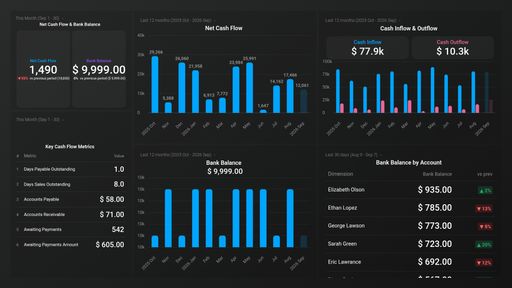 Xero Cash Flow Overview
Learn more
Xero Cash Flow Overview
Learn more
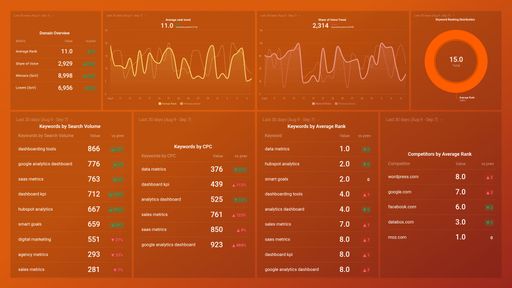 AccuRanker Domain Overview
Learn more
AccuRanker Domain Overview
Learn more
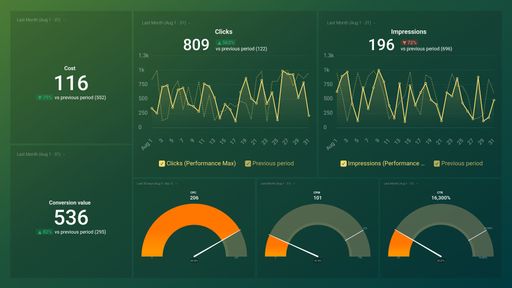 Google Ads (Performance Max) Overview
Learn more
Google Ads (Performance Max) Overview
Learn more
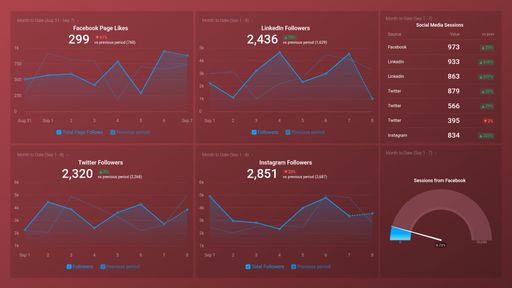 Social Media (Awareness & Engagement)
Learn more
Social Media (Awareness & Engagement)
Learn more
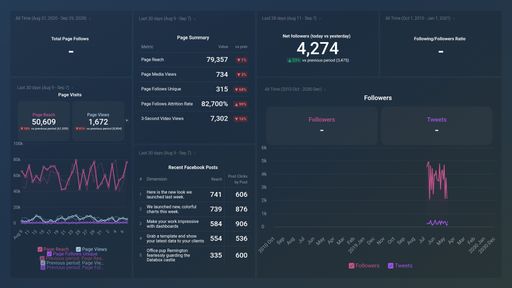 Facebook & X (Twitter) Performance Overview
Learn more
Facebook & X (Twitter) Performance Overview
Learn more
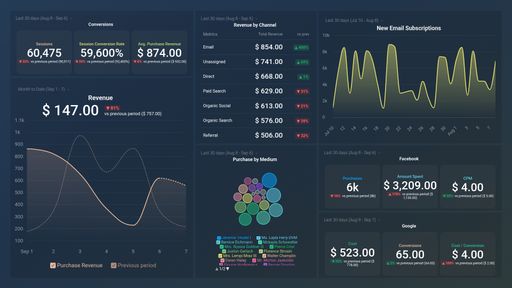 Google & Facebook Ecommerce Funnel
Learn more
Google & Facebook Ecommerce Funnel
Learn more
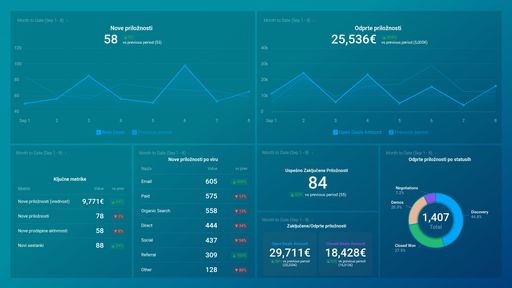 Intrix CRM (sales)
Learn more
Intrix CRM (sales)
Learn more
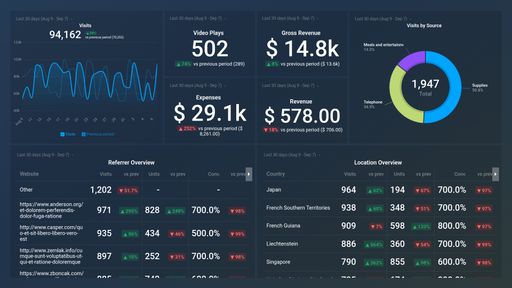 Vimeo OTT: Traffic Overview
Learn more
Vimeo OTT: Traffic Overview
Learn more
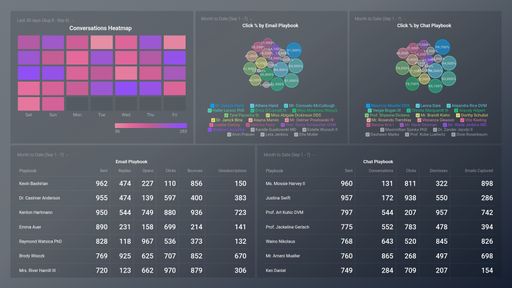 Drift Chat & Email Conversations
Learn more
Drift Chat & Email Conversations
Learn more
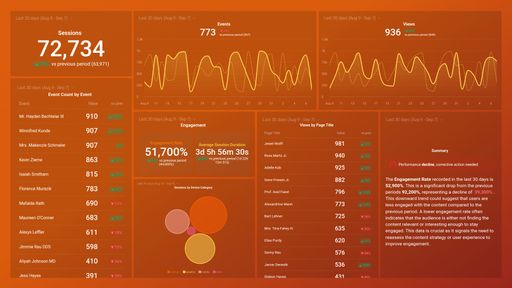 Website Engagement Overview
Learn more
Website Engagement Overview
Learn more
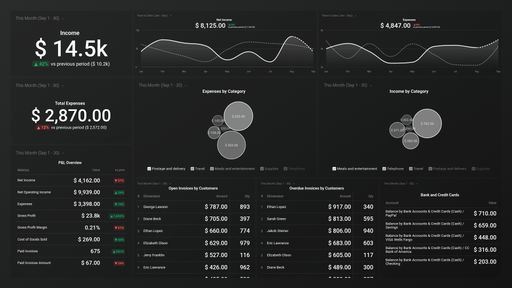 Quickbooks Income & Expenses Cash Overview
Learn more
Quickbooks Income & Expenses Cash Overview
Learn more
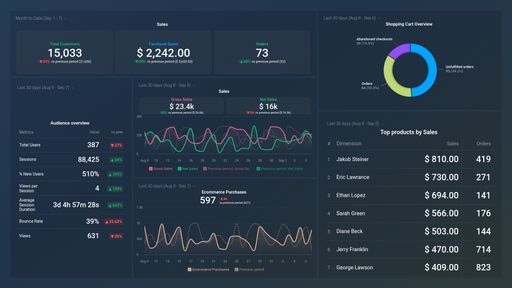 Shopify, Facebook & Google Analytics 4 Online Sales
Learn more
Shopify, Facebook & Google Analytics 4 Online Sales
Learn more
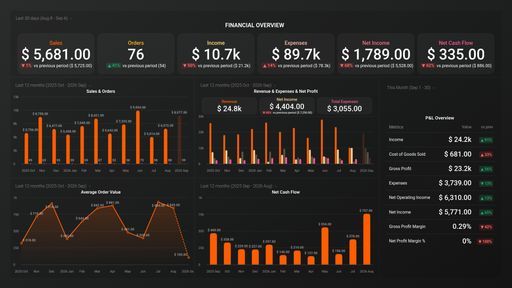 E-commerce Financial Dashboard (BigCommerce + QuickBooks)
Learn more
E-commerce Financial Dashboard (BigCommerce + QuickBooks)
Learn more
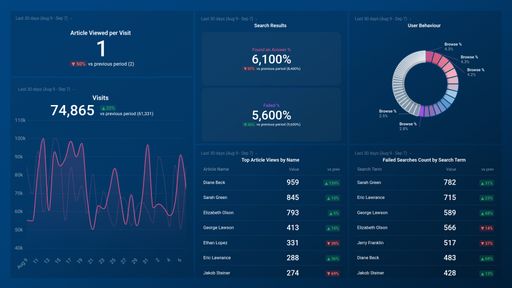 HelpScout Docs Report
Learn more
HelpScout Docs Report
Learn more
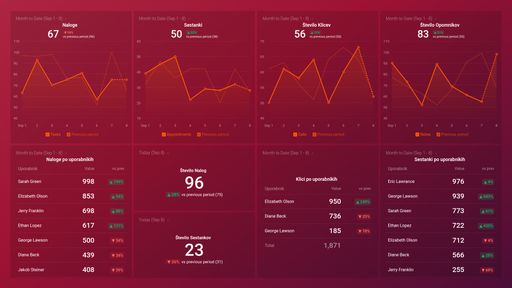 Intrix CRM (users)
Learn more
Intrix CRM (users)
Learn more
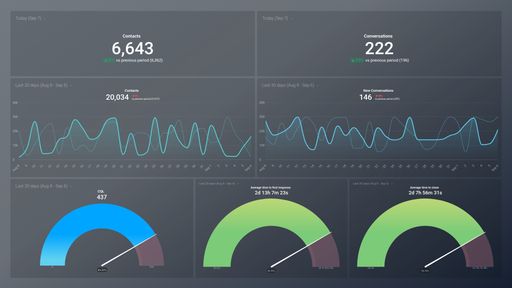 Drift Contacts & Conversations
Learn more
Drift Contacts & Conversations
Learn more
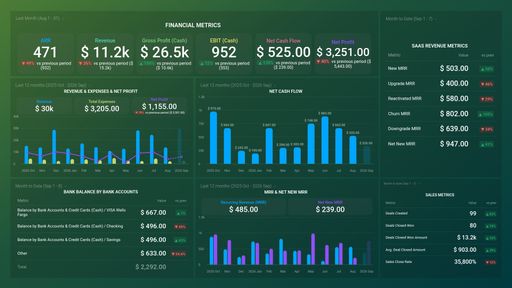 SaaS Financial Dashboard (Profitwell + QuickBooks + HubSpot)
Learn more
SaaS Financial Dashboard (Profitwell + QuickBooks + HubSpot)
Learn more
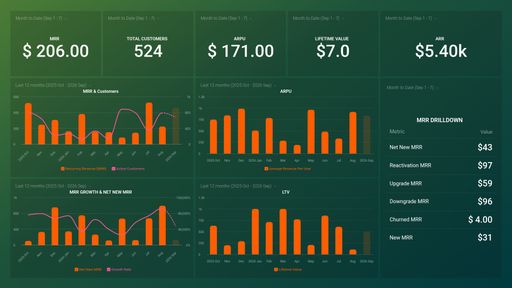 SaaS Key Revenue Metrics – Profitwell
Learn more
SaaS Key Revenue Metrics – Profitwell
Learn more
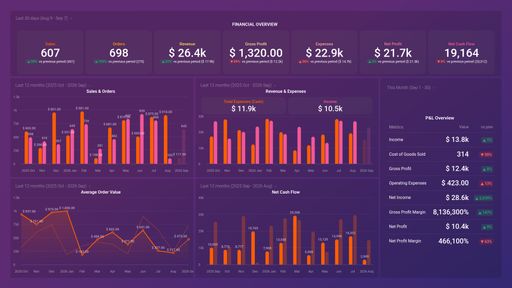 E-commerce Financial Dashboard (WooCommerce + Xero)
Learn more
E-commerce Financial Dashboard (WooCommerce + Xero)
Learn more
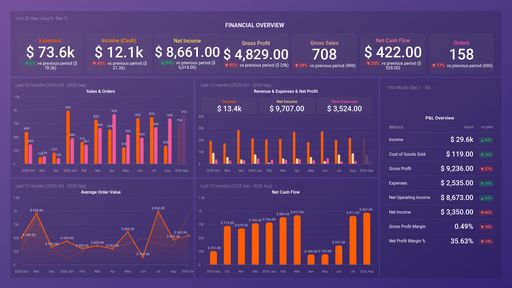 E-commerce Financial Dashboard (WooCommerce + QuickBooks)
Learn more
E-commerce Financial Dashboard (WooCommerce + QuickBooks)
Learn more
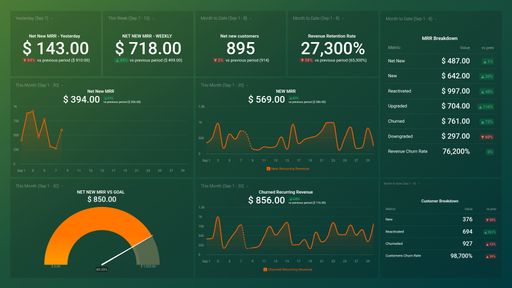 SaaS MRR Growth – Profitwell
Learn more
SaaS MRR Growth – Profitwell
Learn more
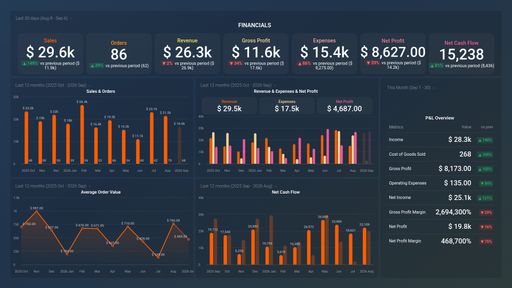 E-commerce Financial Dashboard (Shopify + Xero)
Learn more
E-commerce Financial Dashboard (Shopify + Xero)
Learn more
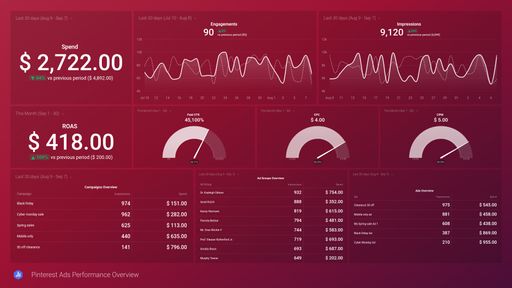 Pinterest Ads Performance Overview
Learn more
Pinterest Ads Performance Overview
Learn more
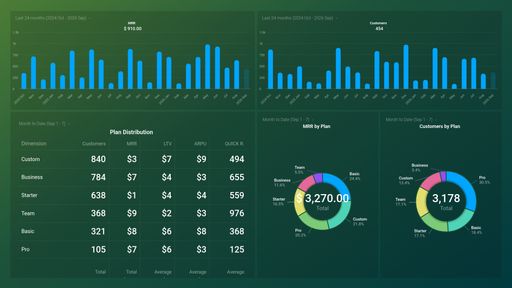 ProfitWell Revenue and Customer Overview
Learn more
ProfitWell Revenue and Customer Overview
Learn more
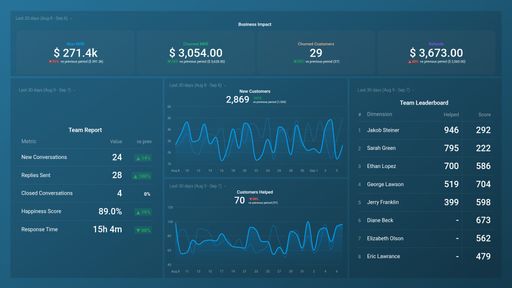 Customer Success Dashboard
Learn more
Customer Success Dashboard
Learn more
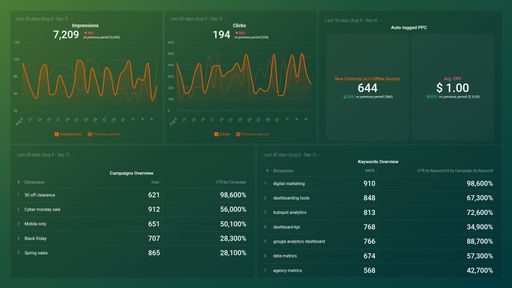 Google AdWords Monthly Performance
Learn more
Google AdWords Monthly Performance
Learn more
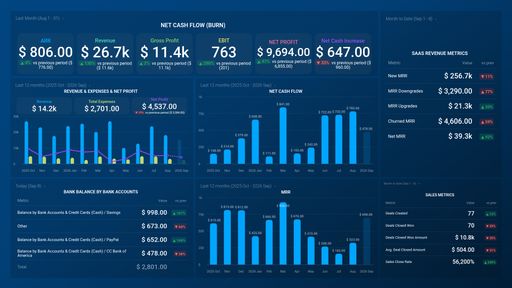 SaaS Financial Dashboard (Stripe + QuickBooks + HubSpot)
Learn more
SaaS Financial Dashboard (Stripe + QuickBooks + HubSpot)
Learn more
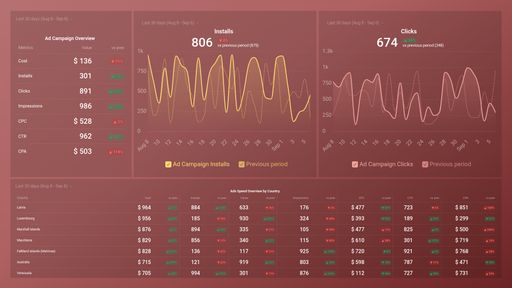 Appfigures Ad Campaign Performance
Learn more
Appfigures Ad Campaign Performance
Learn more
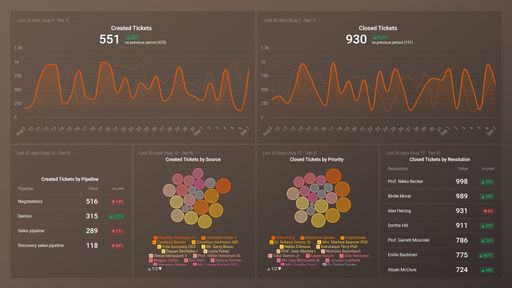 HubSpot Service Tickets Overview
Learn more
HubSpot Service Tickets Overview
Learn more
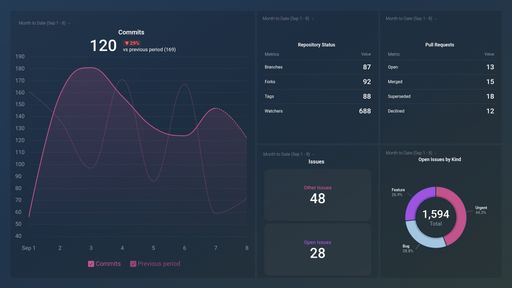 Bitbucket Overview Dashboard
Learn more
Bitbucket Overview Dashboard
Learn more
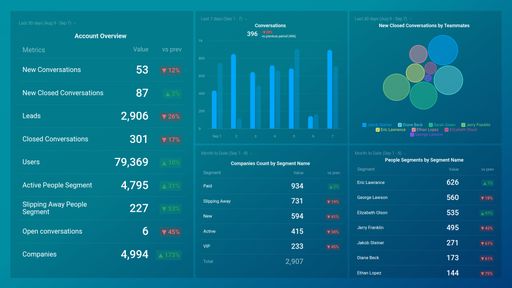 Intercom Account Overview
Learn more
Intercom Account Overview
Learn more
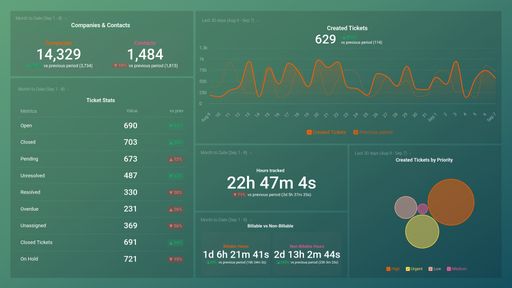 Freshdesk Tickets Overview
Learn more
Freshdesk Tickets Overview
Learn more
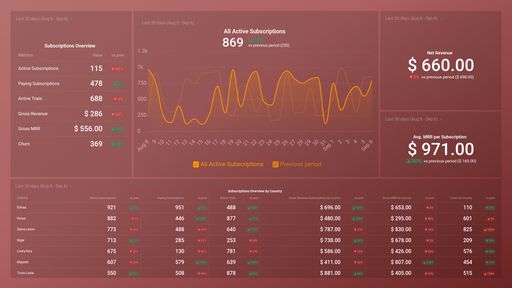 Appfigures Subscriptions Overview
Learn more
Appfigures Subscriptions Overview
Learn more
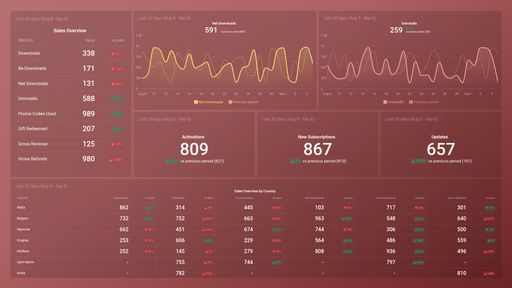 Appfigures Sales Performance
Learn more
Appfigures Sales Performance
Learn more
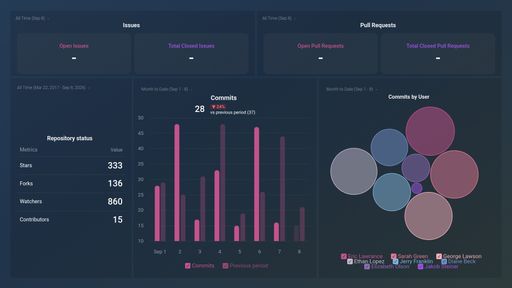 GitHub Overview Dashboard
Learn more
GitHub Overview Dashboard
Learn more
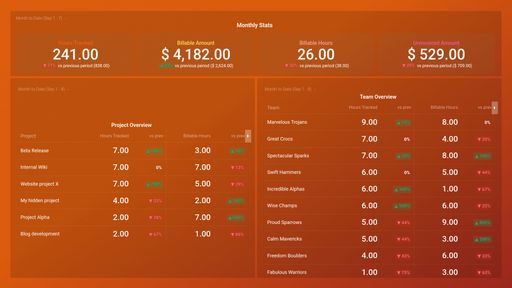 Harvest Time Project & Team Report
Learn more
Harvest Time Project & Team Report
Learn more
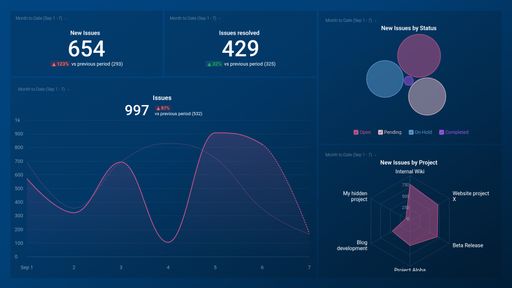 Jira Account Overview
Learn more
Jira Account Overview
Learn more
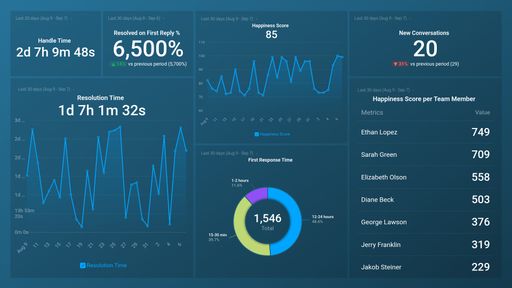 HelpScout for Customer Support
Learn more
HelpScout for Customer Support
Learn more
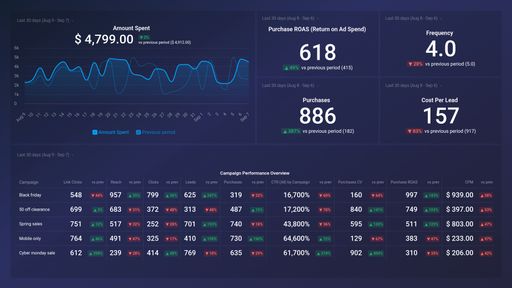 Facebook Ads Purchase & Leads Breakdown
Learn more
Facebook Ads Purchase & Leads Breakdown
Learn more
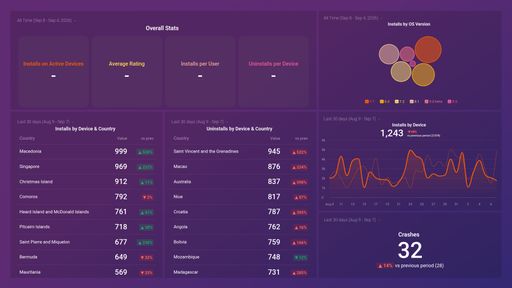 Google Play Store Metrics
Learn more
Google Play Store Metrics
Learn more
Create powerful dashboards, without code
Visualize your performance and spot trends faster, uncover new insights, make better decisions, and share your performance with anyone.
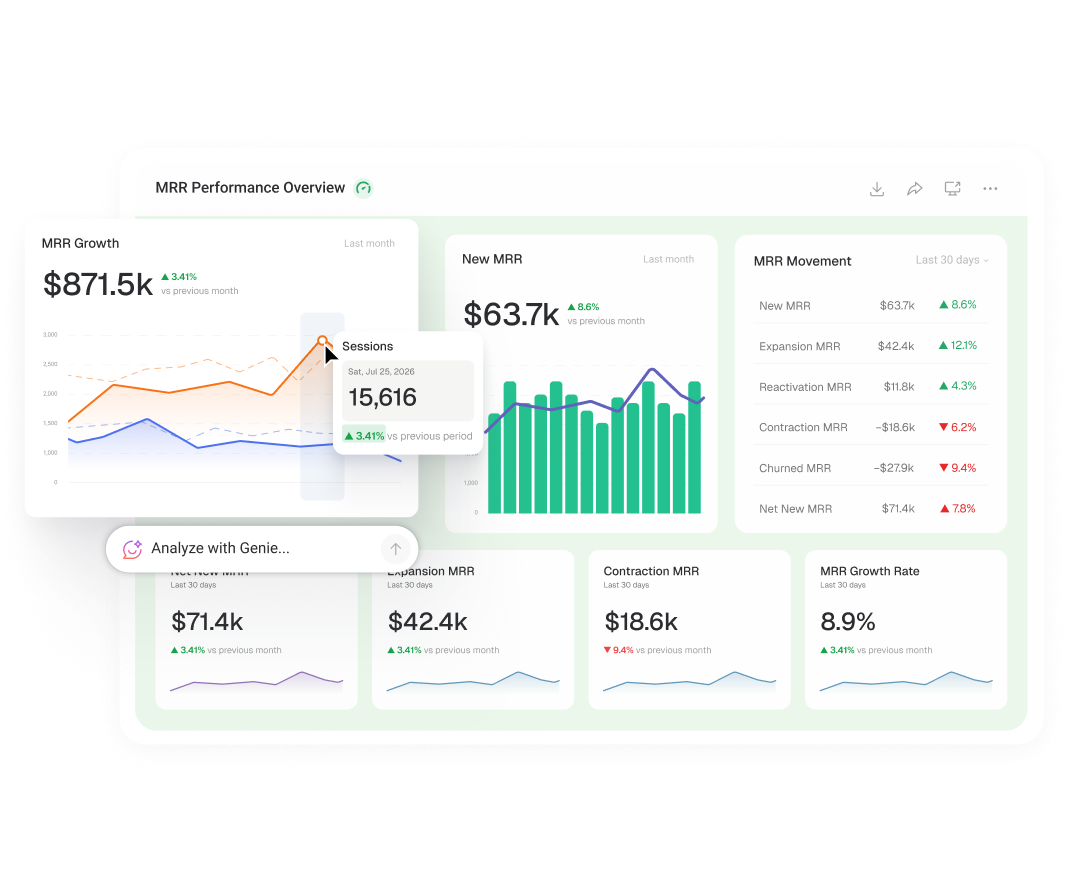
Do more with your dashboards
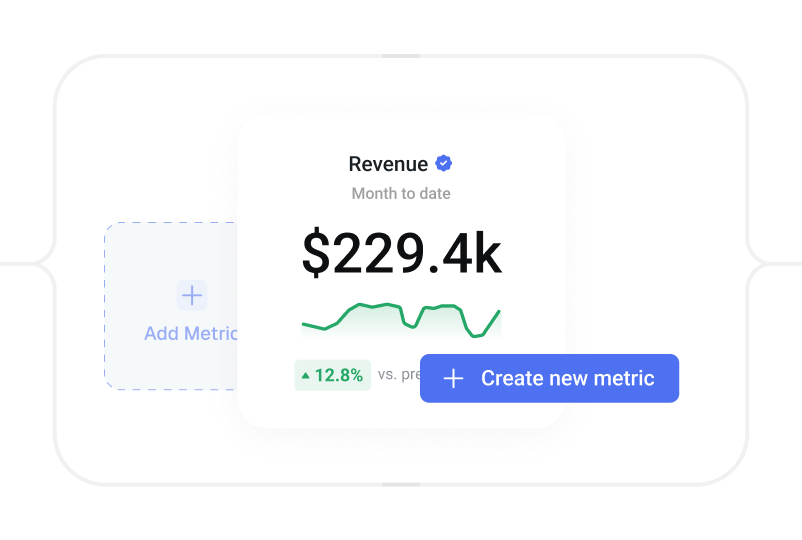
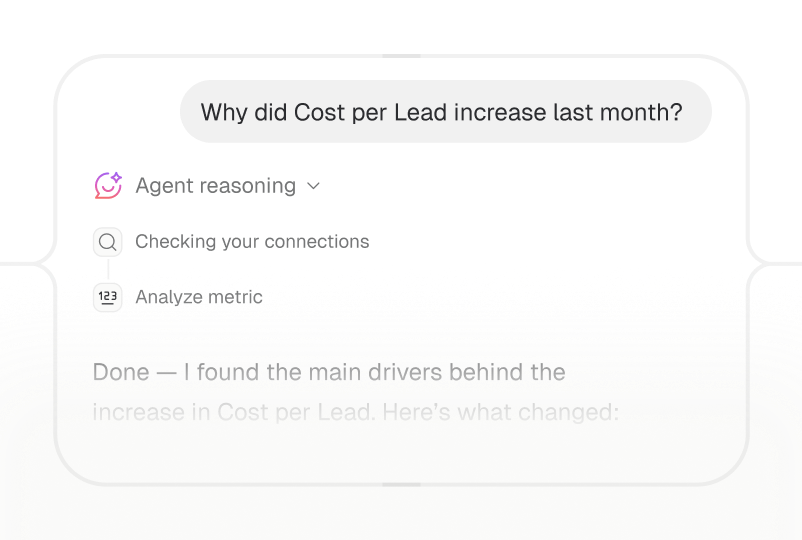
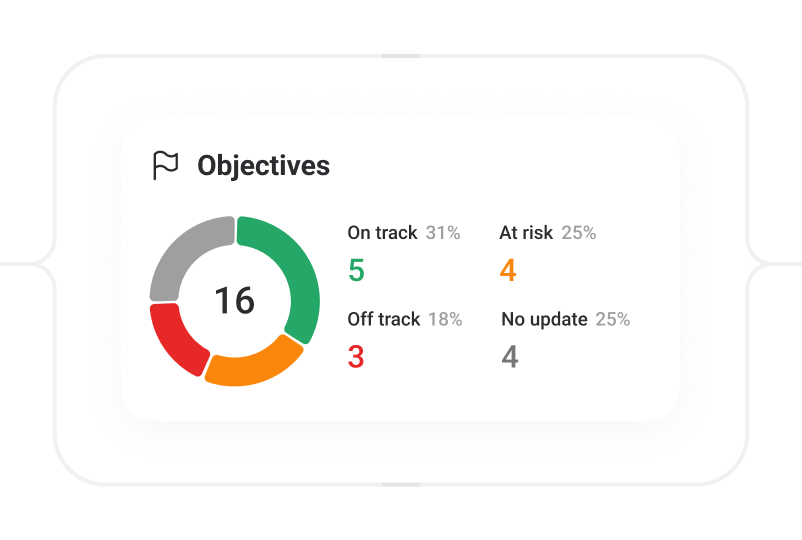
The dashboards you build connect to the rest of your work.
Learn more
Frequently asked questions
What is dashboard software?
Dashboard software pulls data from your business tools into one live, visual view, so you can track performance without exporting spreadsheets or logging into each tool separately. Databox connects to 130+ integrations and lets you build a dashboard in minutes, then ask its built-in AI Analyst to explain what changed and why.
Can I try Databox dashboard software for free?
Yes! Everyone starts with a free 14-day trial of the Growth plan. After your trial, choose to purchase any plan that best suits your needs.
How can I share my dashboard?
In Databox, you have multiple sharing options.
- Shareable Link: Dashboards can easily be shared and accessed through a link, showing the same date range and visualizations you have set.
- Scheduled Snapshots: Export dashboards into PDFs or JPGs at regular intervals — recipients don’t need to be Databox users.
- Embeds: Embed dashboards on web pages or tools like ClickUp/Notion.
- Stream To TV: Stream your dashboard on a Smart TV for team visibility.
Are dashboards interactive?
Yes, dashboards in Databox are interactive. You can hover over data points to view specific values, adjust date ranges for individual visualizations, update visualizations with a single click, and choose which lines (metrics, trend, goals) to view on charts.
Can I create dashboards combining data from different sources?
Yes! In fact, we recommend doing this to get a comprehensive view of performance. Inside the dashboard builder, you can swap through different data sources you’ve connected and pull whatever metrics you need. Here’s how you can create a dashboard using data from multiple data sources.
Can I change the logo and customize my dashboard?
Yes, you can change the colors of your dashboards and charts, and customize the logo to reflect your brand. Even better, create a fully branded experience with the white-label add-on — personalize the login screen, URL, mobile app, and more.
What’s the difference between a dashboard and a report in Databox?
Dashboards show live, real-time performance, best for month-to-date or week-to-date tracking. Reports are built for deeper analysis of historical periods, like last month or last quarter, and are typically sent as a PDF or scheduled email.
How many dashboards can I create?
All plans offer an unlimited number of dashboards. Learn more about plans and packaging here.
