Stocks Shake as Prosecutors Go After Fed Boss Powell. Now What?Wall Street went into the weekend riding record highs — and came back to something that felt more like a political thriller than a macro update.
US stock futures slipped after news broke that the Department of Justice has opened a criminal investigation into Federal Reserve Chair Jerome Powell, sha

The best trades require research, then commitment.
Get started for free$0 forever, no credit card needed

Scott "Kidd" PoteetThe unlikely astronaut

Where the world does markets
Join 100 million traders and investors taking the future into their own hands.

A letter to myself. (Buy the dip)This is phase one of a global technological financial system. If our parents even parked a fraction of their cash here 10–20 years ago the long-term payoff would have been nice, but they didn't and it's okay because they didn't know. We now have the privilege of choosing to contribute to our financi

Meta Is Down Nearly 20% Since August. Here's What Its Chart Says"Magnificent Seven" stock Meta Platforms NASDAQ:META has fallen nearly 20% since hitting an all-time high in August, and has also trailed the S&P 500 SP:SPX in various timeframes from three months to one year. Let's see what its chart and fundamental analysis can show us.
Meta's Fundamental An

NFLX: Massive Head-Shoulder-Formation!Hello There,
welcome to my new analysis about the Netflix stock (NFLX). Recently, I spotted major underlying factors that will be highly determining for the whole upcoming price action. The stock already dumped heavily bearishly towards the downside, almost declining over $150 B in market cap. Such

Where Is Oil Heading To ? - /CL Analysis 1) Technical Perspective: Support & Resistance
~$65 was a support zone earlier (2021–2024). In 2025–26, that $65 area now often acts as resistance. Prices have come down toward $55
2) Fundamental Drivers Behind the Downtrend
Oil has been in a multi-year decline from the highs seen in 2022 afte

Dollar Off to Weak Start After Worst Year Since 2017. Now What?The US dollar rang in 2026 without much enthusiasm. No fireworks. No flex. Just a quiet shuffle out of the gate that felt eerily familiar to anyone who shoved cash in FX markets last year.
After logging its worst annual performance since 2017, the greenback has started the new year on the back foot

Gold - Control vs Patience… Who Wins Next?Gold hasn’t done anything crazy lately, and that’s exactly the point.
Zooming out, the structure is still bullish. Every dip so far has been met with buyers, and the market keeps printing higher highs and higher lows.
Right now, price is sitting inside what I like to call a decision zone. This is

SUI is on the verge of another rally (4H)From the point where we marked the green arrow on the chart, a bullish phase has started on SUI. This area acted as a key reaction zone where buyers stepped in decisively, shifting market sentiment from corrective to bullish.
Based on the current price structure, it appears that we are developing a

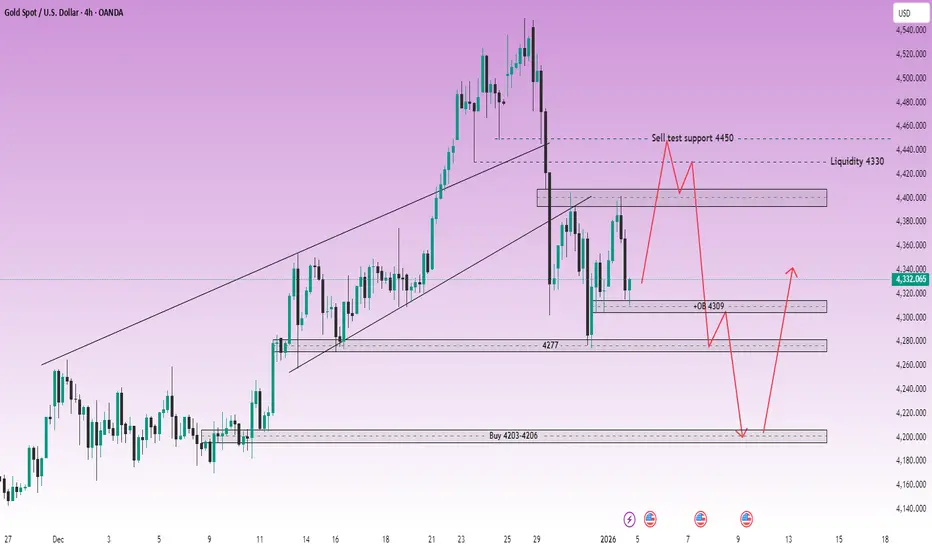
XAUUSD (H4) – Monday SetupGeopolitical shock risk, gold may spike | Trade liquidity and reaction zones only
Quick summary
News around Trump’s claim that Maduro has been detained, plus Venezuela’s response (they don’t know his and his wife’s whereabouts and are demanding proof of life), raises geopolitical uncertainty sharpl
ETHBTC W Pattern Makes the Case for a Macro Bull MarketIt seems pretty clear to me that ETHBTC is in a multi year W pattern. The higher low on the W, with hidden bullish divergence helps confirm the pattern, as does the recent price action.
From April to May of 2025 price consolidated in a low and then surged to a local high in August when it the oran

See all editors' picks ideas
Arbitrage Detector [LuxAlgo]The Arbitrage Detector unveils hidden spreads in the crypto and forex markets. It compares the same asset on the main crypto exchanges and forex brokers and displays both prices and volumes on a dashboard, as well as the maximum spread detected on a histogram divided by four user-selected percenti

Multi-Distribution Volume Profile (Zeiierman)█ Overview
Multi-Distribution Volume Profile (Zeiierman) is a flexible, structure-first volume profile tool that lets you reshape how volume is distributed across price, from classic uniform profiles to advanced statistical curves like Gaussian, Lognormal, Student-t, and more.
Instead of forcin

Multi-Ticker Anchored CandlesMulti-Ticker Anchored Candles (MTAC) is a simple tool for overlaying up to 3 tickers onto the same chart. This is achieved by interpreting each symbol's OHLC data as percentages, then plotting their candle points relative to the main chart's open. This allows for a simple comparison of tickers to tr

Vdubus Divergence Wave Pattern Generator V1The Vdubus Divergence Wave Theory
10 years in the making & now finally thanks to AI I have attempted to put my Trading strategy & logic into a visual representation of how I analyse and project market using Core price action & MacD. Enjoy :)
A Proprietary Structural & Momentum Confluence System

Per Bak Self-Organized CriticalityTL;DR: This indicator measures market fragility. It measures the system's vulnerability to cascade failures and phase transitions. I've added four independent stress vectors: tail risk, volatility regime, credit stress, and positioning extremes. This allows us to quantify how susceptible markets are

Volatility Risk PremiumTHE INSURANCE PREMIUM OF THE STOCK MARKET
Every day, millions of investors face a fundamental question that has puzzled economists for decades: how much should protection against market crashes cost? The answer lies in a phenomenon called the Volatility Risk Premium, and understanding it may fundam

Volume Gaps & Imbalances (Zeiierman)█ Overview
Volume Gaps & Imbalances (Zeiierman) is an advanced market-structure and order-flow visualizer that maps where the market traded, where it did not, and how buyer-vs-seller pressure accumulated across the entire price range.
The core of the indicator is a price-by-price volume prof

Match Finder [theUltimator5]Match Finder is the dating app of indicators. It takes your current ticker and finds the most compatible match over a recent time period. The match may not be Mr. right, but it is Mr. right now. It doesn't forecast future connection, but it tells you current compatibility for today.
Jokes aside,

Trend Line Methods (TLM)Trend Line Methods (TLM)
Overview
Trend Line Methods (TLM) is a visual study designed to help traders explore trend structure using two complementary, auto-drawn trend channels. The script focuses on how price interacts with rising or falling boundaries over time. It does not generate trade sign

Breakouts & Pullbacks [Trendoscope®]🎲 Breakouts & Pullbacks - All-Time High Breakout Analyzer
Probability-Based Post-Breakout Behavior Statistics | Real-Time Pullback & Runup Tracker
A professional-grade Pine Script v6 indicator designed specifically for analyzing the historical and real-time behavior of price after strong All-Ti

See all indicators and strategies
Community trends
APLD: Momentum Confirms Triangle BreakoutAPLD - CURRENT PRICE : 37.68
APLD Breaks Symmetrical Triangle – Momentum Confirms Trend Continuation
Applied Digital Corporation (APLD) continues to trade within a strong long-term uptrend, with price holding well above the rising EMA 200 , signaling sustained institutional support and a struc

NVDA — Trend Support ReactionHello Everyone, Followers,
Happy Sunday to all.
As always I will share 3 analysis this week that I beleive there are some opportunities.
First one is NVDIA, Lets drill down:
📌 Technical Overview
NVIDIA remains in a strong long-term uptrend and continues to respect its rising channel structure.

NVDA — Technical Analysis (1H · 15M · GEX) DEC. 12-161H – Structure first, emotion later
On the 1-hour, NVDA is still technically bearish, but the selling pressure has clearly slowed. We already got a BOS to the downside, followed by a CHoCH, which tells me sellers have done most of their damage for now.
Price is compressing under a descending trendli

trading: pattern of the "leaders" (most important graphs)Mark Minervini said You should trade stocks, when the market leaders coincide with the indexes.
It gives you thesis to look for the patterns in the leaders.
I would go step further and say, markets sometimes "coil" into patterns? where all market just agrees on something and key dates? like when

MSTR - Volume anchored channelA few things on MSTR.
This is a weekly log channel using volume-based anchors.
Note the respect of this channel over time.
Note that the midline respected and once over it, bull. Once under, bear.
These points are also fib anchors, which I'll share in a moment.
RSI is also bottomed.
If there

UROY | Nuclear Energy Sources Will Rise | LONGUranium Royalty Corp. operates as an exploration company, which engages in acquiring and assembling a portfolio of royalties, and investing in companies with exposure to uranium and physical uranium. The company was founded by Amir Adnani on April 21, 2017 and is headquartered in Vancouver, Canada.

META: Impulsive Recovery Signals Momentum ShiftMETA has staged a strong recovery from its recent lows, with price action showing a clear impulsive push higher and improving momentum. The structure suggests buyers have regained control after a period of weakness, transitioning the market into a more constructive phase. Rather than a random bounce

$IREN, ≈75% Probability the December Low will not holdNASDAQ:IREN — Why I Think the December Low Is Unlikely to Hold (≈75% Probability)
Here’s why.
Yesterday I realized that price is currently moving within a short-term bull channel. 10 years ago, when I was a junior trader at a proprietary trading firm in the Netherlands, my supervisor once asked m

It's a time for NETFLIX - 30% potential profit - 116 USDThe 4-hour chart of Netflix shows a corrective decline followed by price stabilization in the 88–90 USD area. This zone currently acts as a key technical support, where buying interest previously emerged, suggesting potential short-term exhaustion of selling pressure.
After a sharp sell-off, downsi

ANAB (USA) - Biotech Momentum Testing Major SupportAnaptysBio Inc has been on a good run this year with a gain of over 200% . Based in San Diego, this clinical-stage biotech focuses on developing antibody therapeutics for inflammatory diseases. When a stock runs this hard, it eventually needs a bit of a pullback to get back into a better value are

See all stocks ideas
Today
VMARVision Marine Technologies Inc.
Actual
—
Estimate
−1.67
USD
Today
LOOPLoop Industries, Inc.
Actual
—
Estimate
−0.06
USD
Today
LFCRLifecore Biomedical, Inc.
Actual
—
Estimate
−0.14
USD
Today
WAFDWaFd, Inc.
Actual
—
Estimate
0.76
USD
Tomorrow
DALDelta Air Lines, Inc.
Actual
—
Estimate
1.53
USD
Tomorrow
BKThe Bank of New York Mellon Corporation
Actual
—
Estimate
1.91
USD
Tomorrow
NTRPNextTrip, Inc.
Actual
—
Estimate
−0.14
USD
Tomorrow
JPMJP Morgan Chase & Co.
Actual
—
Estimate
4.85
USD
See more events
Community trends
BTCUSDT: Consolidates Above Support, Bulls Preparing Next MoveHello everyone, here is my breakdown of the current BTCUSDT setup.
Market Analysis
BTCUSDT previously traded inside a well-defined range, where price moved sideways for an extended period, indicating balance and accumulation between buyers and sellers. This consolidation phase ended with a clean

Bitcoin Under Pressure - H1-Bearish Flag (10.01.2026)📝 Description 🔍 Setup (Market Structure) COINBASE:BTCUSD
BTC/USDT - Bitcoin is forming a classic Bearish Flag pattern on the H1 timeframe after a strong impulsive sell-off (flagpole). Price is consolidating upward in a tight channel while staying below EMA and Ichimoku cloud resistance, indica

BTC going upBTCUSD 4H chart showing consolidation around 90,900, with support near 89,170 and 87,307, and a bullish projection targeting the 94,774 resistance zone.

BTCUSDT – Inverse Head & Shoulders Target in SightHi!
BTC is forming a clean inverse head & shoulders inside a rising channel. The right shoulder is holding well, and the price is pushing toward the neckline.
Structure:
Inverse H&S: bullish continuation
Supported by an ascending channel
🎯 Target:
➡️ 91,100 – 91,200 (measured move of the pattern)

Bitcoin: Higher Lows Lead To Higher Highs Watch Longs.After rejecting the 95K key resistance, Bitcoin is now testing the 90K area (old resistance / new support) and is poised to establish a higher low for the coming week. From here the key is to identify bullish reversal patterns in this area, and wait for them to confirm. Upon confirmation risk/reward

OrAI (Orachain) AI. Trend. Death, or a Little Later? 01 11 2026Logarithm 1 week. The idea is more educational. In my opinion, it's a dying project simulating utility, fueled by the hype of AI agents. During the hype, it was around $100-$80. Now it's $0.64. That's a price drop of -99.4%. Just think about it...
I also specifically showed buying at the “bottom” b

Elise | BTCUSD – M30 | Liquidity Re-Accumulation SetupBITSTAMP:BTCUSD
After liquidity was engineered on both sides, BTC stabilized above the sell-side resting zone and is now compressing near trendline support. This behavior typically precedes expansion after consolidation, provided structure remains intact and price does not accept below demand.
Ke

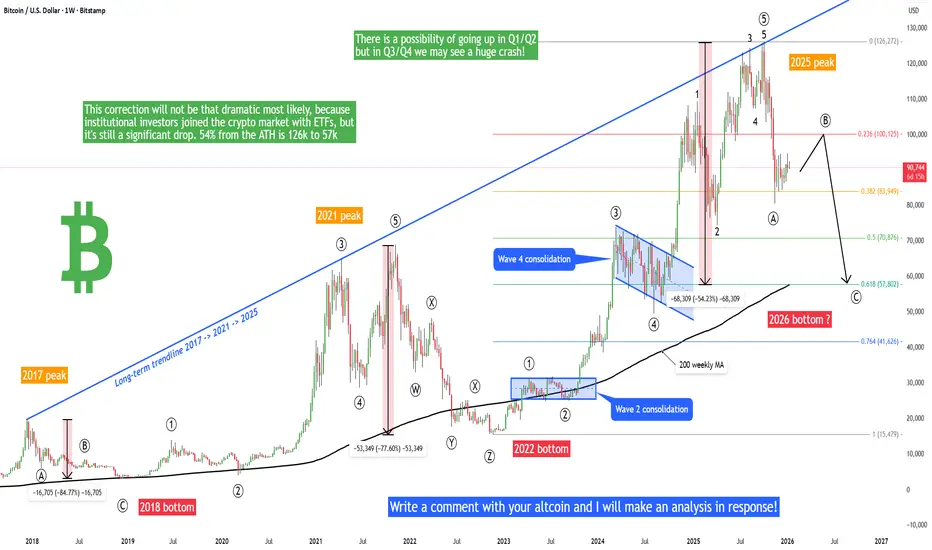
Bitcoin - 2026 roadmap, pump to 100k, then crash to 57k!Is it possible that Bitcoin will go above 100k or 103k in the next weeks/months? And is it possible that Bitcoin will later drop heavily to 57k? Altcoin season during the rise to 103k? I will answer these questions in this post. Write a comment with your altcoin, hit the like button, and I will make
ADA Bullish Move Incoming? (4H)Given that the ongoing correction has extended longer than expected, it appears that buyers have not yet fully entered the market. This current correction falls into the category of complex double corrections, which are often seen in mature or consolidating markets.
From a structural perspective, C

BTC is trying to build a classic 1-2-3 reversal PatternWhat the market has already done
Point 1:
This is the capitulation low. You can see aggressive selling into that wick, followed by an immediate reaction higher. That tells us sellers are getting exhausted and demand is finally stepping in.
Point 2:
Price pushes up but gets rejected at the descendi

See all crypto ideas
Gold Weekly Levels: Break above 4555 → 4625/4635🔱 GOLD WEEKLY SNAPSHOT — EXECUTIVE SUMMARY
✨ Bulls remain in control as price transitions into the Wave-5 extension sequence
🟡 Key unlock level: 4555 — a clean break/acceptance above opens continuation fuel
🚀 Wave-5 extension target: 4625–4635 (primary upside objective / price discovery ceiling)

Gold Defends Buyer Zone, Upside Toward 4,550 in FocusHello traders! Here’s my technical outlook on XAUUSD (3H) based on the current chart structure. Gold previously traded inside a well-defined range, where price moved sideways for an extended period, showing balance between buyers and sellers. This consolidation acted as an accumulation phase and mar

THE KOG REPORTTHE KOG REPORT:
In last week’s KOG Report we said we would look for price to hold that lower region and then attempt the incline into the higher defence where we expected a RIP. That move completed successfully giving our traders not only the opportunity to long but to capture the retracement as w

GOLD 1H CHART ROUTE MAP UPDATE & TRADING PLAN FOR THE WEEKHey Everyone,
Please see our 1h chart levels and targets for the coming week.
We are seeing price play between two weighted levels with a gap above at 4530 and a gap below at 4505, as support. We will need to see ema5 cross and lock on either weighted level to determine the next range.
We will se

Gold Strengthens as Geopolitical Risk IncreasesGold Strengthens as Geopolitical Risk Increases
Gold continues to respect a bullish market structure, with price developing a clear impulsive sequence followed by shallow corrective waves. The recent pullback found support near the 4,400 zone (wave iv), and price is now pushing higher again, confi

Lingrid | GOLD Weekly Analysis: $4,500 Breached – What’s Next?OANDA:XAUUSD market has broken and closed above the $4,500 psychological barrier—a milestone that validates the bullish thesis and signals a new phase of upward momentum. This breakout wasn’t accidental; it followed a textbook pullback pattern. The bulls now control the narrative, with the next maj

XAU/USD Bullish Breakout | Trendline & Demand Support
Price is holding above the rising trendline and strong buying area after a clean breakout. Structure remains bullish, with higher highs and higher lows, showing strong buyer control and upside momentum

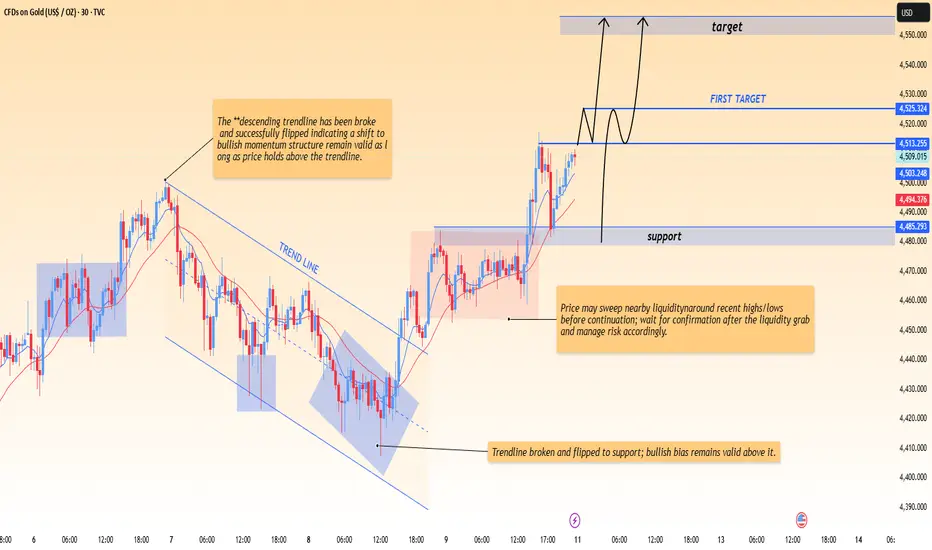
XAUUSD 30M – Trendline Break & Bullish ContinuationPrice has broken above the descending trendline and key resistance, confirming a bullish structure shift.
The former resistance zone around 4,485–4,500 is now acting as strong support.
Holding above support favors continuation toward the first target at 4,524 and the main target near 4,550–4,560,
XAUUSD – Breakout After 33% Correction, Trend ContinuationHi!
Gold is moving inside a clear ascending channel and remains firmly bullish. After a healthy 33% correction, the price reclaimed and broke above a key resistance zone, which is now acting as support.
The reaction after the breakout is clean, showing strong buyer control and continuation momentu

Gold Uptrend Strengthens, New Expansion Phase BeginsOver the past week, gold has continued to advance in a very “textbook” manner. What stands out is not how far price has moved, but how it has moved: steady, controlled, and consistently supported by both technical structure and the macro backdrop. On the H4 chart, this is the type of bullish behav

See all futures ideas
EURUSD Long: Bulls Defend 1.1620 Demand, Targeting Supply 1.1680Hello traders! Here’s a clear technical breakdown of EURUSD (2H) based on the current chart structure. EURUSD initially traded within a well-defined range, where price moved sideways for an extended period, reflecting a balance between buyers and sellers. During this consolidation phase, the market

NZDUSD Breakout and Potential Retrace!Hey Traders, in tomorrow's trading session we are monitoring NZDUSD For a buying opportunity around 0.56700 zone, NZDUSD was trading in a downtrend and successfully managed to break it out. Currently is in a correction phase in which it is approaching the retrace area at 0.56700 support and resistan

USDJPY Price Update – Clean & Clear ExplanationUSD/JPY is trading inside a clear ascending channel, showing that the overall trend is still bullish. Price has respected the trendline support multiple times and is now moving higher from the lower-mid area of the channel.
The grey zones represent strong supply and demand areas. Previously, price

EURUSD Bearish Continuation After PullbackQuick Summary
EURUSD broke below 1.16824, A corrective move toward the orderblock at 1.17143 is possible
This pullback is expected to act as a continuation zone for further downside and The main objective remains which is filling the liquidity void after the bullish trendline break
Full Analysis

EURUSD: Fake Breakout at Resistance Targets 1.1600 SupportHello everyone, here is my breakdown of the current EURUSD setup.
Market Analysis
EURUSD previously traded within a well-defined upward channel, respecting both the rising support and resistance lines, which confirmed a short-term bullish structure. During this phase, price produced a series of h

12.01.26 Daily ForecastPairs on Watch -
FX:NZDJPY
FX:GBPJPY
FX:EURCAD
A short overview of the instruments I am looking at for today, multi-timeframe analysis down to what I will be looking at for an entry. Enjoy!

Lingrid | EURUSD Bullish Setup from Key Support AreaFX:EURUSD has reacted sharply from the lower boundary of the descending channel, forming a clean bounce from the support zone. Price has already reclaimed short-term range resistance and is now attempting to stabilize above the broken structure, hinting that bearish momentum may be fading rather th

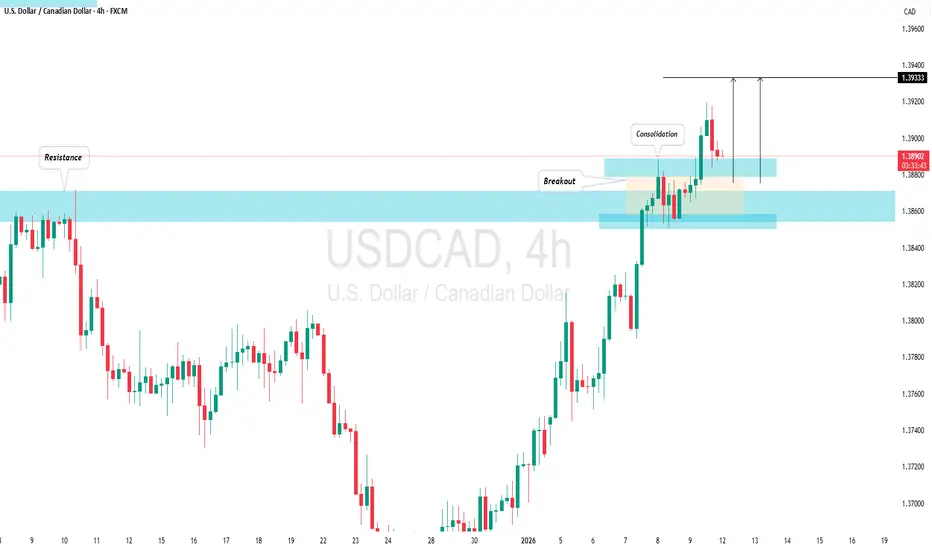
USD/CAD: More Growth Ahead!The USDCAD pair successfully breached and important daily resistance level last week, confirming a bullish Break of Structure (BoS).
Following this, a retest of the previously broken structure was observed on Friday, leading to subsequent consolidation.
A bullish breakout above its intraday resis
Selena | EURUSD – 4H | Higher-Timeframe Channel Support ReactionFX:EURUSD
After a strong bullish expansion toward the upper range highs, price entered a corrective phase. The current decline has reached a confluence zone consisting of prior support and channel support, where selling momentum has slowed. This suggests potential for a technical bounce as long as

NZDUSD SHORT Market structure bearish on HTFs 3
Entry at Weekly and Daily AOi
Weekly Rejection at AOi
Previous Weekly Structure Point
Daily Rejection At AOi
Previous Daily Structure Point
Daily EMA retest
Around Psychological Level 0.57500
Touching EMA H4
H4 Candlestick rejection
Rejection from Previous str

See all forex ideas
| - | - | - | - | - | - | - | ||
| - | - | - | - | - | - | - | ||
| - | - | - | - | - | - | - | ||
| - | - | - | - | - | - | - | ||
| - | - | - | - | - | - | - | ||
| - | - | - | - | - | - | - | ||
| - | - | - | - | - | - | - | ||
| - | - | - | - | - | - | - |
Trade directly on Supercharts through our supported, fully-verified, and user-reviewed brokers.


