prettyplotlib
Python matplotlib-enhancer library which painlessly creates beautiful default matplotlib
plots. Inspired by Edward Tufte's work on information design and Cynthia Brewer's work on color perception.
I truly believe that scientific progress is impeded when improper data visualizations are used. I spent a lot of time tweaking my figures to make them more understandable, and realized the scientific world could be a better place if the default parameters for plotting libraries followed recent advances in information design research. And thus prettyplotlib was born.
Requirements:
-
matplotlib. Can be installed viapip install matplotliboreasy_install matplotlib -
brewer2mpl. Can be installed viapip install brewer2mploreasy_install brewer2mpl
Comparison to matplotlib
matplotlib default plot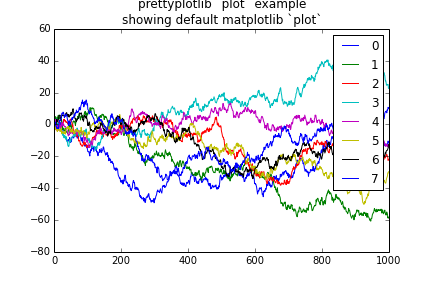
|
prettyplotlib default plot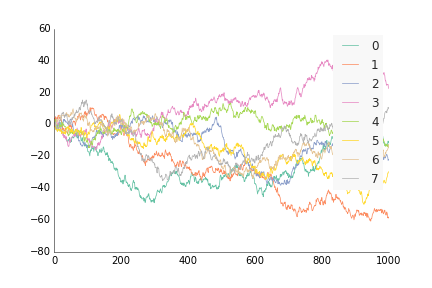
|
matplotlib default fill_between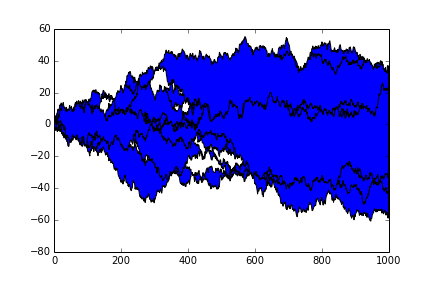
|
prettyplotlib default fill_between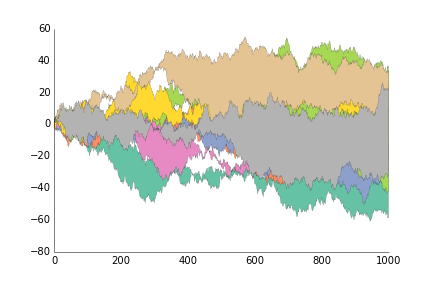
|
matplotlib default fill_betweenx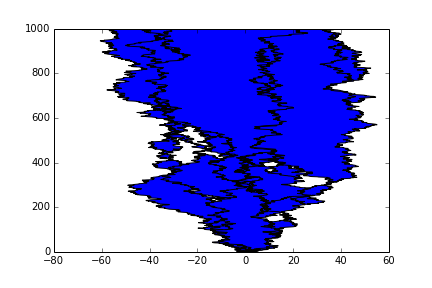
|
prettyplotlib default fill_betweenx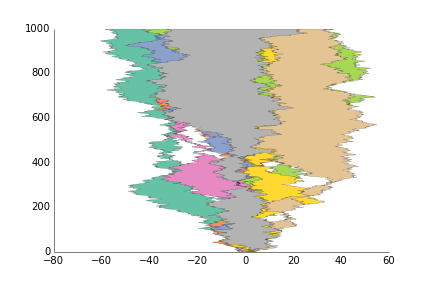
|
matplotlib default scatter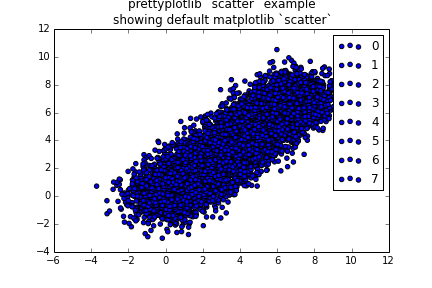
|
prettyplotlib default scatter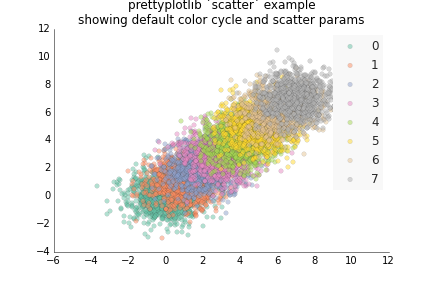
|
matplotlib default bar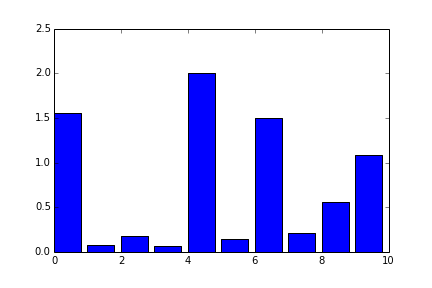
|
prettyplotlib default bar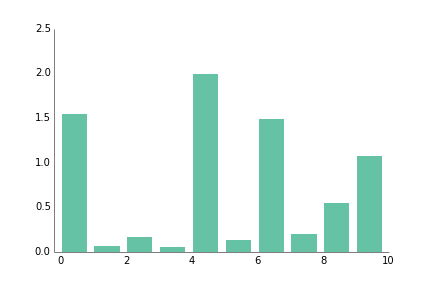
|
matplotlib default non-annotated bar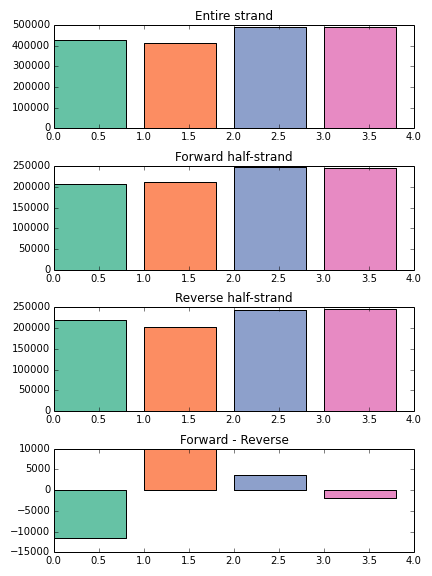
|
prettyplotlib default annotated bar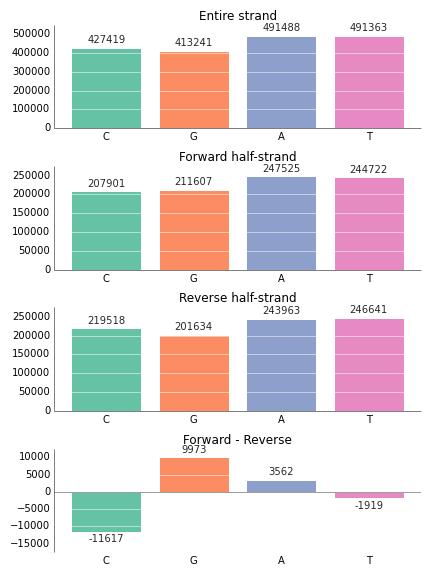
|
matplotlib default hist
|
prettyplotlib default hist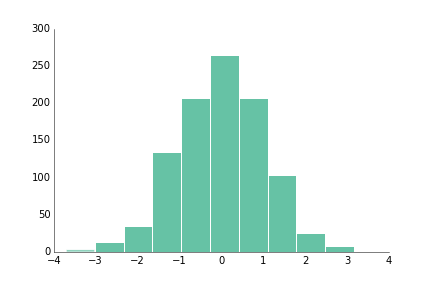
|
matplotlib default histwith grid 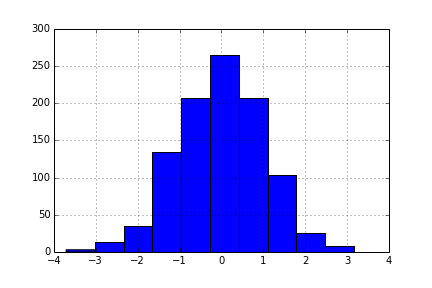
|
prettyplotlib default histwith grid 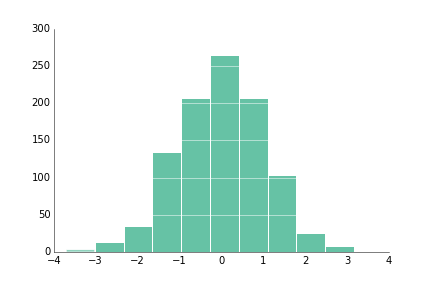
|
matplotlib default boxplot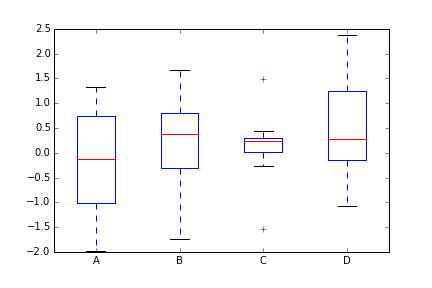
|
prettyplotlib default boxplot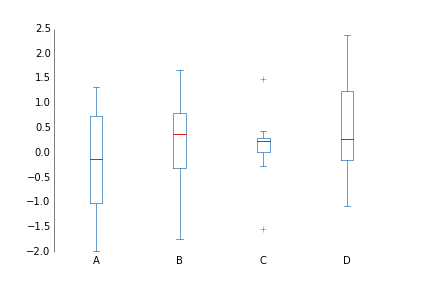
|
matplotlib default pcolormeshpositive and negative data 
|
prettyplotlib default pcolormeshpositive and negative data 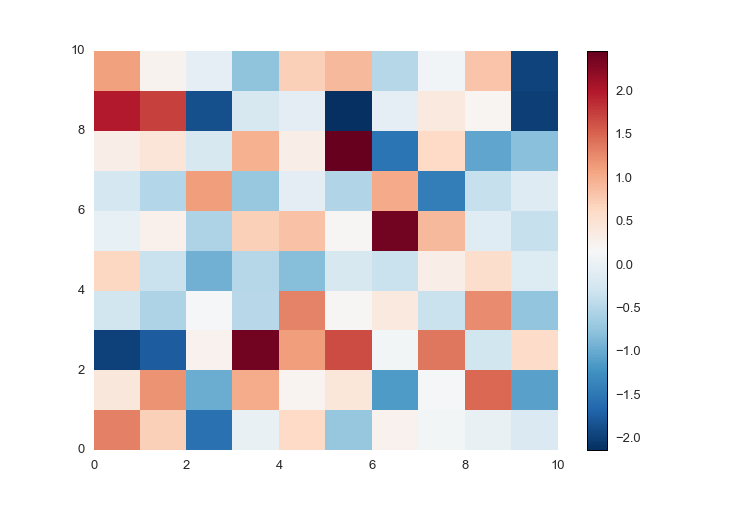
|
matplotlib default pcolormeshpositive data only 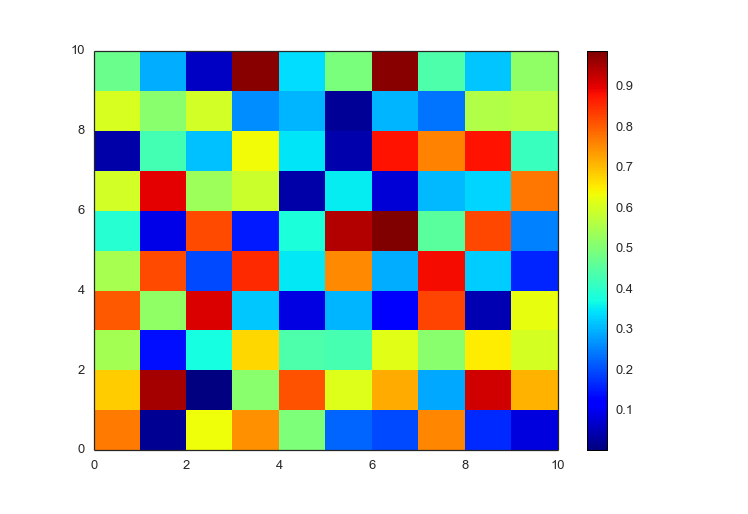
|
prettyplotlib default pcolormeshpositive data only 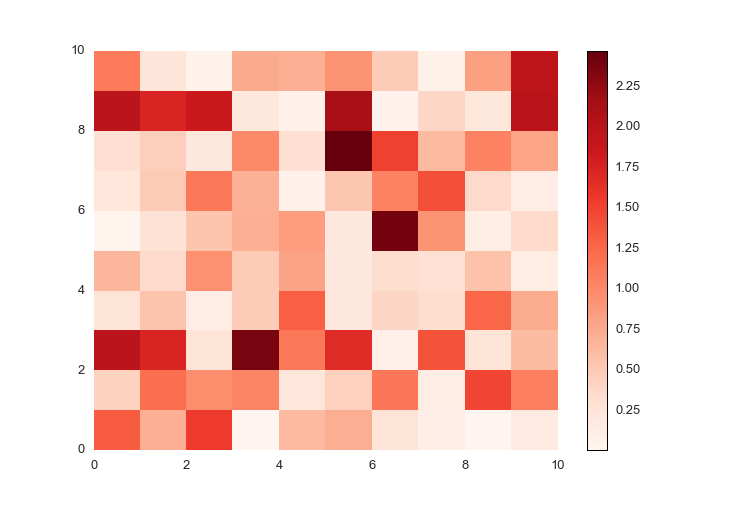
|
matplotlib pcolormeshnegative-valued data with labels 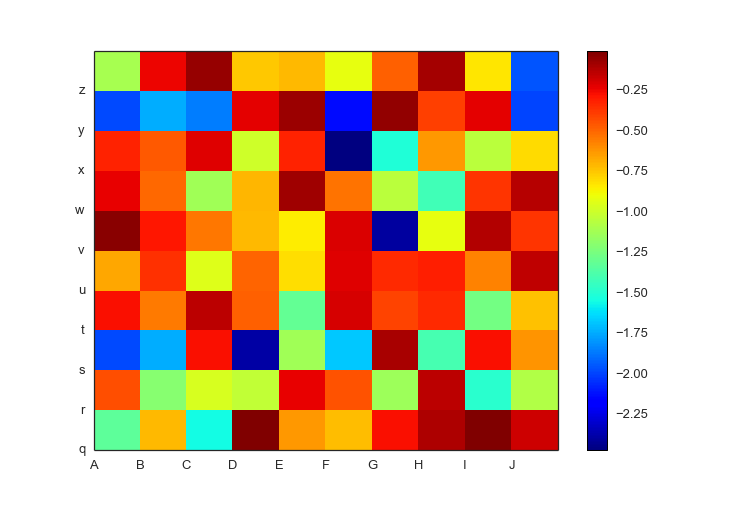
|
prettyplotlib pcolormeshnegative-valued data with labels 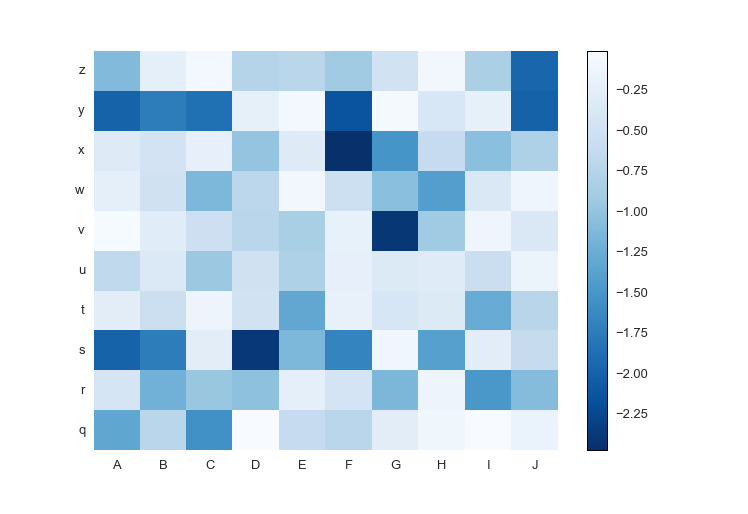
|
Quotes
"Dis ain't no uglyplotlib" - Anonymous
