1. X
  2. InfluxData
Log inSign up
InfluxData
32.2K posts
Image
user avatar
InfluxData
@InfluxDB
InfluxDB is the leading time series platform. It’s About Time. ⏱️
San Francisco
influxdata.com
Joined October 2013
4,117
Following
25.1K
Followers
RepliesRepliesMediaMedia
  • Pinned
    user avatar
    InfluxData
    @InfluxDB
    Jul 30
    Time series workloads rarely stay simple. Fleets grow, schemas get wider and sparser, query patterns shift, and the database needs to stay fast under heavier load. #InfluxDB 3.11 is built for that reality, with a significant performance upgrade for demanding time series
    Dark blue graphic featuring text that highlights "InfluxDB 3.11" by InfluxData. It states a significant performance upgrade for complex time series workloads. Fade-in effect on "3.11".
  • user avatar
    InfluxData
    @InfluxDB
    35m
    Getting #InfluxDB 3 Core up and running should be quick. We built it so you can go from zero to your first query in under 10 minutes. This guide walks through installation (quick download or Docker), token generation, and loading sample data, all with minimal friction. Whether
    A promotional graphic for InfluxDB 3 Core by InfluxData, featuring the text "Getting Started with InfluxDB 3 Core." The image includes a partial view of a dashboard displaying graphs and charts. The background is a deep blue.
  • user avatar
    InfluxData
    @InfluxDB
    2h
    AI infrastructure generates telemetry everywhere, from GPU utilization to rack power and thermal conditions. Join the webinar TOMORROW to learn how #InfluxDB captures high-frequency metrics across GPU fleets and datacenter infrastructure in one time series platform. Register:
    Sure, here's an alternative text description:

"Webinar announcement by InfluxData titled 'The Physical Layer of AI: Monitoring Power, Heat, and GPU Health at Scale,' featuring Ian Clark, Sales Engineer. Scheduled for August 11, 2026, at 8 AM PT / 4 PM BST. Includes a register button."
  • user avatar
    InfluxData
    @InfluxDB
    11h
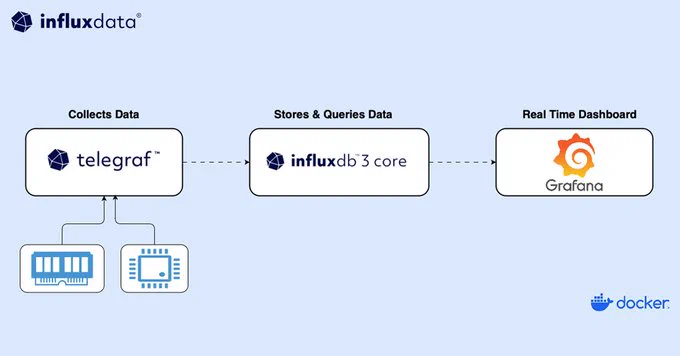
    Got 10 minutes? ⏱️ You’ve got a TIG stack. Learn how to collect, store, and visualize metrics using Telegraf + #InfluxDB 3 + Grafana. ⬇️ bit.ly/3IhbNZw
    Diagram showing a data flow: Telegraf collects data from devices, InfluxDB 3 Core stores and queries the data, and Grafana displays it in a real-time dashboard. Docker is noted in the bottom right corner. InfluxData logo is in the top left corner.
  • user avatar
    InfluxData
    @InfluxDB
    15h
    InfluxDB's licensing strategy matters for developers. Our CTO, @pauldix, breaks down the different license types we use and why these choices shape how #InfluxDB develops alongside its open source community. ⬇️
    Image
    00:00

Log in or sign up for X

See what’s happening and join the conversation

Continue with phone
or
Log in with username or email
Terms·Privacy·Cookies·Accessibility·Ads Info·© 2026 X Corp.
Advertisement
Advertisement