1. X
  2. Google Earth
Log inSign up
Google Earth
4,147 posts
Image
user avatar
Google Earth
@googleearth
Discover geospatial datasets and tools, AI capabilities, and planetary-scale insights from Google Earth, Google Earth Engine and Google Maps Platform
Mountain View, CA
g.co/earth
Joined April 2009
286
Following
1.1M
Followers
RepliesRepliesMediaMedia

Log in or sign up for X

See what’s happening and join the conversation

Continue with phone
or
Log in with username or email
Terms·Privacy·Cookies·Accessibility·Ads Info·© 2026 X Corp.
  • Pinned
    user avatar
    Google Earth
    @googleearth
    18h
    Today we’re bringing AI image generation with Nano Banana to Google Earth, letting you virtually reimagine anywhere in the real world. 🍌 goo.gle/44SUsOP For the first time, you can generate custom images using Google Earth’s satellite, aerial, and 3D imagery. 🌎
    Image
    00:00
    205K
  • user avatar
    Google Earth
    @googleearth
    Jul 28
    A lot has changed on Google Earth recently. Learn how to take advantage of our new professional features from Group Product Manager, Brian Ho, in our new Google Earth Tutorial! goo.gle/4fY9ZTA You'll learn about everything from data importing and imagery to
    Image
    00:00
    36K
  • user avatar
    Google Earth
    @googleearth
    Jul 27
    We are thrilled to announce that eligible organizations can now apply for Google Earth credits through the Google Maps Platform (GMP) Public Programs. goo.gle/4pJ0nQ5 For decades, environmental and social benefit professionals—from conservationists protecting wildlife to
    A screenshot of a GIS mapping application interface displays a satellite view of a forested region near Leverett, Massachusetts, with several data layers overlaid. The main map area features a large purple-outlined polygon for the Doolittle Brook Conservation Area containing yellow contour lines, along with labeled points for water quality and fish toxics. A left sidebar titled "Map contents" lists various active and inactive layers, including "Study Area Slope" and a "Digital elevation model," complete with their respective color-coded legends.
    37K
  • user avatar
    Google Earth
    @googleearth
    Jul 16
    Relive 60 years of soccer history at Mexico City’s Aztec Stadium with Google Earth and Fundación ICA. ⚽🌎 goo.gle/4vEg24y Mexico City's Estadio Azteca made soccer history last month during the tournament opener between Mexico and South Africa. In hosting this match, it
    A black and white aerial view image of a stadium and the surrounding area.
    An aerial view of a stadium with turf visible on the field.
    An aerial view of a stadium and surrounding parking.
    A black and white wide shot of a stadium.
    10K
  • user avatar
    Google Earth
    @googleearth
    Jul 15
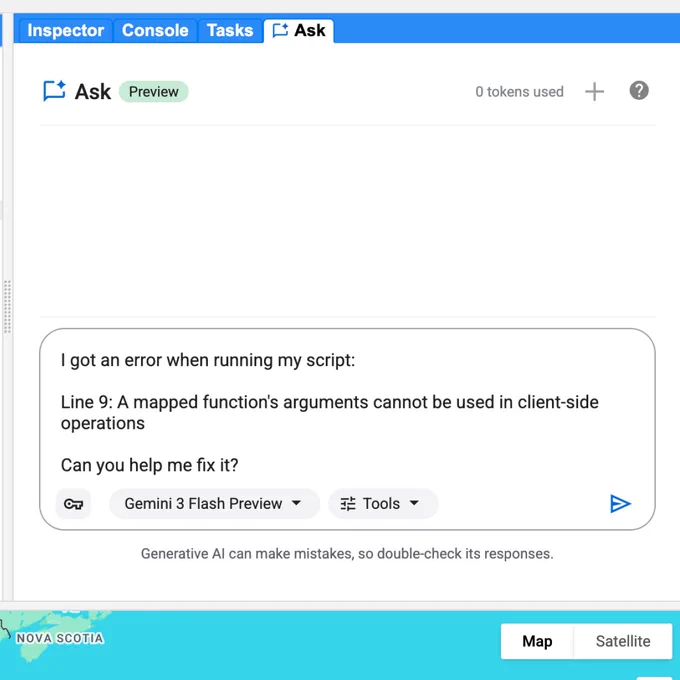
    Generate your script, inspect the diff, merge with confidence. We just launched Ask in the Google Earth Engine Code Editor. It brings Gemini capabilities directly into the Code Editor to help you write, debug, and understand geospatial queries without leaving your workspace.
    An AI-powered "Ask" interface in a software environment provides an explanation and JavaScript code for visualizing 10 years of deforestation in California using the Hansen Global Forest Change dataset. The interface features navigation tabs for Inspector, Console, Tasks, and Ask at the top, and includes a text box at the bottom for follow-up questions. The main content explains the dataset's "lossyear" band and provides a code snippet to filter and display data from 2014 to 2023.
    An AI chatbot interface under the "Ask" tab features a text input field at the bottom with the typed prompt, "Show me areas in California that have been deforested in the last 10 years." Below the prompt text, a dropdown menu is set to "Gemini 3 Flash Preview" next to a "Tools" menu and a blue send icon. The top header shows tabs for Inspector, Console, Tasks, and Ask, with a counter indicating zero tokens used.
    A software interface shows the active "Console" tab with an error message box that reads "Error Line 9: A mapped function's arguments cannot be used in client-side operations." Below the error message is a "Troubleshoot" button, and at the bottom of the screen, a map of Nova Scotia is visible with buttons for "Map" and "Satellite" views.
    The interface for an AI assistant named "Ask" displays a user's prompt regarding a script error: "Line 9: A mapped function's arguments cannot be used in client-side operations. Can you help me fix it?" Below the text box are controls for selecting the "Gemini 3 Flash Preview" model and "Tools," along with a blue send icon and a disclaimer about AI accuracy. The top navigation bar includes tabs for "Inspector," "Console," and "Tasks," while the bottom of the screen shows a portion of a map of Nova Scotia.
    5.9K
  • See @googleearth's full profile

    Sign up
    Log in
Advertisement
Advertisement