January not only marked our 5th anniversary but it was also our best month yet in terms of MRR growth! We’re celebrating these milestones with our first logo redesign in all this time. Here’s to the next 5 years! 🙏😍🎉
Now you can see your revenue in funnels!
See how many visitors completed a defined journey, how much revenue they generated, and the average revenue per visitor.
Our goal: make sophisticated funnel analysis feel like normal web analytics.
After the redesign, Funnels have gotten another major upgrade:
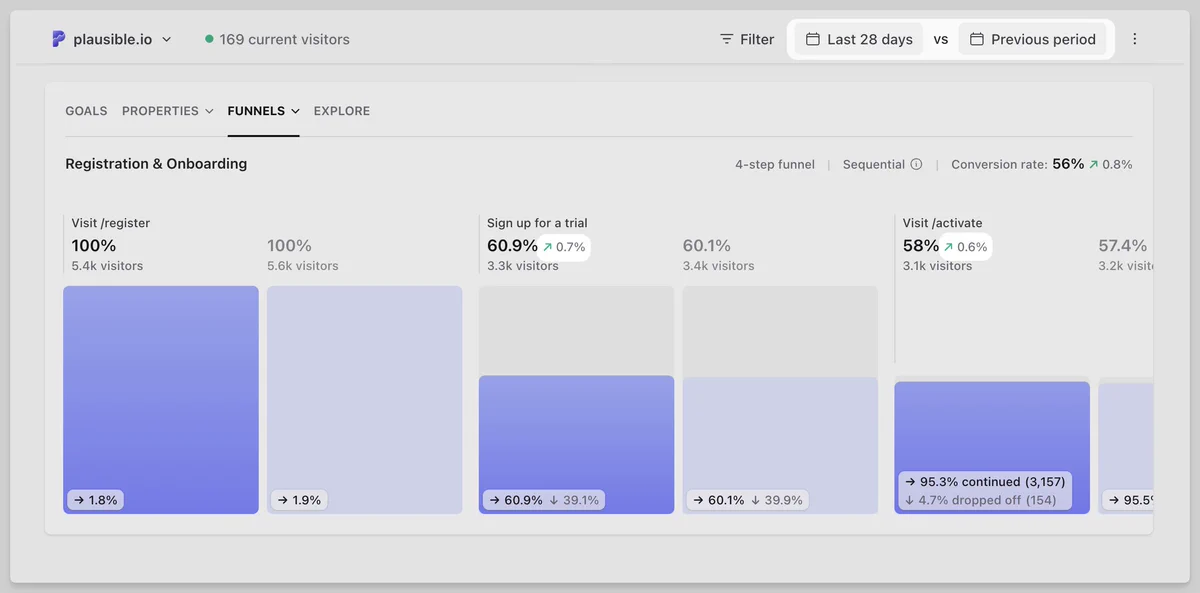
Earlier, you could only see funnels for a selected time range.
Now, you can also compare them (each individual step) across different time ranges.
Simply enable comparison in the date range selector, and see how
We redesigned Plausible Funnels. ✨
Before: simple bar graph with useful info at a glance.
Now:
✓ more elegant
✓ easier to scan
✓ gives more useful info at a glance
You see what percentage of visitors reached each step, how many continued, and how many dropped off.
The
We redesigned Plausible Funnels. ✨
Before: simple bar graph with useful info at a glance.
Now:
✓ more elegant
✓ easier to scan
✓ gives more useful info at a glance
You see what percentage of visitors reached each step, how many continued, and how many dropped off.
The
We improved our bot filtering over night so your stats won't get polluted.
What's new? Bots have gotten smarter. They run real browsers, use residential IPs, and have become better at mimicing actual visitor behavior.
We identified several new patterns like these and updated