Viewing Website Statistics in cPanel
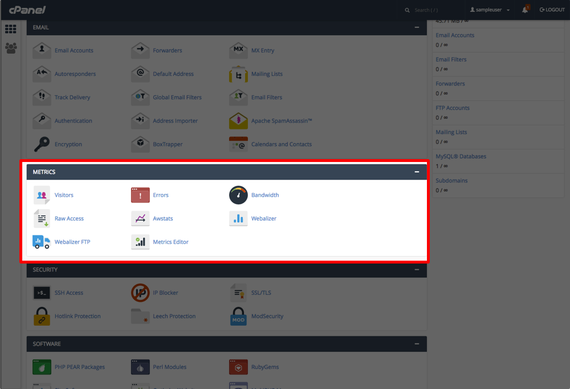
cPanel has a number of tools you can use to view your website statistics on a per site basis. Viewing the information in the Metrics section of cPanel, you can view the visitors to your webserver, errors, bandwidth use as well as FTP logins and usage statistics using Webalizer. This article will go through the Metrics section of cPanel to help you understand the information found in each place.
This tutorial assumes you are already logged into cPanel. If you need help, see our article Logging Into cPanel.
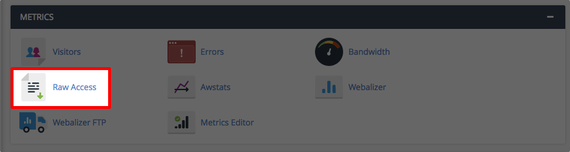
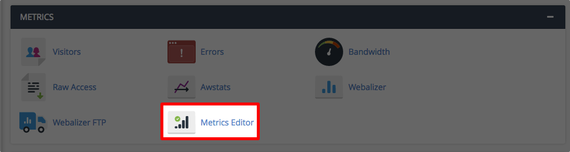
The Metrics section is found on the home page of your cPanel account.
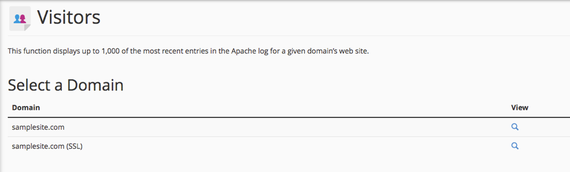
Visitors
This section shows a list of IP addresses that have visited your website in the last 24 hours.
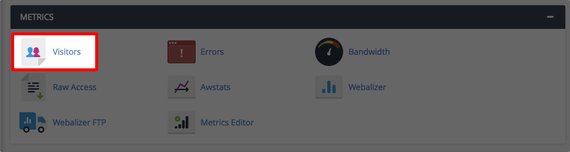
- Choose the domain you wish to view the visitor statistics for by clicking the


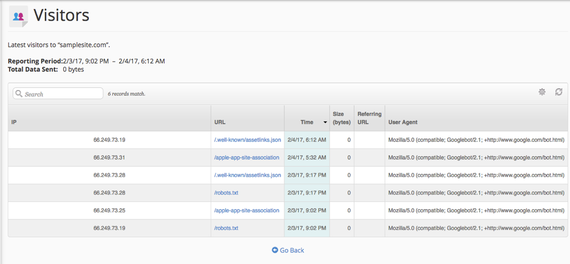
- You will notice, most of the visits are from Google bots and the reporting period is extremely narrow.

- A better way would be to view the logs via command line. The file path to view is:
/home/cpaneluser/logs/
FilePath Adjustment
In the file path example above, make sure to replace cpaneluser by the actual user name you want to see the cPanel visitor log for. From here you can open the log you want by the month it was created and view the visitors to your site. Log files from this directory will be compressed files.

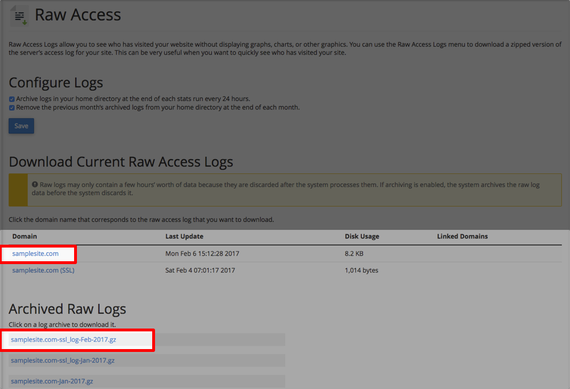
Raw Access
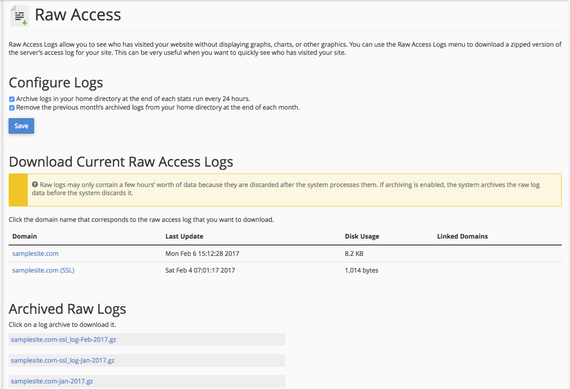
- This will give you a raw file that you can download and open to quickly view the server’s access log for your site. It will not display any charts, graphs or any graphics.

- You will see a listing of your sites and archived logs on the home page.

- Click on the Domain link or any of the Archived Raw Logs to download the access log.
- The file will save to your computer, download and open it with your text editor.
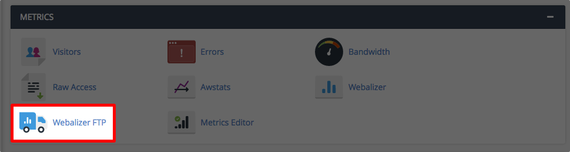
Webalizer FTP
- Click on the Webalizer FTP link to view the FTP statistics.
- The Webalizer FTP section provides statistics on FTP connections by month. Each month is a link for you to open.

- You will see monthly, daily, hourly and most used URL’s used by FTP by your domain.
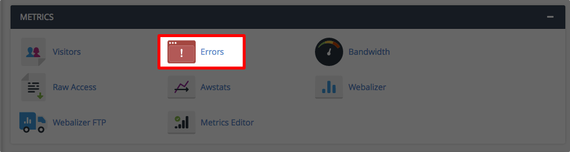
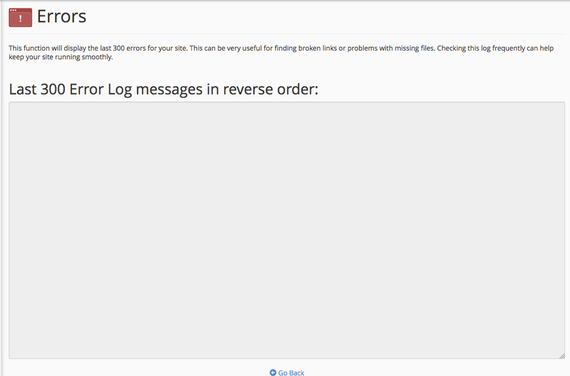
Errors
- To view site errors, select the Errors link in the Metrics section.
- You will see the last 300 errors on your site. This can help keep your site running smoothly by notifying you of any broken links or missing files.

AWStats
AWStats provides you with visitor information as well as site searches and downloads. It is best when used to understand visitor numbers from both humans and robots and the amount of bandwidth being used. It is a tool meant to troubleshoot bandwidth issues and detect if someone is hotlinking images or document files.
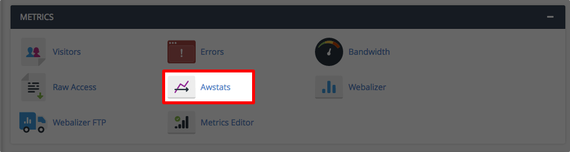
- Click the

AWStats vs Google Analytics
It is important to note that AWStats does not work the same way as Google Analytics. While much of the information in AWStats is similar to Google Analytics, the data displayed is gathered differently. If someone views a page they looked at on a previous day or week, the session will not be measured. The reason for this is that AWStats defines visits based solely on IP address and user agent. However, some bots will also visit with an IP address and user agent, so actual visits may be inflated. 
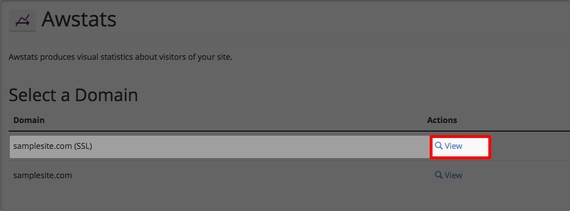
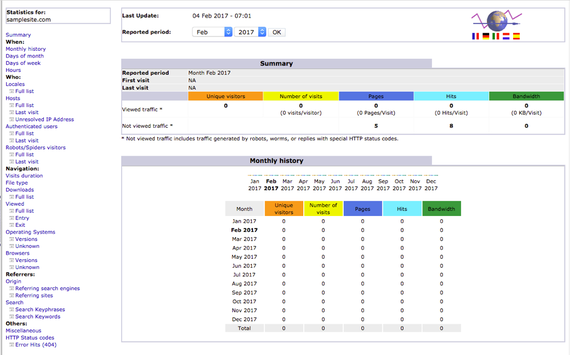
- You can search by month and year to get the statistics for a given period of time.


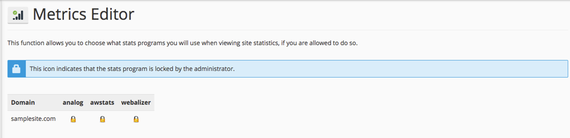
Metrics Editor
- You can see the stats programs being used for site statistics on your domain.
- This section should show all being locked by the administrator to ensure that they are installed and being utilized.

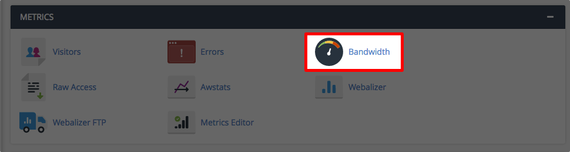
Bandwidth
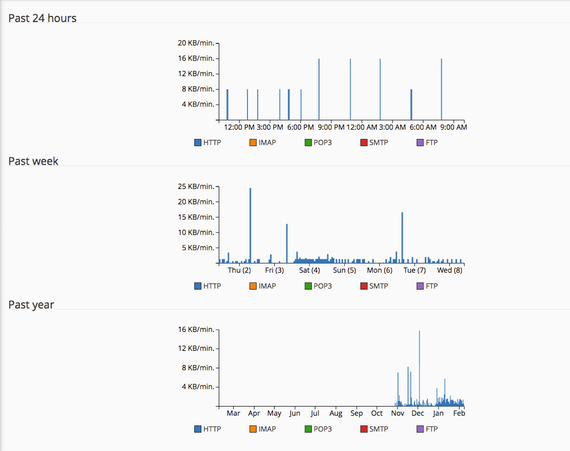
Keep track of the bandwidth your site is using. This includes HTTP and mail usage. FTP usage may be included if you have enabled FTP bandwidth logging.
- Your bandwidth usage is broken down into the last 24 hours, past week and past year. The graphs make it easy to see spikes in traffic over time.

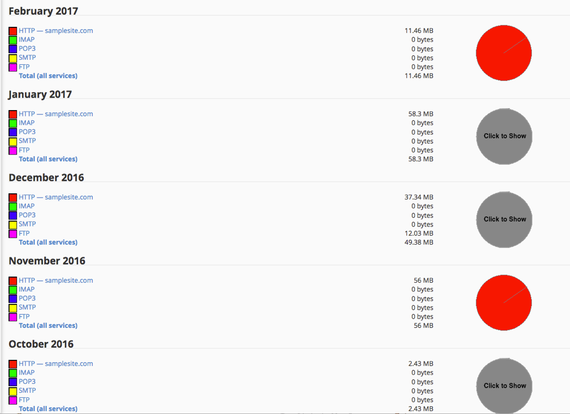
- You can see monthly bandwidth usage broken down by the service.

- Click on the service (http, imap, smtp, etc) to see individual breakdowns of bandwidth.

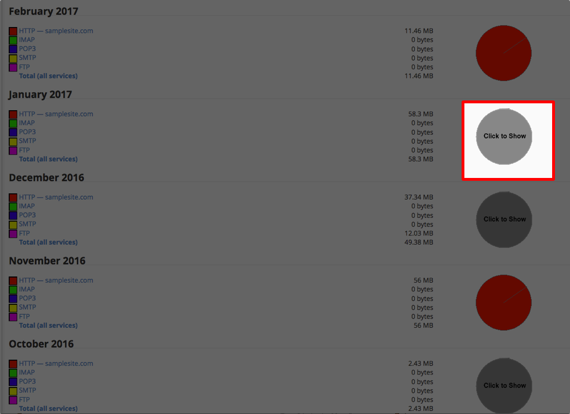
- To see a daily breakdown of all services in a month, click on the pie chart on the right-hand side of the page.
Webalizer
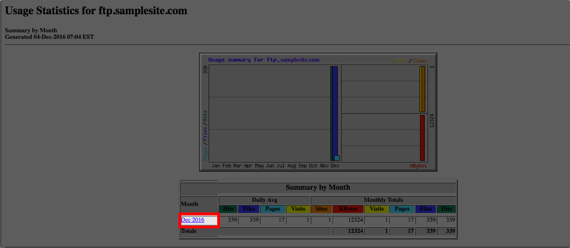
Just like with the Webalizer FTP, this section analyzes the usage by month on your site. It also tracks visits and kilobytes used for bandwidth.
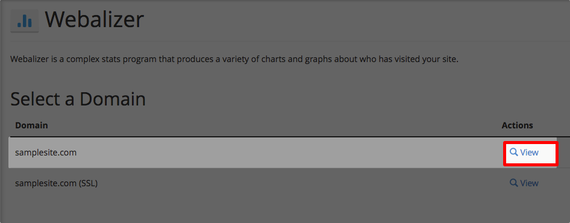
- Click on the

- You can view a summary by month by clicking on the link for that month. Here you will see monthly, daily and hourly statistics as well as the top visits and agents visiting your site for that month.