R is an open-source programming language used for statistical computing, data visualization and data analysis. It is popular in data science, machine learning and research due to its large ecosystem of packages and community support.
1. How to install and load a package in R?
You can install a package using the install.packages() function and load it with the library() function:
R
install.packages("ggplot2")
library(ggplot2)
Here, ggplot2 is installed from CRAN (Comprehensive R Archive Network) and then loaded into the current R session.
2. What is a data frame in R?
A data frame is a table-like structure in R where data is stored in rows and columns. Each column can have a different data type, unlike a matrix. It is used for handling datasets.
R
df <- data.frame(Name=c("Amit","Riya"), Age=c(25,22))
df
Output Name Age
1 Amit 25
2 Riya 22
3. Explain different data types in R.
- Numeric: Decimal values, e.g., 3.14.
- Integer: Whole numbers, e.g., 5L.
- Character: Strings, e.g., "Hello".
- Logical: TRUE/FALSE values.
- Complex: Numbers with real and imaginary parts.
- Factor: Categorical variables with levels, e.g., gender.
4. How to read a CSV file in R?
You can use the read.csv() function:
R
data <- read.csv("file.csv")
This loads the CSV file into a data frame for analysis.
5. What is the difference between a vector and a list?
- Vector: Stores elements of the same type (numeric, character, etc.).
- List: Can hold multiple data types in one object.
R
vec <- c(1,2,3)
lst <- list(1,"R",TRUE)
6. Explain for loop and while loop in R.
For loop: Executes code for each element in a sequence.
R
for(i in 1:5){ print(i) }
Output[1] 1
[1] 2
[1] 3
[1] 4
[1] 5
While loop: Executes as long as a condition is true.
R
x <- 1
while(x <= 5){ print(x); x <- x+1 }
Output[1] 1
[1] 2
[1] 3
[1] 4
[1] 5
7. How to check missing values in R?
- is.na() checks for missing values.
- complete.cases() checks for rows without NA values.
R
is.na(c(1,NA,3))
complete.cases(c(1,NA,3))
Output[1] FALSE TRUE FALSE
[1] TRUE FALSE TRUE
8. How to create a user-defined function in R?
Functions in R are defined using the function keyword:
R
add <- function(a, b) {
  return(a + b)
}
This makes R reusable and modular.
9. What is the difference between matrix and data frame?
- Matrix: Can only contain one data type (numeric, character or logical).
- Data frame: Can contain multiple data types across columns.
10. What are factors in R?
Factors in R are used to represent categorical variables. They store data as integer codes with corresponding labels, making them memory-efficient and useful in modeling. For example, storing gender as a factor instead of strings makes statistical operations easier.
R
gender <- factor(c("Male", "Female", "Male"))
This ensures categorical variables are handled correctly in regression and classification models
11. What is R Markdown?
R Markdown is a tool for creating dynamic documents that combine R code, output and narrative text. It is useful for reproducible reports, research papers and dashboards.
12. How to delete a column from a data frame?
You can remove columns by subsetting:
R
df_new <- df[ , !(names(df) %in% "column_name")]
13. Explain the use of summary() and str() functions.
- summary(): Provides a statistical summary of an object.
- str(): Displays the internal structure of an object.
14. How to create a bar plot in R?
R
counts <- table(df$Gender)
barplot(counts, col=c("blue","pink"), main="Gender Distribution")
Explanation: Bar plots are used to visualize categorical data and quickly interpret counts or proportions.
15. What is ggplot2 in R?
ggplot2 is a well-known R data visualization software that offers a strong and adaptable foundation for developing unique, publication-quality graphics. Its foundation is the idea of the grammar of graphics, which outlines a set of guidelines for producing visualizations.
R
library(ggplot2)

# Example data
data <- data.frame(x = c(1, 2, 3, 4, 5),
y = c(2, 4, 6, 8, 10))

# Create the plot
plot <- ggplot(data, aes(x, y)) +
geom_point()

# Display the plot
print(plot)
Output:
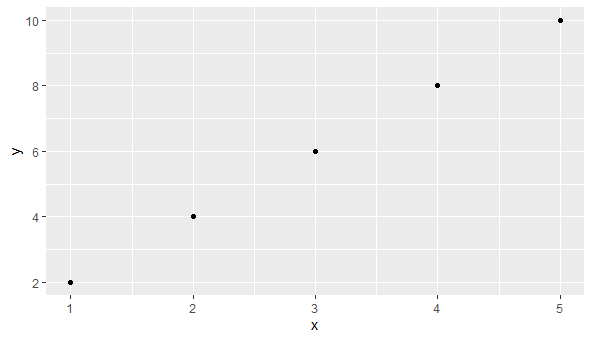 ggplot
16. What is the use of the dplyr package?
The dplyr package simplifies data manipulation tasks with easy-to-use functions. It introduces verbs like filter(), select(), mutate(), summarise() and arrange(), which can be chained using the pipe operator %>%.
R
library(dplyr)
iris %>% filter(Species == "setosa") %>% summarise(avg = mean(Sepal.Length))
It is used because it makes code more readable and concise.
17. How to concatenate strings in R?
The paste() or paste0() functions are used:
R
paste("Hello","World")
paste0("R","Lang")
Output[1] "Hello World"
[1] "RLang"
18. How to handle missing data in R?
Remove:
R
Replace:
R
19. How to create a heatmap of correlation matrix in R?
R
This generates a heatmap showing relationships between variables.
20. Create a 3D plot in R
A 3D plot is used to visualize the relationship between three variables simultaneously. It helps in understanding complex patterns and interactions that are difficult to see in 2D plots. In R, there are multiple ways to create 3D plots depending on whether you need static or interactive graphics.
Using plotly (interactive web-friendly 3D plots): The plotly package allows interactive 3D plotting with additional features like hover info and web integration.
R
install.packages("plotly")
library(plotly)

plot_ly(x = ~x, y = ~y, z = ~z, type = "scatter3d", mode = "markers")
Output:
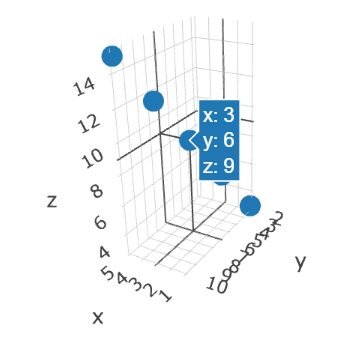 3 D plot
21. What is the difference between lapply() and sapply()?
- lapply(): Returns a list.
- sapply(): Simplifies output into a vector or matrix if possible.
R
lapply(1:3, sqrt)
sapply(1:3, sqrt)
Output[[1]]
[1] 1
[[2]]
[1] 1.414214
[[3]]
[1] 1.732051
[1] 1.000000 1.414214 1.732051
22. What is the difference between merge() and join functions in R?
- merge(): Base R function to combine data frames using common columns.
- join() functions (inner_join, left_join): Part of dplyr, more readable and easier for chaining operations.
R
Explanation: Using dplyr joins is often preferred in modern R code for readability and pipeline support.
23. What is the difference between merge() and cbind()/rbind()?
- merge(): Joins datasets based on common columns.
- cbind(): Combines columns side by side.
- rbind(): Combines rows vertically.
Explanation: cbind/rbind are simpler and useful when datasets have matching dimensions, while merge is used for relational joins based on keys.
24. What is the difference between plot(), qplot() and ggplot()?
- plot(): Base R plotting function, simple but less flexible.
- qplot(): Quick plotting in ggplot2, less code for basic plots.
- ggplot(): Fully customizable, professional-quality plots.
Explanation: Choosing depends on complexity and visualization requirements.
25. How to compute standard deviation and variance in R?
R
Explanation: Standard deviation and variance measure spread of data, important in statistics and modeling.
26. What is a p-value in hypothesis testing?
A p-value represents the probability of observing results at least as extreme as the current data, assuming the null hypothesis is true.
- A low p-value (<0.05) suggests strong evidence against the null hypothesis, leading to its rejection.
- A high p-value indicates insufficient evidence to reject it.
It is a key concept in statistical inference and hypothesis testing.
27. What is bootstrapping in R?
Bootstrapping is a resampling method used to estimate statistics by repeatedly sampling with replacement.
R
library(boot)
boot_mean <- function(data, indices) mean(data[indices])
boot(iris$Sepal.Length, boot_mean, R=1000)
It helps estimate confidence intervals when data assumptions are not clear.
Chi-square tests check the association between categorical variables.
R
tbl <- table(mtcars$cyl, mtcars$am)
chisq.test(tbl)
A low p-value suggests a significant association between variables.
29. Explain linear regression in R.
Linear regression models the relationship between a dependent variable and one or more independent variables using a straight line.
Example in R:
R
model <- lm(y ~ x, data = df)
summary(model)
The output provides regression coefficients, residuals, R² value and significance tests, which help in understanding the strength of the relationship.
30. What is multiple linear regression in R?
Multiple linear regression models the relationship between one dependent variable and multiple independent variables.
R
model <- lm(mpg ~ wt + hp + cyl, data=mtcars)
summary(model)
This helps analyze how different predictors jointly affect the response.
31. What is logistic regression in R?
Logistic regression is used when the dependent variable is binary (e.g., yes/no, 0/1). Instead of predicting a continuous value, it predicts the probability of an event occurring.
Example:
R
model <- glm(y ~ x, data = df, family = binomial)
The coefficients are interpreted in terms of odds ratios, making it useful for classification problems such as spam detection or disease prediction
32. What is regularization in R?
Regularization is a technique used to prevent overfitting in machine learning models by adding a penalty term to the loss function. This discourages overly complex models. In R, it can be implemented with the glmnet package.
- Ridge Regression: Uses L2 penalty, shrinks coefficients but doesn’t set them exactly to zero.
- Lasso Regression: Uses L1 penalty, can shrink coefficients to zero (feature selection).
- Elastic Net: Combines both L1 and L2 penalties for balanced regularization.
33. What is data normalization in R?
Normalization is the process of scaling numerical features so they lie within a standard range (commonly 0–1). This ensures all variables contribute equally in models like distance-based algorithms (e.g., KNN).
Formula:
R
(x - min(x)) / (max(x) - min(x))
This helps improve model performance and convergence speed.
34. What is time series analysis in R?
Time series analysis deals with data recorded over time intervals (daily sales, stock prices, weather data). The goal is to identify patterns like trends, seasonality and to make forecasts.
R provides packages such as:
- forecast : ARIMA and exponential smoothing.
- xts, zoo : Handling and manipulating time series data
35. How to create a decision tree in R?
A decision tree is a supervised learning algorithm used for classification and regression tasks. In R, the rpart package is commonly used:
R
library(rpart)
model <- rpart(Species ~ ., data = iris)
This builds a decision tree on the iris dataset to classify flower species.
36. What is multicollinearity in R and how to detect it?
Multicollinearity means predictors are highly correlated, making regression unstable.
- Detect using Variance Inflation Factor (VIF):
R
library(car)
vif(lm(mpg ~ wt + hp + disp, data=mtcars))
High VIF (>10) indicates multicollinearity.
37. What are generalized linear models (GLM) in R?
GLMs extend linear models to handle non-normal response variables. Examples:
- Logistic regression (binary outcomes).
- Poisson regression (count data).
R
glm_model <- glm(vs ~ mpg + wt, data=mtcars, family=binomial)
summary(glm_model)
They allow modeling beyond just continuous outcomes.
38. What is Poisson regression in R?
Poisson regression is used for modeling count data.
R
model <- glm(count ~ predictor, family=poisson, data=df)
It assumes counts follow a Poisson distribution and is common in healthcare and traffic studies.
Hierarchical clustering builds a hierarchy of clusters using distance measures.
R
d <- dist(iris[,1:4])
hc <- hclust(d)
plot(hc)
Unlike K-means, it does not require specifying the number of clusters beforehand.
40. What is dimensionality reduction in R?
Dimensionality reduction reduces features while retaining essential information.
Methods:
- PCA (Principal Component Analysis).
- t-SNE for visualization.
R
library(Rtsne)
tsne <- Rtsne(iris[,1:4])
plot(tsne$Y)
It is useful for high-dimensional datasets like images or text.
41. What is Kaplan-Meier survival curve in R?
The Kaplan-Meier estimator estimates survival probabilities over time.
R
library(survival)
fit <- survfit(Surv(time, status) ~ 1, data=lung)
plot(fit)
It is widely used in clinical trials to analyze patient survival rates.
42. What is the caret package used for in R?
The caret (Classification And REgression Training) package provides a unified framework for building machine learning models.
R
library(caret)
train(Species ~ ., data=iris, method="rf")
It supports preprocessing, model training, cross-validation and hyperparameter tuning.
43. How to build a random forest model in R?
Random Forest is an ensemble method that builds multiple decision trees.
R
library(randomForest)
rf <- randomForest(Species ~ ., data=iris, ntree=100)
rf
It handles non-linear relationships well and reduces overfitting.
44. What is XGBoost in R?
XGBoost is an optimized gradient boosting library for high performance.
R
library(xgboost)
model <- xgboost(data=as.matrix(iris[,1:4]), label=as.numeric(iris$Species)-1,
                 nrounds=10, objective="multi:softmax", num_class=3)
It is popular in Kaggle competitions due to speed and accuracy.
45. How does lazy evaluation work in R?
In R, function arguments are not evaluated until they are actually used inside the function body.
R
f <- function(x, y) {
  return(x^2)
}
f(2, stop("Error!")
Here, no error occurs because y is never used.
Lazy evaluation improves performance by avoiding unnecessary computation.
46. What is the apply() function in R?
The apply() function is used to apply a function to the rows or columns of a matrix or array. It helps reduce loops in code.
R
m <- matrix(1:9, nrow=3)
apply(m, 1, sum)   # Sum of rows
apply(m, 2, mean)  # Mean of columns
This makes data processing faster and more concise.
Performance in R can be improved using:
- Vectorization instead of loops.
- Using data.table for large datasets.
- Parallel processing with parallel or foreach.
R
library(parallel)
mclapply(1:5, function(x) x^2, mc.cores=2)
Optimizations are important when working with big data
48. How does memory management work in R?
R uses garbage collection to free unused memory automatically. Large objects can be removed manually using rm() and memory can be checked with gc(). Efficient memory management is important for handling big data.
49. What is the difference between R and Python for data science applications?
R is stronger in statistical analysis and visualization, while Python excels in general-purpose programming and machine learning frameworks. Many professionals use them together depending on the task.
R can connect with big data ecosystems using packages like sparklyr (for Spark) and RHadoop. This allows data scientists to process and analyze massive datasets that cannot fit into memory.
Explore
Introduction
Fundamentals of R
Variables
Input/Output
Control Flow
Functions
Data Structures
Object Oriented Programming
Error Handling
File Handling