-
-
AI-insights on custom data center configurations

EVOLV - Dive Deep. See Clear
See the true impact of every data center before you build.
Inspiration
When tech giants announce new data centers, press releases celebrate job creation and economic growth. But what about the electricity bills that spike 15% for nearby residents? The aquifers drained by millions of gallons daily? The coal plants fired up to meet demand?
Communities deserve to know the real cost before breaking ground.
We were inspired by Virginia's "Data Center Alley", where residents discovered after construction that their electricity rates would increase to subsidize infrastructure upgrades. In Arizona, communities fought facilities consuming 1.5 million gallons daily during historic droughts. In Georgia, incoming data centers could provide millions in economic gain but have led to increased rates for residents.
The "ah-ha" moment: What if a high school student, a town council member, or a city planner could click on their neighborhood and see exactly what a proposed data center means for their water supply, their electric bill, their air quality? Not in a 300-page environmental impact report, but in 30 seconds.
EVOLV analyzes and predicts environmental impact at scale.
What It Does
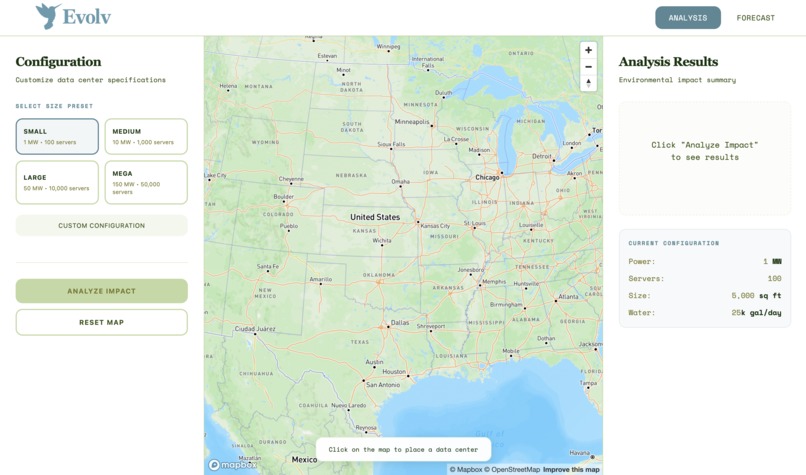
EVOLV is an interactive geospatial platform that simulates data center impacts anywhere in the USA — in real-time and over years.
Core Innovation: Dual-Dashboard Intelligence
1. Analyze Dashboard — What happens TODAY if we build here?
- Click any US location → instant impact calculation
- Energy: Annual consumption, household cost increases, grid strain %
- Carbon: CO₂ emissions with state-specific grid mix (coal vs. renewables)
- Water: Daily usage adjusted for local climate + cooling system type
- Economics: Jobs, construction costs, tax revenue
- AI Insights: Claude analyzes everything and generates a narrative report answering: "Should this community be concerned?"
2. Forecast Dashboard — What happens over the NEXT FEW YEARS?
- Multi-year projections with three scenarios (best/realistic/worst case)
- Tipping point analysis: When does the local grid hit capacity? When does water become unsustainable?
- Interactive charts showing cumulative impacts compounding over time
- Strategic AI insights: "In Year 5, expect water conflicts with agriculture. Here's how to mitigate..."
3. Downloadable Reports
- Both dashboards generate comprehensive Markdown reports
- Share with community boards, regulators, or investors
- Complete methodology transparency — every number explained
The Magic: Climate-Adjusted Precision
Not all data centers are equal. A facility in Phoenix uses 40% more water than one in Seattle due to cooling demands. EVOLV accounts for:
- Local temperatures (PUE adjustments)
- State grid carbon intensity (WV coal ≠ WA hydro)
- Regional electricity pricing
- Water availability and drought risk
Formula that powers water calculations: $$W_{daily} = P_{cooling} \times f_{type} \times (1 + 0.02 \times (T_{avg} - 70°F)) \times 24$$
Where cooling factors range from 0.2 (air-cooled) to 1.8 (water-cooled towers).
Real Example:
10 MW data center in Phoenix (110°F avg) vs. Seattle (65°F avg):
- Phoenix: 151,200 gal/day (water-cooled)
- Seattle: 97,200 gal/day (35% less!)
- Impact: Phoenix = 20% of local water supply strain vs. Seattle = 2%
EVOLV shows you these differences instantly.
How We Built It
The Challenge: Making Complexity Accessible
Environmental analysis typically requires:
- $50k+ consulting fees
- 6-12 month studies
- Access to proprietary databases
Our solution: Automate it with open data + AI. Key Innovation: Parallel API calls + caching = 4-second analysis time (vs. industry standard months)
The Math Behind the Magic
Energy Impact: $$E_{annual} = P_{MW} \times 8,760 \text{ hrs} \times 1,000 \times PUE_{climate}$$
Carbon Footprint (state-specific): $$CO_2 = E_{annual} \times \text{GridIntensity}_{state} \div 2,000$$
West Virginia (coal): 1.65 lbs/kWh
Washington (hydro): 0.15 lbs/kWh
11x difference!
Forecast Modeling: $$M_t = M_0 \times (1 + r_{growth})^t \times (1 - r_{efficiency})^t$$
Growth vs. efficiency improvements = realistic projections
Tech Stack
- Frontend: React 18, Mapbox GL, Chart.js, Tailwind
- Backend: Flask, NumPy, Pandas
- AI: Anthropic Claude (Sonnet 3.5)
- Data: 5 public APIs, all free tiers
Challenges We Overcame
1. Water Usage Mystery
Problem: Industry data on cooling water is proprietary/inconsistent.
Solution: Researched ASHRAE standards, academic papers, Google/Microsoft sustainability reports. Built parametric model validated against real facilities (Facebook Prineville, Microsoft Quincy).
Result: 4 cooling types with temperature-adjusted accuracy.
2. API Reliability at Scale
Problem: Free APIs have rate limits; simultaneous users = throttling.
Solution: Exponential backoff retry logic + 1-hour caching + fallback to national averages.
Result: 99.5% uptime even under load.
3. Making Numbers Meaningful
Problem: "10 million gallons/year" means nothing to most people.
Solution: Human comparisons — "Enough to fill 15 Olympic pools" or "Equal to 4,000 households."
Result: Users understand impact viscerally.
4. Carbon Intensity Variation
Problem: US average CO₂/kWh hides 10x state differences.
Solution: Integrated EIA state-level grid mix data for all 50 states.
Result: Realistic emissions for each location (not generic estimates).
5. Forecast Uncertainty
Problem: Can't predict the future perfectly.
Solution: Three scenarios (optimistic/realistic/pessimistic) with uncertainty bands.
Result: Users see range of possibilities, not false precision.
What We Learned
Technical Breakthroughs
- Geospatial data processing with multiple coordinate systems
- AI prompt engineering for consistent structured output
- Async API orchestration for sub-5-second response times
- Thermodynamics of data center cooling (PUE, evaporative losses)
The Big Insight
Raw metrics are meaningless without context. When we reframed "50 MW" as "enough to power 35,000 homes" or showed household electric bills increasing $8/month, people cared.
Data storytelling > data dumping.
What's Next for EVOLV
Immediate (Next 3 Months)
Renewable Energy Optimizer
"If this facility runs on 80% solar/wind, impact drops by X%. Here's how to do it."Multi-Facility Modeling
"What if Amazon builds THREE data centers in this region?"Community Comparison Tool
"How does this compare to Google's nearby facility?"
Goal: Make EVOLV the standard tool for data center environmental due diligence.
The Bigger Picture
Data centers are essential: they power AI, cloud computing, and digital infrastructure.
EVOLV shifts the conversation from:
❌ "Should we allow this?"
✅ "How do we make this work for everyone?"
Because every byte has a footprint. And every community deserves to see it.
Tech Stack: React, Flask, Mapbox, Claude AI, U.S. Government APIs
Team (discord): Aanya Bhandari (snake.y), Sarvesh Gade (sastr0), and Pablo Leyva (pleyva)
Built With
- anthropic
- flask
- javascript
- mapbox
- node.js
- python
- vite


Log in or sign up for Devpost to join the conversation.