-
-
Home Page
-
-
-


ProjectSendHelp
Inspiration
The movie Project Hail Mary stuck with us — not just as a sci-fi story, but as a reminder that in the most desperate moments, the right information in the right hands can change everything. That idea of using every tool available to solve problems that feel unsolvable drove ProjectSendHelp from the start.
Natural disasters are some of the most chaotic and isolating events a community can face. When a hurricane or wildfire tears through a region, it doesn't just destroy buildings — it takes down cell towers, cuts off roads, and leaves people completely unreachable. Emergency responders are flying blind, spending precious hours trying to understand the scope of damage before they can even begin helping. There's no quick answer to "where do I go first?" And for people isolated in affected areas, unable to call for help, those hours matter enormously.
We wanted to build something that leverages the technology we already have — satellite imagery, deep learning, and real-time data — to close that gap. To take the 48-hour assessment window that FEMA typically works within and compress it as much as we could.
What it does
ProjectSendHelp is a disaster intelligence dashboard that gives first responders instant awareness after a disaster strikes.
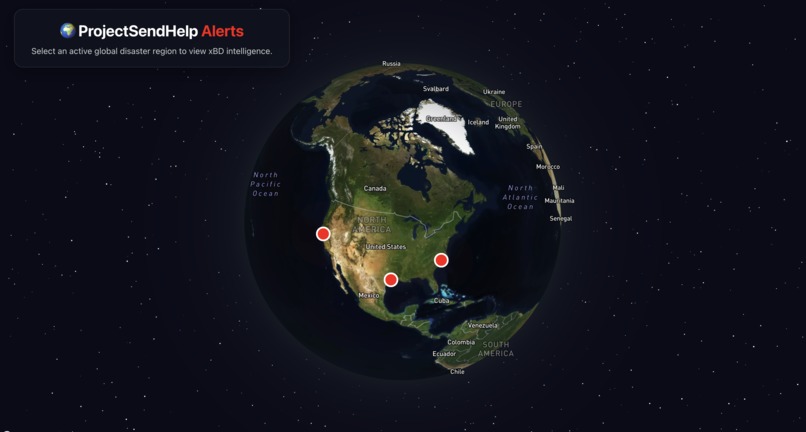
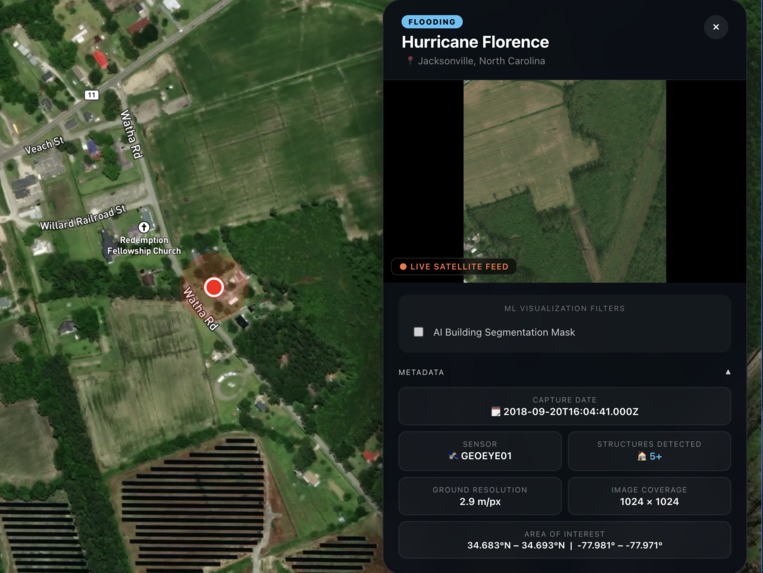
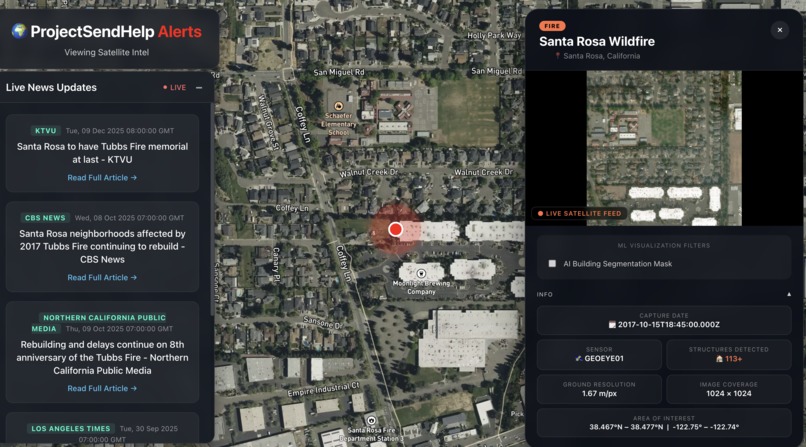
When a disaster event is detected, the platform renders it as a live alert on a photorealistic 3D globe. Clicking the alert zooms into the affected zone and opens a satellite intelligence panel showing a post-disaster image of the area. An AI building segmentation model then overlays detected building footprints directly on the image, immediately showing responders where structures exist and which areas are densely affected.
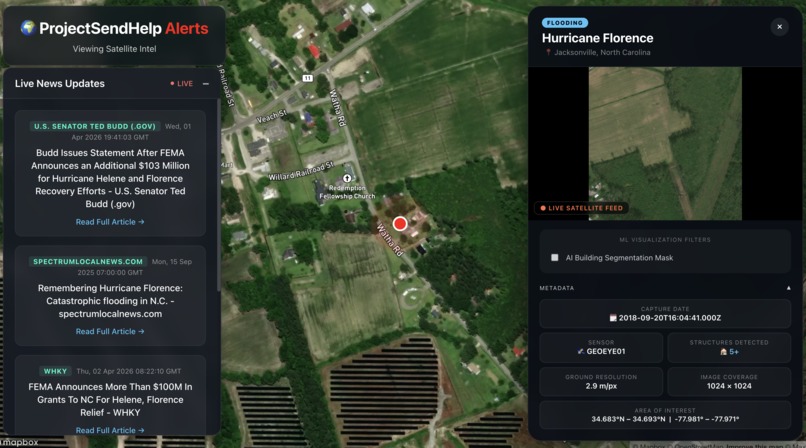
The platform also pulls real-time news for each event and surfaces a live social intelligence feed, simulating the kind of keyword-monitoring pipeline a production system would run against emergency data streams. Access to the system is gated by World ID — a Proof-of-Human verification system — to ensure only verified individuals can interact with the emergency infrastructure and report damage. No bots!!
How we built it
The frontend is built in React with Mapbox GL JS powering the 3D globe. Each disaster hotspot is rendered as an animated pulsing beacon, and clicking one triggers a smooth globe fly-to and opens a detailed overlay panel with the satellite imagery and ML-generated annotations.
The backend is a FastAPI server in Python that serves disaster alert data and runs ML inference. We trained four deep learning models in TensorFlow/Keras on the xBD dataset — the industry-standard benchmark for satellite disaster assessment with over 850,000 annotated building footprints across 19 disaster types. The building segmentation model uses a U-Net architecture that outputs a per-pixel probability mask, which we then process with OpenCV to extract building contours and render them as SVG polygons over the satellite image.
World ID integration uses Worldcoin's IDKit SDK on the frontend and HMAC-signed RP context generation on the backend to create a sybil-resistant verification flow.
Challenges we ran into
World ID: The World ID simulator website was down during development, which made it impossible to fully test the verification flow end-to-end. We built and integrated the full auth pipeline but couldn't validate it in simulation.
Model training: Training four separate deep learning models under time pressure was brutal. The building segmentation U-Net alone took over 3 hours per training run on local hardware, and the models consumed significant memory — loading multiple .h5 files simultaneously pushed against our RAM limits. We had to implement a startup warm-up thread to preload models into memory so inference wouldn't time out on first request.
Model accuracy: Getting the disaster type classifier to generalize across 6 very different disaster categories with limited training data was difficult. The building segmentation model also required careful threshold tuning — the model's activations peaked at around 0.72 rather than the expected 1.0, so the standard 0.5 threshold returned almost no results until we profiled the output distribution and tuned accordingly.
Accomplishments that we're proud of
- Getting four trained deep learning models into a live production pipeline that actually runs and serves real predictions through an API.
- The building segmentation overlay working end-to-end — real xBD satellite image in, real U-Net inference, real SVG polygons rendered in the browser.
- Building a genuinely cinematic interface that communicates urgency: the globe, the pulsing alerts, the satellite imagery panel — it feels like the kind of tool that would actually be used in an emergency operations center.
- Achieving 93.4% accuracy on building segmentation — a very good result on a hard computer vision task.
What we learned
We came in knowing bits and pieces of the stack, but this project forced us to actually connect it all. We learned how to build and train U-Net segmentation architectures, tune confidence thresholds for model outputs, and extract polygon contours from probability masks using OpenCV. On the API side, we got hands-on with FastAPI's async patterns, static file serving, and startup event hooks. Integrating World ID taught us how Proof-of-Human systems work at a protocol level — HMAC signing, ZKP verification flows, and the Worldcoin developer stack. And working with the Mapbox GL JS globe projection, fog layers, and GeoJSON rendering gave us a solid foundation in geospatial visualization.
What's next for ProjectSendHelp
The most immediate priority is implementing a pathfinding engine that helps first responders navigate in active disaster zones. When roads are flooded or blocked by debris, responders need more than a satellite view — they need a route. We're building an A* pathfinder that takes damage assessments as input, maps the affected area as a weighted graph, and computes the optimal path from a responder's current location to any target coordinate while avoiding known hazards. This would make ProjectSendHelp not just a damage assessment tool, but a true operational guide for first responders in the field.
Beyond that, we want to incorporate real-time satellite tasking (automatically requesting new imagery the moment an alert is triggered), WebSocket-based live updates so the globe reflects the most current data without needing a page refresh, and expanded disaster event coverage across more geographic regions.

Log in or sign up for Devpost to join the conversation.