-
-

Startup burner, How much do you have left to burn?
-
Startup burner - dark mode


Startup Burner is a dashboard for command level thinking about your startups health. (prototype)
Inspiration
After you've built it how do you keep it running? how do you even know it's running or when it might stop?!?
Founders and startup teams often struggle to see the true relationships between their metrics because data is siloed across different tools (AWS for infra, Stripe for revenue, GitHub for velocity). So I started to build a unified, highly customizable command center. Instead of just showing static numbers, this empowers founders to define their own derived metrics and visually compare them to make rapid, data-driven strategic decisions.
What it does
Startups aren't like a car you can just pop the hood and check the engine oil. Surface the decision making metrics you need in one place for the next killer app your building.
Startup Burn is a dynamic, interactive metrics dashboard tailored for startups. It tracks core KPIs like MRR, Burn Rate, Cash Balance, and Active Users. Its standout features include:
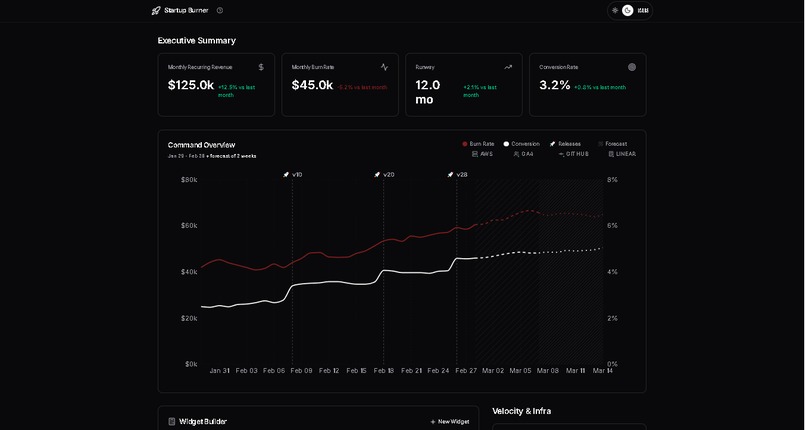
- Executive Overview Chart with runway forecasting: A centralized, at-a-glance visualization of the startup's core vitals. It aggregates primary metrics to provide an immediate pulse check on the company's financial trajectory, runway, and overall health before diving into deeper analysis.
- Custom Widget Builder: Users can write their own formulas (e.g., cash_balance / burn to calculate Runway, or burn / active_users for Burn per User) to generate bespoke insights.
- Compare Builder: A visual tool to pit two custom metrics against each other side-by-side (e.g., Burn per User vs. Revenue per User), using conditional styling and dynamic chevrons to instantly show if the business is healthy. Immersive Theming: Includes standard Light/Dark modes, plus a fun, sci-fi inspired "LCARS" theme for a true command-center feel.
How I built it
I built the frontend using React (Vite) and Tailwind CSS for rapid, responsive, and highly customized styling. For state management, I used Zustand, which allows the dashboard to instantly react and re-calculate formulas when underlying metrics change. I integrated Framer Motion for smooth, polished UI transitions and Lucide React for clean iconography. The core formula engine was built using a dynamic parsing system that maps user-defined text equations to real-time state variables.
- Ai-studio
- Nodejs
- TypeScript
- Recharts (for overview chart)
- Zustand (state management)
- Framer Motion
- Tailwind CSS
- Lucide icons
Challenges I ran into
Sample data for series forecasting
Building a dynamic formula evaluator can a significant challenge for all the ways one can do that. It needs to safely parse user input, map string variables (like infra_cost) to live state numbers, and handle edge cases like division by zero or incomplete formulas without crashing an app. Additionally, designing the Compare Builder past a beta state would required complex conditional logic to determine emphasis for visual feedback—especially since "greater than" isn't always "better" (e.g., higher revenue colored green is good, but higher burn colored green is confusing).
Accomplishments that I'm proud of
Turn around time for prototype.
I are incredibly proud of iterating on the Overview charts UX language, and getting the Custom Widget and Compare Builder engines to workable states. Giving users the power to define their own math and instantly see it visualized makes the dashboard feel like a professional analytics tool rather than a static template. Also pleased with the polished UI for the easter-egg LCARS theme that completely transforms the layout and typography of the app for an aesthetic that can create a different mindset towards operating a startup.
What I learned
Leared more about "open startup" where businesses publicly share internal data.
Deepened my understanding of dynamic state management using Zustand, especially when dealing with derived state (widgets that rely on the state of other metrics). I also learned more about building extensible, defensive UI components that can gracefully handle unpredictable, user-defined data and formulas.
What's next for Startup Burn
The immediate next step is to turn my mocked integrations (AWS, Google Analytics, GitHub, and Gemini) into live data pipelines using real OAuth and API connections. Introduce historical charting (using libraries like Recharts) so founders can see how their custom formulas trend over time. Develop a new visual language for building in mental safety against mishandling uncertainty when presenting forecasting/projections by using animations and user interaction. Add an elevate option to each area to let users move parts of the dashboard around so users must consider what is import, and not waste time drag an dropping parts endlessly in analysis paralysis. Finally, I'd want to fully integrate the LLM APIs or agents to act as AI co-founder(s) to analyzes the dashboard and proactively alerts the team to alarming burn trends or optimization opportunities.
Built With
- aistudio
- css3
- html5
- node.js
- react
- typescript
- ux

Log in or sign up for Devpost to join the conversation.