


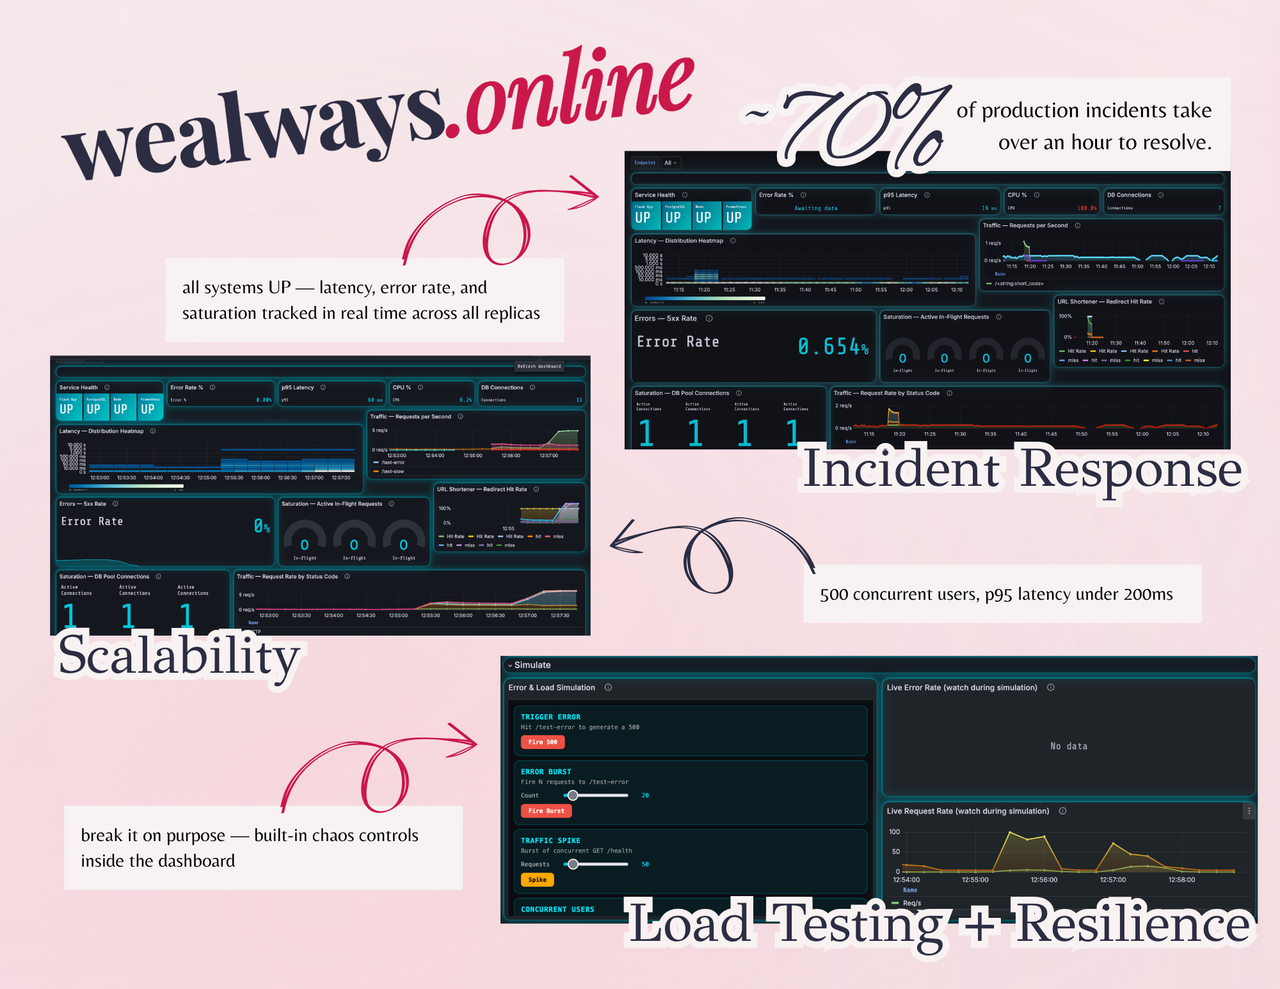
~70% of production incidents take over an hour to resolve — not because engineers aren't smart, but because they're flying blind.
The on-call problem 📲
"i got paged at 3am and had no idea where to even start." — every on-call engineer, eventually.
most teams treat observability as an afterthought. metrics live in one place, logs in another, alerts fire into a void, and the runbook — if one exists — is a stale Google Doc nobody's touched since the last person who understood the system left.
the result: mean time to detect (MTTD) and mean time to resolve (MTTR) balloon. users notice before engineers do. incidents become firefights instead of investigations.
url shortener (but make it production-grade)
a URL shortener is the simplest possible web service — which makes it the perfect canvas for demonstrating what real production readiness looks like.
we built a URL shortener and then wrapped it in a complete incident response stack: structured logging, prometheus metrics, grafana dashboards wired to the 4 golden signals, alertmanager firing to discord, and a runbook that tells you exactly what to do when things break.
the chaos scripts let you break things on purpose. the dashboard tells you what broke and when. the runbook tells you how to fix it.
🚨 Track: incident response
🥉 bronze — stop using print statements
- structured json logging with timestamps, log levels, and per-request context (method, path, status, duration, client ip)
- /metrics endpoint exposing prometheus-format metrics: request counts, latency histograms, active in-flight requests, redirect cache hit/miss
🥈 silver — wake up the on-call engineer
- ServiceDown and HighErrorRate alert rules wired through alertmanager
- discord notifications via a custom webhook relay — alerts fire within 5 minutes of failure:
- On-call Engineer needs to acknowledge issue within 30 mins otherwise it gets escalated to higher up
- re-pings every 10 mins until acknowledged
- Once acknowledged a temporary channel for the issue will be opened to communicate
- Engineers can also manually escalate the issue to ping higher-ups if issue is out of their scope
- On-call Engineer needs to acknowledge issue within 30 mins otherwise it gets escalated to higher up
- bonus: HighLatencyP95 alert fires when p95 latency exceeds 2s for 2+ minutes
- Alert Logic Configuration: link
🥇 gold — total situational awareness
- grafana dashboard covering all 4 golden signals (latency, traffic, errors, saturation) + infrastructure and postgresql internals rows
- RUNBOOK.md with a playbook for every alert: what it means, step-by-step diagnosis, copy-paste fix commands, severity guide
- chaos scripts (scripts/chaos.py) simulate high error rate, traffic spikes, and slow db — root cause diagnosable using only the dashboard and logs
🚀 Track: scalability
🥉 bronze — measure before you guess
- k6 load test at 50 concurrent users
- documented baseline p95 response time and error rate before any optimization
🥈 silver — one server isn't enough
- 2 gunicorn app containers behind nginx, spun up via docker compose
- load test at 200 concurrent users, response times under 3 seconds
- nginx handles load balancing across replicas with health checks
🥇 gold — the tsunami test
- redis caching on short code lookups — cache hits skip the db entirely
- pgbouncer connection pooling to prevent db saturation under load
- load test at 500 concurrent users with <5% error rate
- bottleneck report: pre-optimization, db connection exhaustion caused latency spikes around ~150 concurrent users. fixed by adding pgbouncer (pooled connections) and redis (eliminated redundant db reads for repeat urls).
🛡️ Track: reliability
🥉 bronze — prove it works before you ship it
- /health endpoint returns 200 OK — used by nginx and docker for liveness checks
- 14-test pytest suite covering unit and integration tests
- github actions CI runs the full test suite on every push and pull request to main
🥈 silver — stop bad code from reaching production
- coverage gate enforced at 50% via --cov-fail-under=50 — CI fails if coverage drops below threshold
- integration tests hit the actual API: POST /shorten, url resolution, user flows, event logging
- deploy job in CI has needs: [test] — a failing test blocks the deploy entirely
- all 404s and 500s return clean JSON (never raw stack traces), with error handlers for both HTTPException and unexpected errors
🥇 gold — break it on purpose. watch it survive.
- all containers configured with restart: unless-stopped or restart: always — kill a container, it comes back automatically
- test_graceful_errors.py verifies bad inputs return structured JSON errors, not crashes
- RUNBOOK.md documents exact failure modes for every alert: what broke, why, and how to fix it
📋 Runbook: link
Built With
- alertmanager
- autoheal
- digitalocean
- docker
- flask
- grafana
- k6
- loki
- nginx
- pgbouncer
- postgresql
- prometheus
- python
- redis


Log in or sign up for Devpost to join the conversation.