Skip to content

schochastics/minard

Folders and files

NameName
Last commit message
Last commit date

Latest commit


History

11 Commits


Repository files navigation

Recreating the work of Minard in R

Image

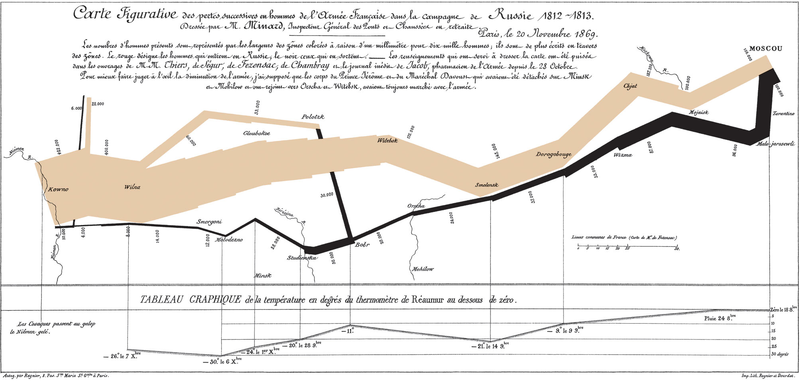
If you are into data viz, then I am pretty sure that you have seen the chart above before. E. Tufte once declared this to be "the best statistical graphic ever drawn".

What you might not know is that its creator, Charles Joseph Minard, made far more significant contributions in the field of information graphics. Especially with his flow maps. Sandra Rendgen dedicated a book, "The Minard System", which shows 61 maps and plots that Minard produced during his lifetime. The book is really inspiring and I can only recommend it. One cold winter day in early 2021, I decided to try to recreate some of Minards work with R. I was particularly interested in his flow maps. This was also actually the starting point for me to develop the R package edgebundle. I had the ambitious goal to reproduce as many of his 61 drawings as possible.

(11) Ports in France I

Image

Code

(14) English Coal Exports I

Image

Code

(21) Meat Sent to Paris

Image

Code

(24) Ports in France II

Image

Code

(25) Cargo Ports in Europe

Image

Code

(34) Cargo Ports of the Globe

Image

Code

(38) Global Migrants

Image

Code

(41) English Coal Exports II

Image

Code

(48) Post Offices in Paris

Image

Code

(50) French Wine Exports

Image

Code

(53) English Coal Exports III

Image

Code

(54) Global Coal Production

Image

Code

(60) Napoleon’s Campaign

Image

Code

Image

About

Recreating Minard's famous visualization in R

Resources

Stars

Watchers

Forks

Releases

No releases published

Packages


Contributors