Featured Research
Macroeconomic Insights: Oil Prices and Inflation– Will the Ceasefire Last?
To gauge how markets are pricing the durability of the current US-Iran ceasefire, we aggregated conflict resolution probabilities across four prediction market platforms (Polymarket, Kalshi, Metaculus, and Manifold Markets), encompassing over $470 million in total...
Macroeconomic Insights: Oil Prices and Inflation– Will the Ceasefire Last?
To gauge how markets are pricing the durability of the current US-Iran ceasefire, we aggregated conflict resolution probabilities across four prediction market platforms (Polymarket, Kalshi, Metaculus, and Manifold Markets), encompassing over $470 million in total trading volume. We constructed a composite probability curve measuring the likelihood of a lasting end to hostilities at each date through December 2026, defined as 14 or more consecutive days without qualifying military action between Iran and the US/Israel coalition (Figure 1, top panel – visit our Substack to see the figure).
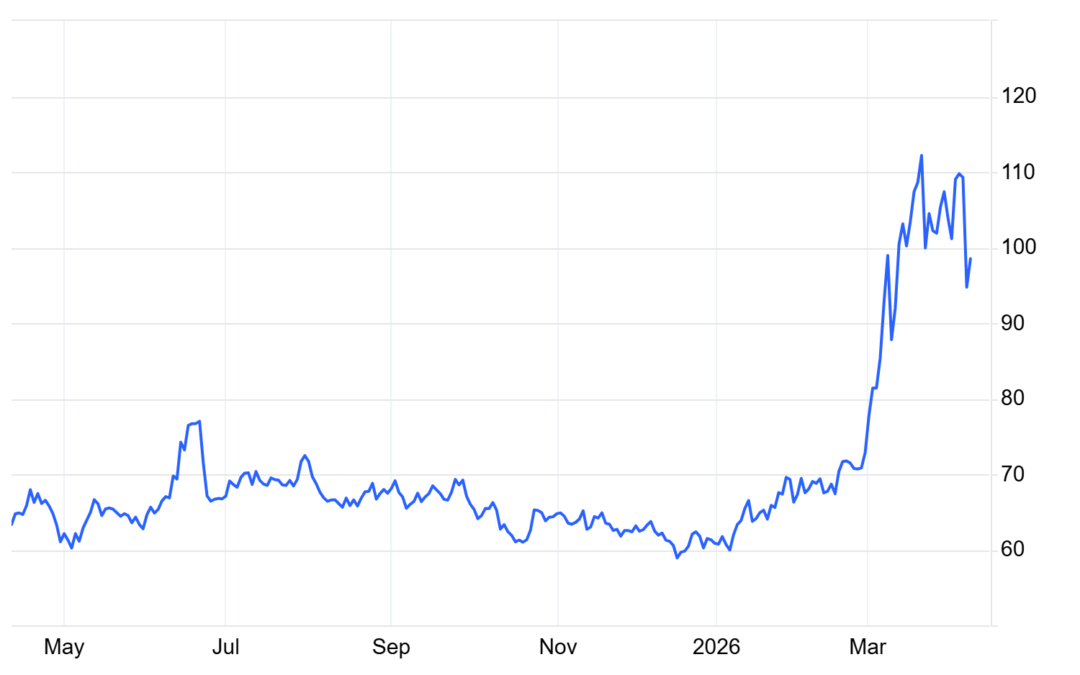
We then compared this probability curve with the NYMEX WTI oil futures prices from May through December 2026, based on April 8–9 settlement prices (Figure 1, bottom panel). We modelled two scenarios that bracket the range of outcomes – a peace path converging to Goldman Sachs’ Q4 base case of $67 and a re-escalation path returning to $110–118 – and weighted them by the probability of each outcome at every point in time.
The top panel shows that markets assign very low near-term credibility to the April 7 ceasefire but grow more optimistic over time, in line with the Islamabad negotiating track. The probability of lasting peace is near zero today, reaches only 8% by end of April when the ceasefire expires, and does not cross 50% until late June. The steepest climb falls between June and July, consistent with the view that a durable deal requires months of negotiation. Independent estimates from Metaculus (9% for ceasefire before May, 469 forecasters) and Kalshi (35% for a nuclear deal by 2027) sit close to the main curve at their respective dates, providing cross-platform confirmation.
The bottom panel translates these probabilities into oil prices. Futures prices today slope steeply downward, from roughly $96–108 in May to about $72–74 in December. Our probability-weighted path remains above the futures curve throughout the period, although the gap narrows materially from late summer onward.
That gap is largest in the near months. At a minimum, it suggests that the futures curve is pricing a faster normalization in oil than our probability-weighted conflict framework would imply. Our model is deliberately simple. It maps political resolution probabilities into two oil-price paths, but it does not attempt to capture the full range of near-term market dynamics, including inventory positioning, shipping frictions, precautionary premia, or other temporary dislocations that can keep front-month prices elevated relative to a medium-term scenario model.
The sharp decline in the futures curve toward $72–74 by December therefore suggests that the market expects current tightness to ease over that horizon. That easing could come from some combination of supply normalization, weaker demand, or policy responses, but the figure itself does not identify which mechanism dominates. The key point is that the futures curve is answering a different question from the conflict-probability model. It reflects not only whether hostilities persist, but also how quickly any resulting oil-market disruption fades.
Even if peace is reached, the inflation impulse from an oil shock would not disappear immediately. Energy-price pass-through typically lags the underlying move in crude, especially in energy-importing economies. In that sense, any near-term disruption could continue feeding into headline inflation after the political situation has stabilized. At the same time, the top panel still implies roughly a 24% chance that the conflict has not durably ended by year-end, leaving meaningful upside risk to both oil and inflation beyond the central case.
Two caveats are worth noting. First, our peace-versus-escalation framing is deliberately simple. Real outcomes will fall on a spectrum that includes partial de-escalation, intermittent disruption, and sanctions easing without full normalization, any of which would produce oil prices between our two scenario bounds. The probability-weighted price should be read as an analytical anchor, not a point forecast. Second, the inflation discussion above is directional rather than mechanical. The timing and persistence of pass-through will depend not just on the path of hostilities, but also on the speed of supply normalization, domestic fuel-price policy, and the response of broader demand.
This material is produced by Turnleaf Analytics for informational purposes only and does not constitute investment advice, a recommendation, or an offer to buy or sell any security or financial instrument. The analysis reflects our interpretation of publicly available data as of the date of publication and is subject to change without notice. Readers should consult qualified financial, legal, and tax advisors before making any investment decisions. Turnleaf Analytics accepts no liability for losses arising from the use of this material.
Research Archive
Macroeconomic Insights: Oil Prices and Inflation– Will the Ceasefire Last?
To gauge how markets are pricing the durability of the current US-Iran ceasefire, we aggregated conflict resolution probabilities across four prediction market platforms...
Macroeconomic Insights: There’s No Ceasefire for Inflation
Late last night (April 7, 2026), the U.S. and Iran agreed on a two-week ceasefire to allow for diplomacy. During this time, Iran has agreed to coordinate the passage of vessels...
Macroeconomic Insights: Hormuz Shock and the Return of Global Inflation (Expectations?)
The closure of the Strait of Hormuz following the US-Israeli strikes on Iran on 28 February 2026 has triggered the largest physical supply disruption in the history of the global...
Neudata London March 2026
A decade ago, I liked burgers, and a decade on, well, I still like burgers. However, one thing that has changed greatly has been the alternative data market. What was once an...
Macroeconomic Insights: Spain CPI Downside Surprise and Energy Tax Cuts
Spain headline CPI YoY jumped sharply to 3.3% YoY in March 2026 from 2.3% in February entirely on the back of energy price reversals linked to the Iran conflict and Strait of...
Macroeconomic Insights: Asia-Pacific Tries to Contain the Oil Shock
Across the Asia-Pacific, policymakers are throwing subsidies, tax cuts, reserve releases, and pricing controls at rising fuel costs in an attempt to delay or smooth an external...
Macroeconomic Insights: LATAM Fights an Oil Shock
In an earlier post, we explored the lagged correlations between Brent crude oil price changes and CPI (Figure 1). Here, we see that for many LATAM countries pass-through is...
Macroeconomic Insights: Airfares Take Off as Iran Conflict Continues
The war in Iran has persisted far longer than anticipated, driving sustained increases in global commodity prices. These pressures are now filtering into downstream products...
Macroeconomics Insights: Oil Prices Up, Will Food Prices Follow?
Over the past three weeks, the escalation of conflict in the Middle East has coincided with a clear increase in Brent crude prices, reinforcing the expectation of near-term...
Macroeconomic Insights: Iran’s Oil Shock Fuels Inflation
It’s been more than 2 weeks since the US-Israel joint combat mission against Iran began and the conflict doesn’t look like its going to end any time soon. Iran is doing...
Macroeconomic Insights: Energy Price Pass-Through to Inflation
Brent crude has surged from ~$70 to above $100 following the US-Israeli strikes on Iran and the near-closure of the Strait of Hormuz (Figure 1). Dutch TTF natural gas has jumped...
Macroeconomic Insights: Strait of Hormuz and the Inflation Shock Markets Are Repricing
The US-Israel strike on Iran has pushed Middle East risk back to the center of global pricing. Crude has firmed into the low 70s while European gas prices spiked, and gold has...
Macroeconomic Insights: Trump’s Tariff War – The Sequel
On Feb 20, 2026, the Supreme Court ruled 6–3 (Learning Resources, Inc. v. Trump) that the International Emergency Economic Powers Act (IEEPA) does not authorize the U.S....
Macroeconomic Insights: Gold’s New Inflation Playbook
Gold has stopped trading as a clean derivative of US real yields and now reflects a broader external pricing regime. Since 2022, the real-yield anchor has weakened, gold has...
TradeTech FX USA 2026
Over recent years, the finance community in Miami has grown, given that a number of hedge funds have opened up large offices there. Every February, the FX community from New...