Welcome to this adventure, where I write about the process of our latest game, Devils on the Moon pinball.
This is a story of how we lost almost two full weeks of work while chasing a crash that only happened on the Playdate device randomly after some time of playing.
It all started with a normal build to device that crashed; the weird part was that the game only crashed when putting the device to sleep.
I went to that part of the code and found nothing, literally nothing. I wasn't doing anything at all during that callback.
Ok, don't panic. Let's see what the crashlog.txt says. If you don't know what this file is, consider yourself lucky. But it's where the Playdate logs hard crash information, and it looks like this.
--- crash at 2025/12/10 20:35:08---
build:e44193e8-3.0.1-release.194549-gitlab-runner
   r0:00008001    r1:20009b90     r2:38800088    r3: 00000000
  r12:2000f8d1    lr:24021457     pc:24021456   psr: 410f0000
 cfsr:00010000  hfsr:40000000  mmfar:00000000  bfar: 00000000
rcccsr:00000000
heap allocated: 15233952
Lua totalbytes=0 GCdebt=0 GCestimate=0 stacksize=0
The first time I looked at this, I just closed the file and started putting logs everywhere. But this time I knew that wasn't going to work. So, understanding the crash report it is.
The Symbolizer
The first step to understand the crash is to run the firmware_symbolizer.py script provided by the SDK. This tool tries to tell you where the crash happened.
python $(PLAYDATE_SDK)/bin/firmware_symbolizer.py ./crashlog.txt build/playdate/pdex.elf

?? ??:0
?? ??:0
Well, that is not helpful, but this will happen a lot of times; the bad crashes tend to crash so badly that the symbolizer is unable to tell where the crash happened.
There are some things that have helped me, though. One is that I use a modified version of the symbolizer that prints the actual command used to get the line of code.
import re
import subprocess
import click

@click.command()
@click.argument("crashlog", type=click.Path(exists=True))
@click.argument("elf", type=click.Path(exists=True))
def symbolize(crashlog, elf):
    cl_contents = open(crashlog, "r").read()
    cl_blocks = re.split(r"\n\n", cl_contents)

    for block in cl_blocks:
        matches = re.search(r"lr:([0-9a-f]{8})\s+pc:([0-9a-f]{8})", block)

        if matches:
            lr = matches.group(1)
            pc = matches.group(2)
            lr_num = int(lr, 16)
            pc_num = int(pc, 16)
            lr_num = lr_num & 0x0FFFFFFF
            pc_num = pc_num & 0x0FFFFFFF
            print("lr: {} -> {}".format(hex(int(lr, 16)), lr_num))
            lr = hex(lr_num)
            pc = hex(pc_num)
            cmd = f"arm-none-eabi-addr2line -f -i -p -e {elf} {pc} {lr}"
            print(cmd)
            stack = subprocess.check_output(cmd, shell=True).decode("ASCII")
            print(stack)

if __name__ == "__main__":
    symbolize()
What the symbolizer is doing is calling the command arm-none-eabi-addr2line and passing the address that caused the crash. Your code lives in RAM memory, the same as your runtime allocations, and it's stored in a memory address. The PC and LR registers store the memory address where the function that caused the crash is stored. The only problem is that the address is not mapped one to one to your elf file because the Playdate stores it on a different offset depending on if it's a Rev A or Rev B Playdate. So the symbolizer also converts the memory you get from the crashlog.txt to the correct one on the elf file
lr: 0x24021457 -> 67245143
arm-none-eabi-addr2line -f -i -p -e ./build/playdate/pdex.elf 0x4021456 0x4021457
?? ??:0
?? ??:0
Still, not really helpful. Another tool I have used is the playdate-symbolize crate made in Rust that tends to give more human-readable errors, but sadly in this case it was the same result.
I have found that the really nasty bugs tend to crash on a random function that is not in a helpful region of memory. This can be because the function is a Playdate function and we don't have the map for that, or the address is completely wrong because the stack got corrupted. There are some people at the Playdate Discord that can tell what kind of function made the crash just by looking at the address (shout out to Scratchminer), but every time I see the ?? ??:0 I know I'm in trouble.
Memory suspects
One thing that may help right out of the bat is the heap allocated field; this might be relevant, especially for LUA-based projects, as if it's a high number, it probably means you have a memory leak and the device ran out of memory.
Out of memory
Well, here we have 15232096 that number represents the amount of memory your game has allocated in bytes. If we convert it to megabytes, we have 15.2MB. Well, the Playdate has 16MB of RAM, so that would be a pretty close call. In our case, though, what I'm doing is reserving as much memory as possible at the beginning of the game (15.2MB) and then using that memory through my own custom memory allocator. A simple memory arena. So I knew this was the cause of the crash here. If you are having memory leaks, though, a really useful tool is the device info window in the Playdate SDK.
As you can see here, the memory stays the same the whole time. Once you are using your own memory allocator, you can do a lot of cool stuff, like setting a custom limit and letting you know on a simulator build if you are getting past it. You can also use the malloc pool feature on the simulator and limit the 16MB memory your game has available.
Memory initialization
So it wasn't a memory leak. Another thing that may cause something to crash on a device and not in the simulator is that if you are using a low-level language like C, the memory can have trash values when you get it, causing a bunch of issues if you are not careful initializing things.
It happened to me a bunch of times that on the simulator build of the game, all the memory I got from the OS was zeroed out, but when I tried it on the device, it would crash because some trash value I assumed would be 0. I'm not sure, but I think the memory you get is actually just the memory from the previous process that was running, and if you just relaunched your game from a crash a lot of times, this is your own game. So what would happen to me is that the game would crash when starting from the launcher but wouldn't when starting using the pdc tool.
To fix this, there are a couple of things you can do. One is to make sure to clear out any memory that you get from the OS. This way at least you know that you are starting at the same state as in your desktop computer. For this, there are a couple of simple yet useful macros I like.
#define mclr(dst, size) memset((dst), (0), (size))
#define mclr_struct(s)  mclr((s), sizeof(*(s)))
#define mclr_array(a)   mclr((a), sizeof(a))
This is useful by itself, but combined with other macros, you can make sure to always have cleared memory.
#define alloc_struct(alloc, ptr)     (__typeof__(ptr))alloc_size(alloc, sizeof(*(ptr)), false)
#define alloc_struct_clr(alloc, ptr) (__typeof__(ptr))alloc_size(alloc, sizeof(*(ptr)), true)

void *
alloc_size(struct alloc alloc, ssize mem_size, b32 clr)
{
	void *mem = alloc.allocf(alloc.ctx, mem_size);
	if(clr) { mclr(mem, mem_size); };
	return mem;
}
...
struct game *game = alloc_struct_clr(alloc, game);
The problem is that clearing memory is fast but is not free; it takes some cycles to do it, so you don't want to do it everywhere. Well, another thing you can do is to poison your memory on the simulator.
#define MEM_POISON_PATTERN 0xCD
#if defined(DEBUG)
memset(mem->buffer, MEM_POISON_PATTERN, mem->size);
#endif
I think this is done by default on Visual Studio on debug builds.
This way you would lose performance on your debug build, but that's preferable to losing it on the release version. This pattern has helped me tremendously and removed one common cause of bugs in my code.
So I was sure it wasn't a memory uninitialized problem this time around.
Crash registers
Back to trying to understand the crashlog.txt
--- crash at 2025/12/10 20:35:08---
build:e44193e8-3.0.1-release.194549-gitlab-runner
 r0:00008001    r1:20009b90     r2:38800088    r3: 00000000
r12:2000f8d1    lr:24021457     pc:24021456   psr: 410f0000
cfsr:00010000  hfsr:40000000  mmfar:00000000  bfar: 00000000
rcccsr:00000000
heap allocated: 15233952
Lua totalbytes=0 GCdebt=0 GCestimate=0 stacksize=0
Thankfully there is excellent, albeit technical, documentation about this How to debug a HardFault on an ARM Cortex-M MCU.
One source of documentation that sometimes is useful is to search for FreeRTOS, like this article, as this is the operating system the Playdate is using.
The first thing I noticed is that the cfsr has a value set because it's not all zeros. So how it works is that the cfsr or Configurable Fault Status Registers stores information about the crash, turning on bits in a 32-bit register.
The numbers in the crashlog.txt are 32-bit hexadecimal numbers, so to know what register was turned on, we have to convert it to binary. Our value here of 00010000 converts to:
0000 0000 0000 0001 0000 0000 0000 0000
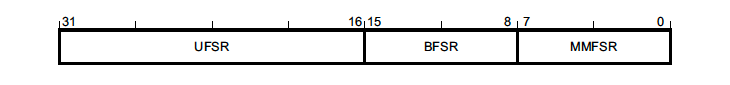 Thanks to this image, we know that the last 16 bits correspond to the
 UFSR as they are the only bits with a value. Let's focus on that.
UFSR stands for Usage Fault Status Register, so we know the crash was not caused by something related to memory access.
Now, thanks to this image, we know that the second bit means there was a UNDEFINSTR
0000 0000 0000 0001
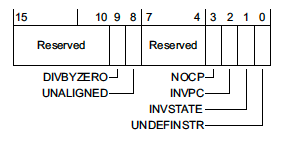
From the article, this means that an undefined instruction was executed; this can happen if the stack got corrupted.
Reproduce
At this point I will be honest with you: I wasn't thinking completely straight and became paranoid. The fact that the game would only crash after some random time and then lock the screen made no sense to me.
Thankfully, JP is the best QA tester I have ever met and was able to find that the issue only happened after interacting with a specific entity in the game; we call him the Nalgón, which translates to Big butt guy in English.
He used to mockingly show his butt and is one of our favorite characters.
Even though we removed the version of him where he showed his butt. I started to feel like he was mocking me again… now with a bug.
Now that we had an easy way to reproduce the bug, go to the Nalgón bump it with the ball and lock the screen. I started commenting code to see if the crash kept happening. The process was painful:
- Build the game
- Launch the simulator
- Press
CTRL+Uto send the game to the device - Wait for 3-5 minutes while the game get's copied
- Enable the developer cursor
- Bump the
Nalgón
All in all, it took around 10 minutes to test each build, which quickly helped with my paranoia.
I wrote a small script to automate most of the tasks. I had built something similar years ago when working with Pullfrog when the Linux simulator didn't have the Send to Device command.
#!/bin/bash
set -euo pipefail

DESTDIR="build/"
GAME_NAME="devils-on-the-moon-pinball-dev"
PD_DEV="/dev/ttyACM0"
PD_MOUNT="/your/mount/folder"
SRC_DIR="${DESTDIR}playdate/${GAME_NAME}.pdx"
DST_DIR="${PD_MOUNT}/Games/${GAME_NAME}.pdx"


if [[ -e "$PD_DEV" ]]; then
  if [[ ! -d "$PD_MOUNT" ]]; then
    if ! pdutil "$PD_DEV" datadisk; then
      echo "Failed to enter Data Disk Mode." >&2
      exit 1
    fi

    for i in {1..20}; do
      if [[ -d "$PD_MOUNT" ]]; then
        break
      fi
      sleep 0.5
    done
  fi
elif [[ -d "$PD_MOUNT" ]]; then

else
  echo "Playdate not connected." >&2
  exit 1
fi

if [[ ! -d "$PD_MOUNT" ]]; then
  echo "Playdate mount did not appear." >&2
  exit 1
fi

rsync -azrt --update --modify-window=1 --prune-empty-dirs --delete \
  --info=name0 --info=progress2 \
  "${SRC_DIR}/" "${DST_DIR}/"

udiskie-umount --eject /dev/sde1
sleep 2.0
pdutil "$PD_DEV" run "Games/${GAME_NAME}.pdx";
This reduces the effort of testing the build on the device by a lot. It only works on Linux, and you will need to change variables to make it work in your setup. If you want a similar script for Mac, Nino has this great script.
Well, one thing that this particular interaction does is to trigger the gate open/close mechanic on the ramp. For the close to work as we wanted, we needed to split the gate into 3 different entities, each with their own collision, events, and actions. I removed some event system code, and the game stopped crashing when I locked the Playdate but kept crashing after bumping a lot of times with the Nalgón.
At this point I made the mistake of stopping checking the crashlog.txt and assuming I knew what was happening; again, I was paranoid. So my theory was that I probably did something bad and used a bad pointer somewhere that was pointing to a random memory address and slowly corrupting the stack.
Sanitize
If you are programming in C, there are a couple of tools that can help you catch a footgun at compile and runtime.
First, I had already turned on a bunch of warnings. These are my normal compiler flags.
WARN_FLAGS += -Werror -Wall -Wextra -pedantic-errors
WARN_FLAGS += -Wstrict-prototypes
WARN_FLAGS += -Wshadow
WARN_FLAGS += -Wundef
WARN_FLAGS += -Wdouble-promotion
WARN_FLAGS += -Wno-unused-function
WARN_FLAGS += -Wno-unused-but-set-variable
WARN_FLAGS += -Wno-unused-variable
WARN_FLAGS += -Wno-unused-parameter
Some of them come from this great post. I like this because I was quite inexperienced with C, at least when I started working on this game 2 years ago. But this helps you catch bugs at compile time. The worst bugs, though, are at runtime: use after free, double free, etc. For that, sanitizers are great! Since almost the beginning, I have been using the following:
DEBUG_CFLAGS += -fsanitize-trap -fsanitize=address
fsanitize-trap Make it so when I'm asserting something with this macro, the debugger stops right at the line where the assert failed.
#define dbg_assert(c) if(!(c)) __builtin_trap()
And the address sanitizer inserts some poison memory to detect memory leaks and out-of-bounds access.
I use them all the time and have caught a lot of bugs using them. I highly recommend enabling them if you can.
Another common sanitizer is the -fsanitize=undefined I didn't have it enabled because I didn't really understand what was undefined behavior and what wasn't, and in some code that worked perfectly fine on both platforms, it triggered the sanitizer. But now, full of paranoia, I thought, surely I'm doing a scary, undefined behavior that is corrupting my memory.
So I enabled the sanitizer and slowly read about the undefined behaviors I was doing fixed all of them. Ran my script to build the game, and… It was still crashing.
Out of options
I will save you the next couple of days, but I did refactor everywhere I suspected something could have gone wrong. Five days later I was still getting the crash. At this point I had stopped paying attention to the crash message, as I had marked it as useless long ago. But JP told me after another test, “Still getting the same message, Stack Overflow, on the game task.” I froze. How could I miss this?
The Playdate has a small stack of 10Kb, my struct event_context struct is 88 bytes, and my struct action is 168 bytes. This means that I can pass around on the stack around 110 actions on my event process function, and this is without counting all the local variables, etc. So looking back at what the Nalgón does, it fires up like 10+ events and actions every time the ball bumps it.
This shouldn't be a big issue, especially if you are processing the events one by one in a queue. Our problem was that any event could trigger a new event, and instead of adding it to a queue, I kept running the actions and triggering more events until eventually I blew the stack.
Once I knew this, the solution was easy: make sure every time there is an event, instead of running the side effects right away, add it to a queue, and at the end of the frame process, enter a while loop where I'm processing the events until there are no more events to process.
while(q->count > 0) {
	struct event *event = &q->items[q->head];
	event_process(event_ctx, event);
	q->head = (q->head + 1) % q->cap;
	q->count--;
}
After implementing this new system, the issue was completely fixed!.
Well, I hope this story will help someone.
Extra notes
One common crash that I didn't cover here is the 10-second watchdog crash. This is a common thing to happen, and it's triggered if one of your frames took more than 10 seconds to give back control to the OS. The most common way it happens is while booting the game and loading all the assets, as this gets progressively slower the more full the Playdate hard drive is. So a good rule of thumb is that if your game is taking more than 5 seconds to load, you should start implementing some kind of loading screen. Squid God has an excellent video on the subject.


Comments