Scatter Plots in Matplotlib
Scatter plots are a kind of bar chart in which each data point is represented by a dot on a Cartesian grid. They shine when used in the study of the correlation between two...
![]()
Scatter plots are a kind of bar chart in which each data point is represented by a dot on a Cartesian grid. They shine when used in the study of the correlation between two...
Learning Matplotlib’s Subplot Functionality An Overview Subplots are a way to break up a larger plot into many more manageable ones. They make it simpler to analyse and understand complicated data by emphasising connections...
Matplotlib is a robust Python toolkit for data visualisation that enables the creation of useful and eye-catching graphs. The grid, which offers a backdrop of horizontal and vertical lines, is a crucial part of...
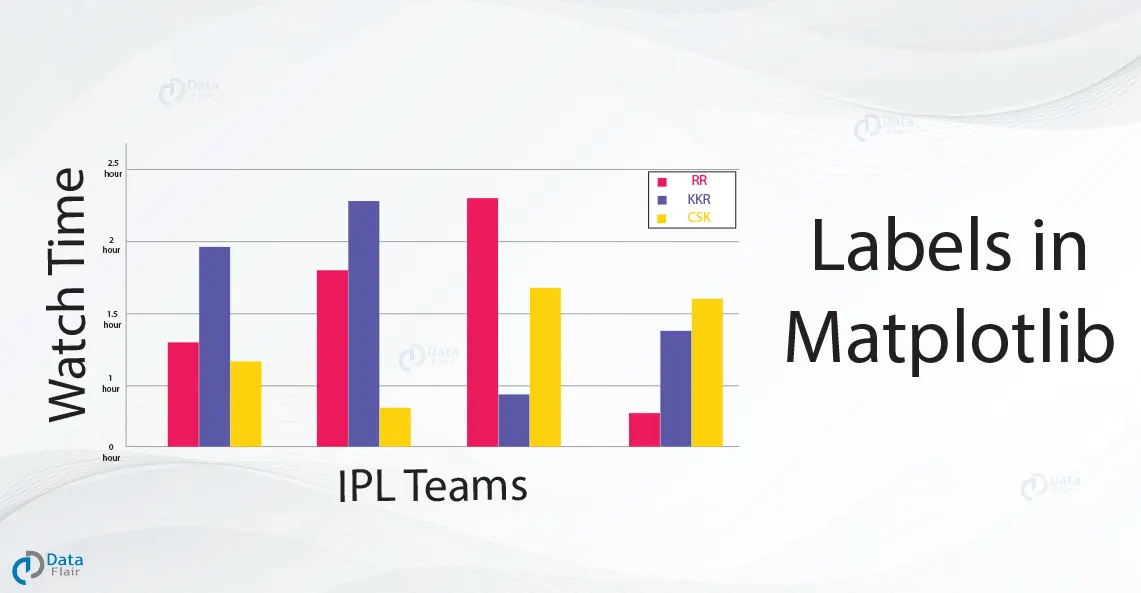
Matplotlib is a strong Python library commonly used for plotting and graphing data. It has a wide variety of features for producing eye-catching graphs and conveying data insights. As labels in matplotlib play a...
Matplotlib is a robust Python toolkit for visualising data, with many options for making plots and charts that are both informative and aesthetically pleasing. One of the most essential aspects of data visualisation is...
You may make all kinds of plots and charts with the help of Matplotlib, a Python package for data visualisation. Markers are used extensively in data visualisation because of their importance in accurately depicting...
Matplotlib is a strong tool for Python programmers to use in the domain of data analysis and visualisation. For complicated information, “a picture is worth a thousand words,” and data visualisation is an essential...
The ability to effectively share and comprehend information relies heavily on data visualization’s ability to help us draw insights from complicated datasets. The Matplotlib Python package is widely used because it has robust capabilities...
Data visualisation refers to the practice of transforming numerical or textual information into a visual format with the purpose of improving readability, comprehension, and analysis. It’s a crucial part of data analysis since it...