-
-
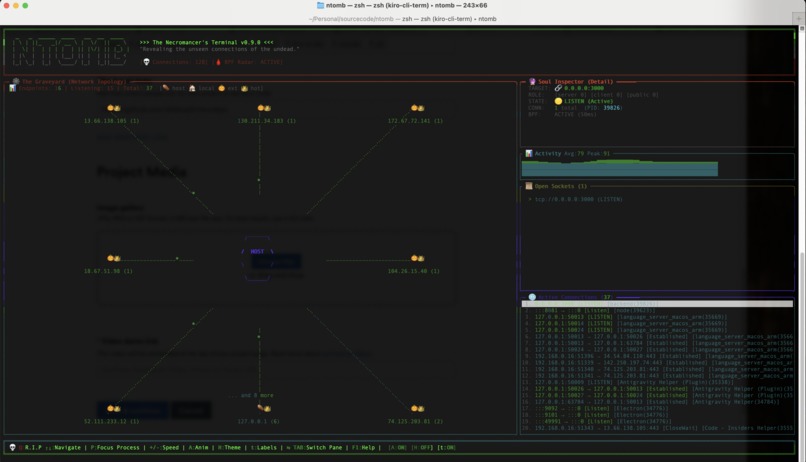
Main ntomb TUI – undead connection “graveyard” for a single process (hosts on the left, details on the right).
-
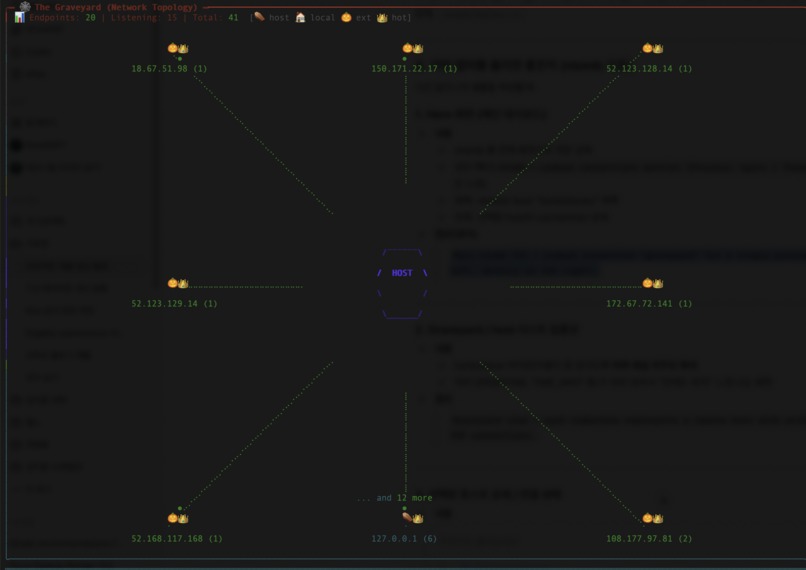
Graveyard view – each tombstone represents a remote host with active or “undead” TCP connections.
-
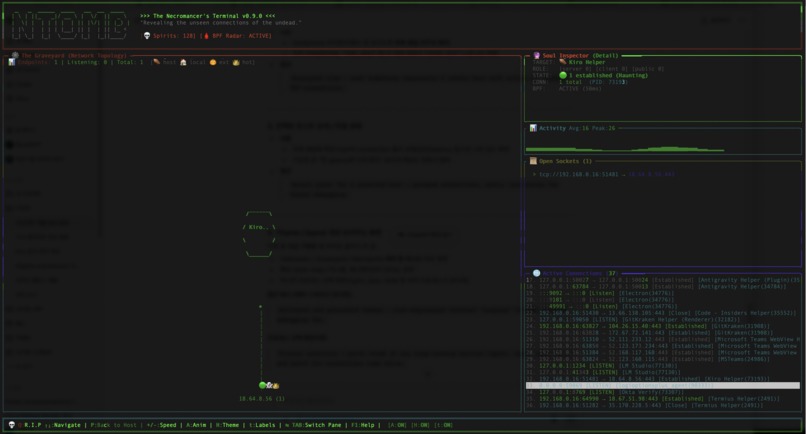
Detail panel for a selected host – grouped connections, ports, and states for faster debugging.
-
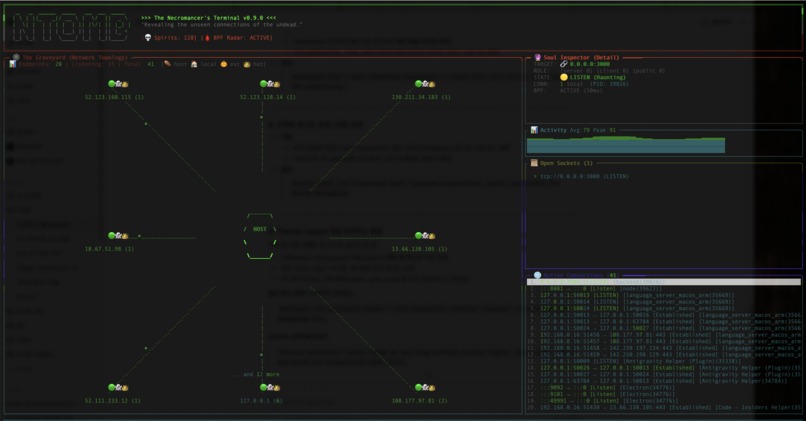
Halloween and graveyard themes – over-engineered terminal “cosplay” to make network debugging fun.
-
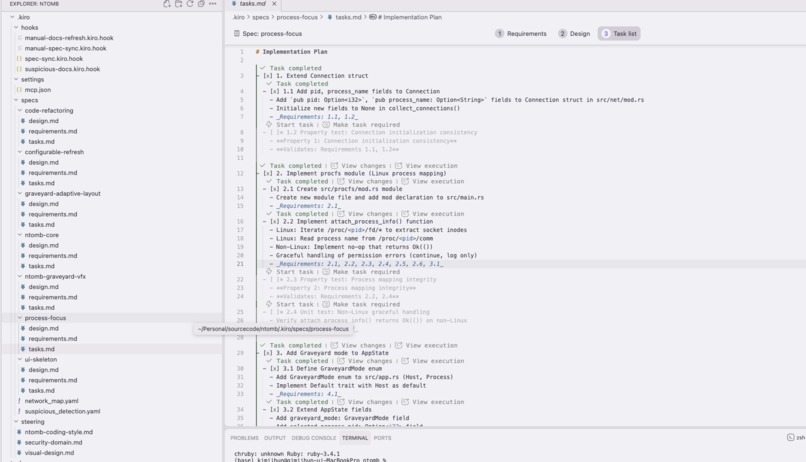
.kiro specs, steering docs, and agent hooks used to generate layout, keep code style consistent, and pull real system data.


Inspiration
On busy Linux servers there are always “undead” things lurking in the background – forgotten processes, long-lived connections, and sockets nobody remembers opening.
As an SRE, I kept running into incidents where the first question was:
“What is talking to what right now, and why?”
Tools like ps, lsof, and ss are powerful, but they dump raw data instead of a story. I wanted something that felt like a necromancer’s terminal: a way to resurrect hidden connections on a running system and walk through the “graveyard” of processes in a visual, opinionated way.
Kiroween’s theme of graveyards, resurrection, and undead tech was the perfect excuse to finally build that tool. That became ntomb.
What it does
ntomb is a Rust-based terminal UI that helps you explore “undead” process and network connections on a Linux host.
Key behaviors:
Graveyard View
- Treats each process like a “tombstone.”
- Shows PID, command, user, uptime/age, and counts of open sockets.
- Lets you sort and filter to surface:
- suspiciously long-lived processes
- unexpected owners of important ports
- noisy services with many connections
- Treats each process like a “tombstone.”
Per-process Connection View
- When you select a process from the graveyard, ntomb shows:
- local/remote IPs and ports
- protocol (TCP/UDP)
- basic statistics and counts
- This turns “what is this PID doing?” into a single keypress.
Incident-friendly TUI
- Keyboard-only navigation, suitable for SSH into production hosts.
- Layout and colors focused on at-a-glance signals instead of raw spam.
- Halloween/necromancer flavor without sacrificing readability.
- Keyboard-only navigation, suitable for SSH into production hosts.
The result is a spooky but practical way to answer:
“Which processes are haunting this server, and what are they connected to?”
How we built it
Stack & architecture
- Language: Rust
- UI: A TUI stack built on top of a crossterm-style backend (for input, drawing, resize handling).
- Data sources:
/procfor processes, cmdlines, and file descriptors/proc/net/*(and friends) for socket information- Optional eBPF-style hooks for richer data where supported
- Architecture:
- A central state object tracking:
- list of processes (the “graveyard”)
- connections grouped by process
- current selection, filters, and sort order
- Separate modules for:
- data collection
- domain models (
ProcessInfo,ConnectionInfo, etc.) - TUI rendering (graveyard pane, details pane, status bar)
Spec-driven development with Kiro
I used Kiro as an AI IDE and worked in a spec-first way:
Specs
- Wrote
.kiro/specsdescribing user flows:- “Select a process and immediately see its active connections.”
- “Sort by age or connection count during an incident.”
- From those specs, Kiro helped generate:
- initial Rust module layout
- early versions of the core structs
- skeletons for the TUI event/render loop
- initial Rust module layout
- Wrote
Steering
- Used
.kiro/steeringdocs to constrain Kiro:- Rust only (no Python sidecars, no heavy frameworks)
- keep dependencies minimal
- prioritize readability and testability
- Rust only (no Python sidecars, no heavy frameworks)
- This kept the project focused and stopped the AI from drifting into unrelated stacks.
- Used
Iteration & refactors
- As the concept evolved (e.g., Graveyard layout changes), I used Kiro to:
- refactor modules
- rename types and functions safely
- extract shared UI components
- refactor modules
- It felt like pair-programming: I focused on intent; Kiro handled a lot of mechanical edits.
- As the concept evolved (e.g., Graveyard layout changes), I used Kiro to:
All of this was built in the context of the Kiroween hackathon, so the architecture was always optimized for a thin but complete end-to-end flow.
Challenges we ran into
Balancing depth vs. performance
- Scanning
/procand network tables can be expensive on large hosts. - We had to:
- cache process and socket data
- use incremental refresh instead of full rescan every frame
- be mindful that repeated lookups don’t turn into accidental $O(n^2)$ behavior.
- cache process and socket data
- Scanning
Permissions and environment differences
- Not all environments allow eBPF or have the same
/procexposure. - We needed:
- a “best effort” mode for non-root users
- clear fallbacks where only partial visibility is possible
- defensive coding for missing files or kernel differences.
- a “best effort” mode for non-root users
- Not all environments allow eBPF or have the same
Making a crowded TUI readable
- A server with thousands of connections can easily overwhelm the screen.
- The main challenge was visual prioritization:
- which metrics get their own column
- what should be highlighted vs. muted
- how much Halloween flair is okay before it becomes noise.
- which metrics get their own column
- A server with thousands of connections can easily overwhelm the screen.
Timeboxing scope for a hackathon
- There were many tempting ideas: historical timelines, rule-based alerts, integrations, etc.
- Cutting features aggressively and focusing on “launch → scan → explore → insight” was harder than expected but necessary.
- There were many tempting ideas: historical timelines, rule-based alerts, integrations, etc.
English-first documentation and narration
- Writing specs, Devpost text, and demo narration in English as a non-native speaker added another layer of work, but also forced clearer naming and UX language.
Accomplishments that we're proud of
A real, end-to-end tool, not just a mockup
- ntomb can actually be run on a real Linux server to investigate active processes and connections.
A usable incident-mode TUI
- Keyboard-only operation, focused layout, and high-contrast design make it realistic to use during an on-call situation.
Specs and AI working together
- Using
.kiro/specsand steering docs, we turned AI from a code generator into a real collaborator: - Kiro helped with refactors, wiring, and boilerplate,
- while the human stayed in charge of architecture and UX.
- Using
A fun theme that still respects SRE reality
- We managed to bring in necromancer/graveyard aesthetics without turning it into a toy.
- The Halloween theme enhances the experience but doesn’t get in the way when you’re debugging.
- We managed to bring in necromancer/graveyard aesthetics without turning it into a toy.
Clear separation of domains
- Process/connection modeling, data collection, and UI rendering are cleanly separated, making future extensions much easier.
What we learned
Linux internals in practice
- Revisiting
/proc,/proc/net, and permissions taught us a lot about what is safe, fast, and portable across distros.
- Revisiting
Designing for “glanceability”
- A good incident tool isn’t about showing everything; it’s about surfacing the right few signals.
- We learned to think in terms of:
- “What does the on-call engineer need to see in 5 seconds?”
- A good incident tool isn’t about showing everything; it’s about surfacing the right few signals.
Effective AI-assisted development
- Good specs and steering massively improve AI output quality.
- We learned to:
- describe constraints clearly
- let AI handle mechanical tasks while we curated the design.
- Good specs and steering massively improve AI output quality.
Scope management under pressure
- Hackathon constraints forced us to practice aggressive scoping:
- prioritize a single smooth user journey over many half-finished features.
- Hackathon constraints forced us to practice aggressive scoping:
Better naming & communication
- Writing everything in English pushed us to choose clearer names for UI elements and functions, which pays off in maintainability.
What's next for ntomb
Stronger eBPF integration
- Provide a richer “radar” mode where supported, with deeper per-connection metrics and maybe lightweight tracing.
History and timelines
- Add optional persistence so ntomb can show:
- how processes and connection counts change over time
- “this process has been haunting port 443 for the last N hours.”
Alerting and rules
- Allow users to define simple rules:
- e.g., “highlight any process older than X hours with more than Y connections.”
Integrations
- Export data as JSON or to other observability stacks, so ntomb can act as a front-end for scripts, dashboards, or SIEM pipelines.
Packaging and distribution
- Polish CLI flags, config files, and packaging (e.g., crates.io, Homebrew, container images) so it’s easy for other engineers to adopt.
More Kiro-driven iteration
- Continue using
.kiro/specsand hooks as living documents: - keep the spec and implementation in sync
- let Kiro help with larger refactors as ntomb grows.
- Continue using
Ultimately, the goal is to turn ntomb into a small but powerful member of an SRE’s toolkit — a friendly necromancer you can summon whenever your server starts acting haunted.

Log in or sign up for Devpost to join the conversation.