-
-
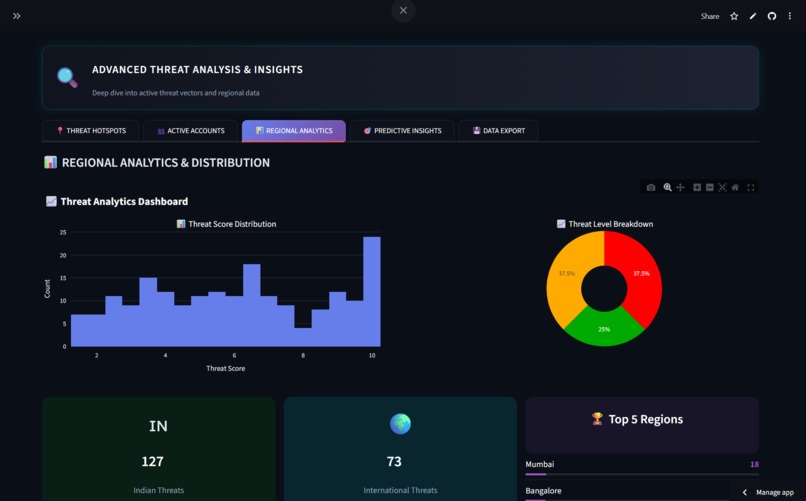
Strategic Breakdown: Regional distribution of threats categorized by AI confidence levels.
-
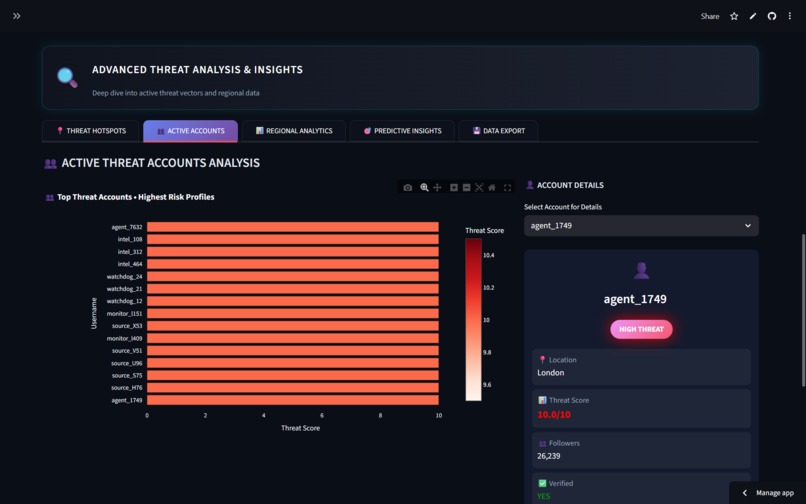
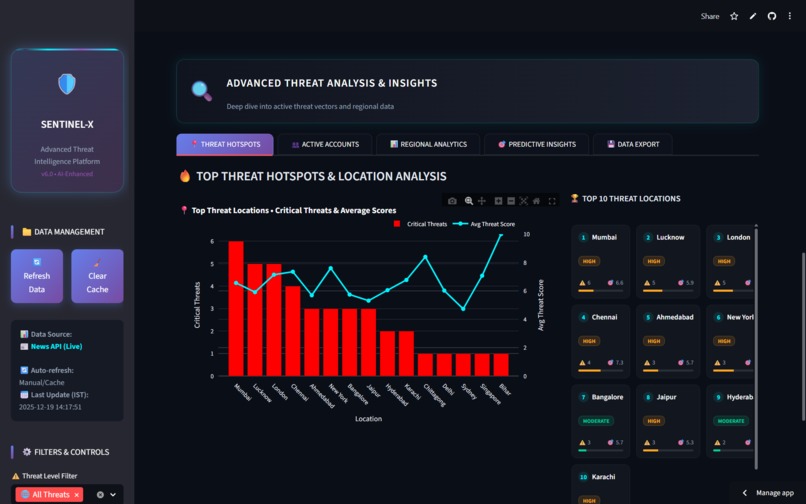
Target Identification: Ranking high-risk locations and verified accounts by threat severity.
-

Predictive Intelligence: AI-generated insights forecasting peak threat activity windows.
-
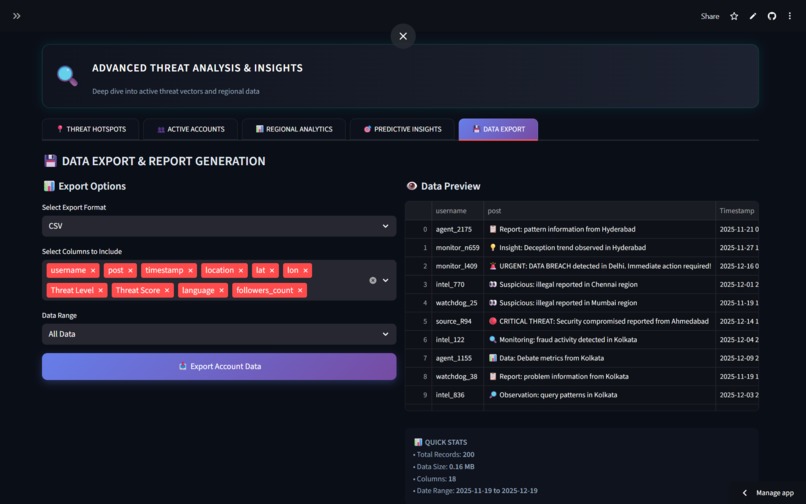
Raw Intel & Export: Granular data logs with seamless CSV export for field operatives.
-
Temporal Analysis: Visualizing the velocity and spread of hostile narratives over time.
-
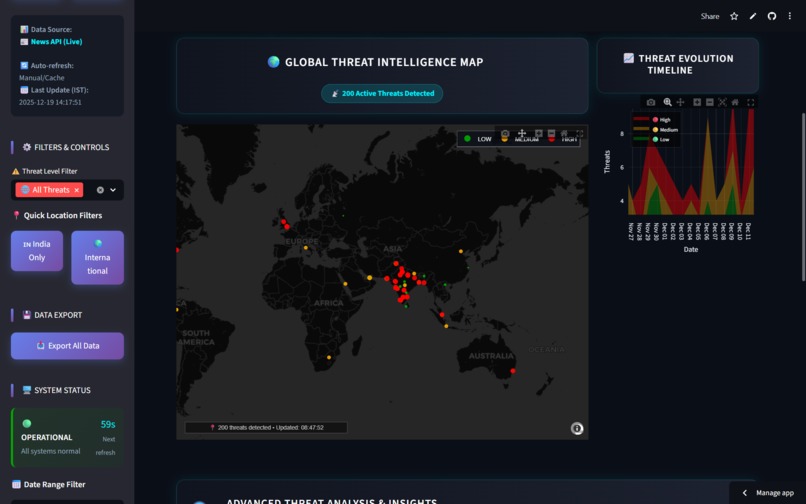
Geospatial Threat Vectoring: Pinpointing the exact origin of coordinated smear campaigns.
-

Main Dashboard: Real-time mission control dashboard monitoring global intelligence threats.


Inspiration
In the modern era, the most dangerous weapon isn't a missile—it's information.
We were inspired by the rising threat of coordinated disinformation campaigns targeting intelligence operatives and government assets. A single viral lie or a "doxxing" attempt can compromise an agent's safety, leak their location, or destroy a diplomatic mission before anyone realizes what’s happening.
We asked ourselves: “Does James Bond have a digital bodyguard?” The answer was no. Most monitoring tools are reactive and cluttered. We wanted to build Sentinel X—a tool that acts as a "Sixth Sense" for operatives, filtering out the noise to detect genuine security threats in real-time.
What it does
Sentinel X is an autonomous threat intelligence dashboard acting as a digital shield for national security. It:
- Detects Hostile Narratives: Ingests global news feeds to flag coordinated smear campaigns and leaks in real-time.
- Scores Threats: Uses an algorithm to assign a
Threat Score (0-10)based on keyword severity (e.g., "assassination", "breach") and sentiment polarity. - Visualizes the Danger: Projects threats onto a Global Threat Map, allowing analysts to instantly identify the geolocation of a hostile narrative.
- Preserves Operational Continuity: Runs on a hybrid engine that ensures the dashboard never goes dark, even if external data sources fail.
How we built it
We adopted a "Hybrid Architecture" to ensure the system is robust enough for mission-critical scenarios.
- Core Engine: Built on Python 3.10 for its powerful ecosystem.
- Frontend: We used Streamlit but pushed it beyond its limits. We injected Custom CSS3 to override the default theme, creating a "Dark Mode/Cyberpunk" aesthetic that mimics military-grade software.
- Intelligence Layer: We utilized TextBlob for sentiment analysis and Pandas/NumPy for high-speed data manipulation.
- Visualization: Plotly Mapbox powers the geospatial visualization, capable of rendering hundreds of threat vectors without lag, while Plotly Graph Objects handle the timelines.
Challenges we ran into
1. The "Demo Effect" (API Failures) Relying on live APIs (NewsAPI) is risky during a hackathon. If the internet drops or rate limits are hit, the project breaks.
- Solution: We engineered a Hybrid Data Engine. The system attempts to fetch live news first. If it fails, it seamlessly switches to a Synthetic Data Generator that simulates realistic threat patterns. This ensures the dashboard never crashes during a presentation.
2. Visualizing Overlapping Threats When multiple threats came from the same city (e.g., "New York"), the map markers would stack and become unreadable.
- Solution: We wrote a custom "Jitter Algorithm" that adds slight, random geospatial offsets to coordinates, creating a "cluster" effect that makes every data point visible and interactive.
Accomplishments that we're proud of
- Fault Tolerance: Successfully building a system that can switch between Live and Synthetic data without the user even noticing.
- UI/UX Design: Transforming a standard Streamlit app into a visually stunning, movie-style "Situation Room" interface using only CSS.
- Real-Time Processing: optimizing the data pipeline so that threat scores are calculated instantly as new articles arrive.
What we learned
Building Sentinel X taught us that resilience is a feature. A security tool cannot fail just because the WiFi is bad. We also learned the power of UI/UX in Data Science—by transforming raw data into a visual "Threat Map," we turned boring spreadsheets into actionable intelligence that can save lives.
What's next for SENTINEL-X
- LLM Integration: Replacing simple NLP with a fine-tuned Llama-3 model to detect sarcasm and deepfake text patterns.
- Dark Web Monitoring: Expanding data sources to scrape Tor hidden services for pre-emptive leak detection.
- Field Mobile App: Developing a React Native version for agents in the field to receive push notifications about their threat status.


Log in or sign up for Devpost to join the conversation.