-
-
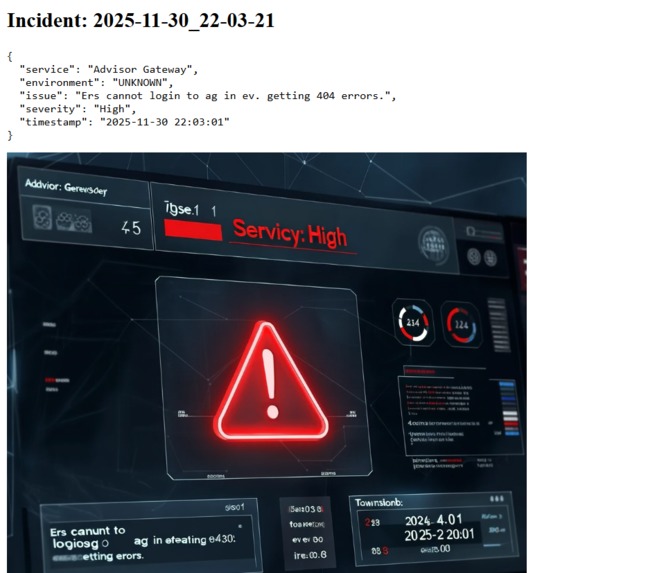
one of the generated image

I created a dashboard to assist teams in real-time incident monitoring, analysis, and response. The project was motivated by the difficulties encountered in contemporary enterprise settings, where numerous crucial systems produce alerts at the same time, making it challenging to prioritize and take prompt action.
Inspiration
The requirement for a simple, user-friendly interface to display incident data and incorporate AI-powered analysis motivated me. In order to speed up response times for important events, I wanted to develop a tool that not only showed incidents but also offered context and severity insights.
What it does
shows the severity, description, and timestamps of incidents. enables users to view detailed information by clicking on an incident. offers a quick overview to assist teams in setting priorities and acting swiftly.
How we built it
Frontend: Constructed using Tailwind CSS, React, and React Router for navigation. Incidents are displayed by components such as IncidentCard. Backend: Integrated Bria production API to retrieve AI insights and incident data. Endpoints effectively supply the frontend with data.
Challenges we ran into
Data from the API that was inconsistent or missing needed to be handled carefully to avoid UI crashes. Managing AI-generated visualizations: Due to free-tier restrictions, some generated images could not be saved.
Accomplishments that we're proud of
developed an interactive, fully functional incident dashboard that incorporates AI insights. The project was designed to be scalable, allowing for the addition of new features or data sources without requiring significant modifications.
What we learned
Frontend Development: Using React, Tailwind CSS, and React Router, I created a responsive dashboard with dynamic elements like IncidentCard. Backend/API Integration: To retrieve incident data and insights produced by AI, the Bria production API was integrated. acquired proficiency in managing state and handling asynchronous requests. Data Handling & Visualization: Acquired knowledge of how to organize incident data for convenient viewing, gracefully handle missing fields, and utilize UI cues and badges to convey severity levels.
What's next for FIBO-INCIDENT-VISUALIZER
Improved AI Insights: Use more in-depth AI analysis to generate automated incident classification and predictive alerts. Interactive Visualizations: To improve comprehension of incident trends over time, include timelines, charts, and heatmaps. User Authentication & Roles: To protect sensitive incident data, implement role-based access and login features. Persistent Storage for Generated Images: To avoid loss and enable historical review, store AI-generated visualizations locally or in a database. Real-Time Updates: To ensure that incidents appear on the dashboard as soon as they happen, enable WebSocket or polling-based updates.

Log in or sign up for Devpost to join the conversation.