The correct description of the project is in the blog post here
(Note: This is a work in progress)
PloTTY is a set of linux command lines that transforms images into traces, suitable for drawing on a vintage Casio PB-700, with its FA-10 pen plotter.
Here is a typical example of the result

Read more to get more detail of the process!
First, the source image, courtersy midjourney:

The source is then resized and converted to black and white, giving:

The large black areas need to be removed, so an erosion map is computed:

And removed from the orginal image, leading to:

This eroded picture contains lines, that we can convert to single pixels, giving:

This is still a pixel image, but it can be traced, giving the following segments:

Segments are ordered and flipped to minimize the travel of the plotter head:

And, drawing the image would give the following result:

The image is fundamentally a lists of coordinates, mainly:
[[[30.8, 62.4], [31.0, 62.4]],
 [[32.2, 62.4], [31.2, 62.2], [31.2, 61.0], [30.8, 61.0], [30.8, 60.0], [30.4, 60.0], [30.8, 59.2], [31.4, 60.8], [33.2, 62.2], [32.2, 62.6]],
 [[33.6, 63.0], [33.2, 63.0], [33.2, 62.4], [33.8, 62.4]],
 [[34.6, 62.8], [33.8, 62.6], [33.8, 63.2], [37.4, 62.6], [39.4, 60.8], [39.6, 59.6], [40.2, 59.2], [40.2, 55.8], [39.0, 53.6], [38.0, 53.4], [37.0, 52.4], [34.0, 52.4], [33.2, 52.8], [31.0, 55.2], [30.4, 57.4], [30.8, 59.0], [30.4, 58.8]],
 [[38.4, 59.8], [36.8, 59.8], [36.2, 59.2], [36.0, 57.6], [36.6, 56.8], [38.8, 56.8], [39.2, 59.2]],
a little more than a hundred lines skipped
 [[64.4, 18.8], [64.0, 18.2], [63.6, 18.8]],
 [[63.8, 18.0], [63.4, 17.0]],
 [[79.6, 27.6], [79.6, 27.8]],
 [[14.8, 43.2]],
 [[13.8, 43.2], [13.8, 42.8]]]
Those coordinates can then be turned into a basic program for the PB-700:
1LPRINT CHR$(28);CHR$(37):LPRINT"O0,-96"
2LPRINT"D30.8,62.4,31.0,62.4"
3LPRINT"D32.2,62.4,31.2,62.2,31.2,61.0,30.8,61.0,30.8,60.0,30.4,60.0"
4LPRINT"D30.4,60.0,30.8,59.2,31.4,60.8,33.2,62.2,32.2,62.6"
5LPRINT"D33.6,63.0,33.2,63.0,33.2,62.4,33.8,62.4"
6LPRINT"D34.6,62.8,33.8,62.6,33.8,63.2,37.4,62.6,39.4,60.8,39.6,59.6"
7LPRINT"D39.6,59.6,40.2,59.2,40.2,55.8,39.0,53.6,38.0,53.4,37.0,52.4"
8LPRINT"D37.0,52.4,34.0,52.4,33.2,52.8,31.0,55.2,30.4,57.4,30.8,59.0"
9LPRINT"D30.8,59.0,30.4,58.8"
10LPRINT"D38.4,59.8,36.8,59.8,36.2,59.2,36.0,57.6,36.6,56.8,38.8,56.8"
and a lot of lines, until
155LPRINT"D79.6,27.6,79.6,27.8"
156LPRINT"D13.8,43.2,13.8,42.8"
999LPRINT"M0,-20"
Which, in turn, can be turned into a wav file using the casutil software and uploaded on the real machine (only 10 minutes :-))
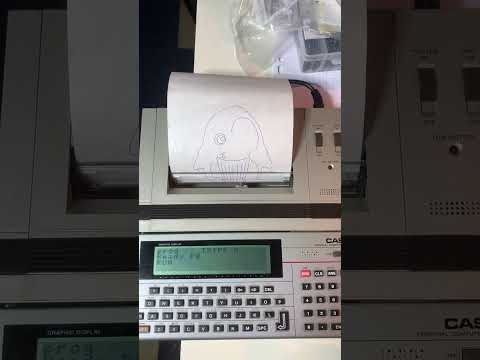
The PB-700 is then able to draw our nice penguin:
Click below to see a video of a PB-700 printing the real penguin!
The tracing code is in trace.py and outputs the path in json. The basic generation in json2basic.py, and take the json in input. There are example source images and results in the image subdirectory. You can use casutil to generate a wav file for consumption of you PB-700/FA-10!