
Getting Started With InfluxDB on Raspberry Pi
InfluxDB is a time series database that stores time-stamped data from IoT devices, like environmental data. Installing InfluxDB should be straightforward, but the many versions can be confusing. In this tutorial, I’ll show you how to get InfluxDB onto your Raspberry Pi.
InfluxDB can be installed via the apt package manager after its official repository has been added. Configuration is then completed through the built-in web interface.
It also integrates easily with Grafana for data visualization and analysis. In this post, I’ll clarify the different versions and provide a concise guide to installing and configuring your InfluxDB database to monitor the performance characteristics of your Raspberry Pi.
If you’re like me and sometimes mix up syntax between programming languages, I’ve got just the thing for you. I’ve put together a Python cheat sheet with all the essential syntax in one place, so you can keep it handy and avoid any confusion. Download it here for free!
What is InfluxDB?
InfluxDB is a time series database. Like any other database, it stores and queries large amounts of data, such as PostgreSQL, MariaDB, and MySQL. However, it is more optimized for time-stamped data, i.e., the key index is time.
Time series databases are traditionally used in financial market analysis and industrial automation setups. However, they can also be extremely convenient for system monitoring tasks, DevOps, IoT monitoring, and sensor data monitoring.
A few key alternatives to InfluxDB include Prometheus, Graphite, and TimescaleDB. However, unlike other databases built on the base of relational databases (e.g., TimescaleDB is the time series version of PostgreSQL), InfluxDB was built from as a time series database and, therefore, is much more optimized.
You might also like: Turn your Raspberry Pi into a money-making machine
InfluxDB also has an edge-optimized version for low-power devices like Raspberry Pi, making Raspberry Pi and InfluxDB a great combo.
How to Install InfluxDB on Raspberry Pi
Having understood InfluxDB, we are ready to install it. Although InfluxDB can be installed using a simple apt command, there are a few things to consider first.
Prerequisites
Before installing InfluxDB on your Raspberry Pi, ensure you have installed the latest version of Raspberry Pi OS. Ensure it is booting correctly and that you have connected a display, keyboard, and mouse or established an SSH connection.
Recommended Tutorials:
If like me, you always mix the languages syntax, download my cheat sheet for Python here!
Download now
- Install Raspberry Pi OS Bookworm on Raspberry Pi (Illustrated Guide)
- Raspberry Pi Not Booting? 13 Usual Causes & Solutions Listed
- Connecting Your Raspberry Pi to a Monitor: A Complete Guide
- Use SSH to Remote Control Your Raspberry Pi: A Complete Guide
Selecting the Correct Version
Another important yet confusing thing we need to understand is the different versions of InfluxDB that are available. InfluxDB is presently available in three versions:
- InfluxDB V1: This is the first version of InfluxDB. It is focused on time-series storage with InfluxQL as the query language and requires separate tools for dashboards and processing.
- InfluxDB V2: This was an upgrade to the first version. This version introduced Flux as the query language, an integrated dashboard, token-based auth, and a more streamlined experience. Although Flux is a more powerful query language than InfluxQL, owing to the steeper learning curve of V2 and the stability of V1, most people prefer to stick to V1.
- InfluxDB V3 (Alpha): This is the latest version of InfluxDB. This version introduces major architectural shifts using Apache Arrow/Parquet, native SQL queries, and cloud-first optimizations. However, it is still in Alpha and not recommended for production use.
I have done my best to summarize the different aspects of the version, but there is still much to unpack. One important factor to note is that Flux has become an obsolete query language. Consequently, the InfluxDB team has decided to revert to a SQL-based query language for their latest version.
For the purpose of this tutorial, we have chosen InfluxDB V2 as the target software. Nonetheless, the installation procedure for InfluxDB V1 is very similar, and this tutorial can also be used to install V1.
Installing InfluxDB
Finally, we are now ready to install InfluxDB on our Raspberry Pi. To do so, follow these steps:
- Make sure your system is up-to-date using the command:
sudo apt update && sudo apt full-upgrade
- Add the InfluxData key to verify downloads and add the repository:

curl --silent --location -O \
https://repos.influxdata.com/influxdata-archive.key
echo "943666881a1b8d9b849b74caebf02d3465d6beb716510d86a39f6c8e8dac7515  influxdata-archive.key" \
| sha256sum --check - && cat influxdata-archive.key \
| gpg --dearmor \
| sudo tee /etc/apt/trusted.gpg.d/influxdata-archive.gpg > /dev/null \
&& echo 'deb [signed-by=/etc/apt/trusted.gpg.d/influxdata-archive.gpg] https://repos.influxdata.com/debian stable main' \
| sudo tee /etc/apt/sources.list.d/influxdata.list- Now you can install InfluxDB V2 using the command:
sudo apt update && sudo apt install influxdb2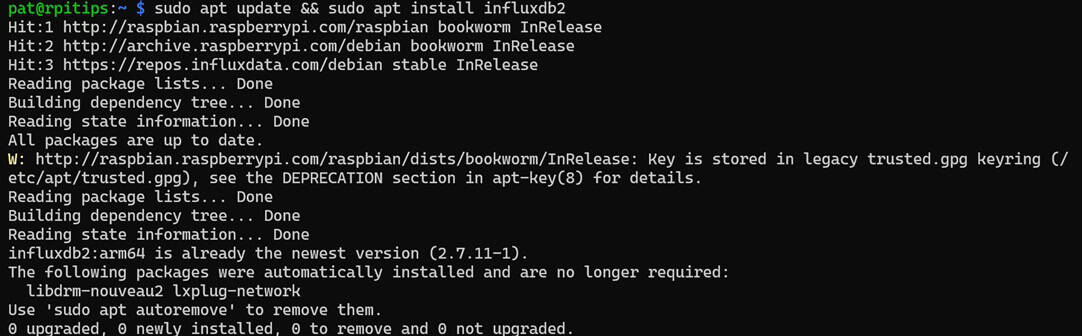
- If you want to install InfluxDB V1 instead, you can use this command:
sudo apt update && sudo apt install influxdb - Now you can start the InfluxDB service:
sudo service influxdb start - To verify that the service has started, you can use this command:
sudo service influxdb status
That’s it. We have successfully installed InfluxDB on our Raspberry Pi and can start configuring and using it.
Are you a bit lost in the Linux command line? Check this article first for the most important commands to remember and a free downloadable cheat sheet so you can have the commands at your fingertips.
Getting Started with InfluxDB
Having installed InfluxDB on our Raspberry Pi, we are ready to start using it. There are three different ways to interact with your InfluxDB database.
- Integrated dashboard (Only available with versions 2 and 3)
- Influx CLI 2.0.0+ (Only available with versions 2 and 3)
- InfluxQL Shell V1
Integrated Dashboard
From version 2 onwards, an integrated dashboard is available. The dashboard makes getting started and working with the database significantly intuitive and user-friendly.
If you’re running version 1, skip directly to the “InfluxQL Shell V1” section to get started.
If like me, you always mix the languages syntax, download my cheat sheet for Python here!
Download now
To access your dashboard, follow these steps:
- Make sure your InfluxDB server is running using the command:
sudo service influxdb status - Open a web browser on any computer connected to the same network as your Raspberry Pi and navigate to the following address:
http://<IPADDRESS or HOSTNAME>:8086
- You will be greeted with this web page.

- Click on “Get Started.”
- Enter the details on the next page and click “Continue.”

- InfluxDB will now display an API token on your Raspberry Pi. This token is required for all Super User privileges. Copy and save it somewhere, as it will not be shown once you exit this screen.

- Click on “Quick Start.”
- You will be displayed various tutorial options regarding using InfluxDB with various programming languages. Choose the programming language of your choice. Since I plan on using it with Python, I will select that.

- This will take you to a detailed tutorial on integrating InfluxDB with your chosen programming language/ environment. Follow this tutorial to learn everything you need to get started.

- The integrated dashboard comes with many options, including the data explorer.

- And the ability to create your own dashboards to visualize the data.

The integrated dashboard is a great tool in version 2 of InfluxDB. However, if you’re more comfortable with the CLI, it is also available. We’ll discuss it next.
Influx CLI 2.0.0+
Another way to access and manage your database is through the Influx CLI. To get acquainted with Influx CLI, follow these steps:
- Before starting the Influx CLI, we need to add active configuration data for our database. You can do so with this command:
influx config create --config-name CONFIG_NAME --host-url http://localhost:8086 --org ORG_NAME --token API_TOKEN --active
(Replace CONFIG_NAME with yours and API_TOKEN with what you previously copied.)
- Now, you can access the CLI help page by simply using the command:
influx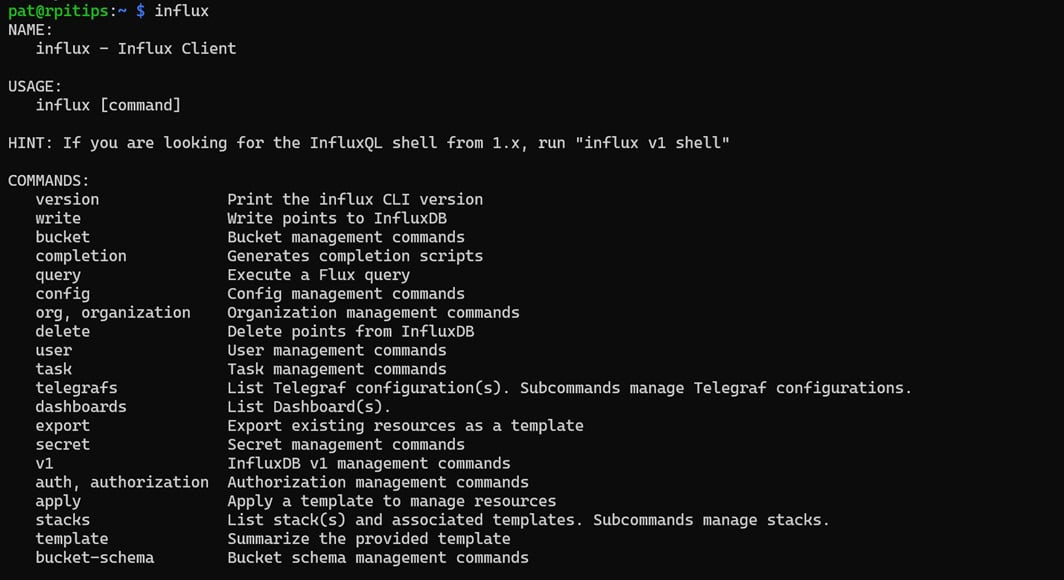
- Before doing anything else, let us create a bucket. To do so, use this command:
influx bucket create --name <Bucket Name> --org <Org Name>
- For example, you can use this command to view the list of all available buckets in your database:
influx bucket list
- Now, you can add data to your bucket using the write command:
influx write --bucket <BUCKET NAME> "table_name,<tag_key>=<taga_value>,<tag_key>=<tag_value> <field_key>=<field_value>,<field_key>=<field_value> <timestamp>"
- We can then use the query command to see the data inside our bucket:
influx query <FLUX QUERY>
- You can see how to write Flux queries on their documentation page.
Influx CLI can be a bit confusing at the start. But you can undertake more complicated functions once you get the hang of it. You can find detailed documentation regarding all command line options on their official documentation page.
InfluxQL Shell V1
InfluxQL Shell V1 is the default interacting methodology for version 1 of InfluxDB. InfluxQL Shell is also available for version 2 of InfluxDB. However, version 2 uses a different data storage architecture, i.e., database and retention policies have been replaced with buckets.
DBRP Mapping
By default, whenever you create a bucket in InfluxDB version 2, a virtual DBRP mapping is generated automatically. This allows you to access the bucket from the InfluxQL shell in read-only mode. To verify your DBRP Mappings, you can use this command:influx v1 dbrp list
If you wish to access the bucket in complete read-write mode, you need to create a DBRP mapping manually using the command:influx v1 dbrp create --db <Bucket_Name> --rp <Retention_Policy_Name> --bucket-id <Bucket_ID> --default
As you can see, our new retention policy has been linked to the bucket and set as the default retention policy for this bucket. Now, we can use the InfluxQL Shell V1 as if we were running InfluxDB version 1.
You might also like: Tired of Raspberry Pi OS? Level up with these top-rated systems.
Using the Shell
Download the free PDF, keep it open, and stop wasting time on Google.
Download now
If you have installed version 1 of the InfluxDB, this is the portion of the tutorial you would start from. To access and use the InfluxQL Shell V1, follow these steps:
- Type this command and press enter to access the shell:
influx v1 shell
- If you are using version 1 and have jumped directly to this part of the tutorial, you haven’t already created the database. You need to follow these steps before continuing with the rest of the tutorial:
- You only need this command to access the shell:
influx - Now, you can use this command to create a database:
CREATE DATABASE <DB NAME>
- You only need this command to access the shell:
- We first need the shell to know which bucket we are working with. To do so, use this command:
USE "<DB NAME>"
- Now we can insert data into our bucket using the command:
INSERT <measurement>[,<tag-key>=<tag-value>...] <field-key>=<field-value>[,<field2-key>=<field2-value>...] [unix-nano-timestamp]
- To view the data in our bucket, we can run a simple SQL query:
SELECT * FROM <TABLE NAME>
- Upon pressing Enter, all the data stored in the bucket will be displayed in a tabular format.

As you can see, the InfluxQL Shell V1 is available in all three versions of InfluxDB and is extremely easy and intuitive to use. Its SQL syntax makes the learning curve significantly easier for newcomers.
If you’re new to the Linux command line, this article will give you the most important Linux commands to know, plus a free downloadable cheat sheet to keep handy.
If you prefer watching videos instead of reading tutorials, you’ll love the RaspberryTips Community. I post a new lesson every month (only for members), and you can unlock them all with a 7-day trial for $1.
Your First InfluxDB Program
We are ready to create our first InfluxDB program. In this tutorial, we will create a Raspberry Pi hardware monitoring setup. A Python script will save the hardware statistics into the database, and we will use InfluxDB V2’s built-in dashboard functionality to visualize the data.
Setting Up The Environment
Before getting started writing our Python script, we must ensure that all required programs and libraries are installed and up to date. To do so, follow these steps:
- Make sure you have Python and pip installed and up-to-date using the command:
sudo apt install python3 python3-pip
- Now we need to create a Virtual Environment for our setup. Let’s create a folder for the virtual environment using the command:
mkdir /home/$USER/pythonVEnvs
- Next, create the Virtual Environment using the command:
cd /home/$USER/pythonVEnvs && python3 -m venv influxDB
- Finally, we can activate our Virtual Environment using the command:
source influxDB/bin/activate
- Having activated our Virtual Environment, we can now install the requisite libraries using the command:
pip3 install influxdb-client psutil
That’s it! Our environment is all set up with the required programs and libraries.
Writing & Running Our Python Script
For this example, we will use a Python script to monitor the CPU temperature, CPU usage, and memory usage of our Raspberry Pi every 10 seconds and save it into our bucket. To do so, first, we need to create a bucket into which to put the data.
You can create a bucket by following these steps:
- Navigate to the “Buckets” section on the web interface.

- Next, click on “Create Bucket” and give it the name “raspberryPiMonitor” for example.

- Type in the bucket name and click on “Create”.

With the bucket created, we can now start working on our program. To do so, create a Python script using the command (or any other text editor of choice):nano myPythonScript.py
Download the free PDF, keep it open, and stop wasting time on Google.
Download now
Now, copy this code and paste it into the text editor:
# Import required libraries
from influxdb_client import InfluxDBClient, Point
from influxdb_client.client.write_api import SYNCHRONOUS
import psutil  # Library to fetch system performance metrics
import time
import os

# -------------------------------
# CONFIGURATION - Set up InfluxDB connection details
# -------------------------------
INFLUXDB_URL = "http://localhost:8086"  # URL of InfluxDB (running locally in this case)

# IMPORTANT: Avoid hardcoding your token! Use an environment variable instead.
INFLUXDB_TOKEN = os.getenv("INFLUXDB_TOKEN")  # Fetch token from environment variable
INFLUXDB_ORG = "rpitips"  # Your InfluxDB organization name
INFLUXDB_BUCKET = "raspberryPiMonitor"  # Name of the InfluxDB bucket

# -------------------------------
# INITIALIZE INFLUXDB CLIENT
# -------------------------------
client = InfluxDBClient(url=INFLUXDB_URL, token=INFLUXDB_TOKEN, org=INFLUXDB_ORG)
write_api = client.write_api(write_options=SYNCHRONOUS)  # Use synchronous writes for simplicity

# -------------------------------
# FUNCTION: Get Raspberry Pi System Metrics
# -------------------------------
def get_system_metrics():
    """
    Collects hardware performance metrics of the Raspberry Pi.
    Returns:
        cpu_temp (float): CPU temperature in Celsius
        cpu_usage (float): CPU usage percentage
        ram_usage (float): RAM usage percentage
    """
    # Fetch CPU temperature using Raspberry Pi's built-in command
    cpu_temp = float(os.popen("vcgencmd measure_temp").readline().replace("temp=", "").replace("'C\n", ""))

    # Get CPU usage percentage (over a 1-second interval)
    cpu_usage = psutil.cpu_percent(interval=1)

    # Get RAM usage percentage
    ram_usage = psutil.virtual_memory().percent

    return cpu_temp, cpu_usage, ram_usage

# -------------------------------
# FUNCTION: Write Metrics to InfluxDB
# -------------------------------
def write_to_influxdb():
    """
    Fetches system metrics and writes them to the InfluxDB database.
    """
    # Get system performance metrics
    cpu_temp, cpu_usage, ram_usage = get_system_metrics()

    # Create a data point for InfluxDB
    point = (
        Point("raspberry_pi")  # Measurement name
        .tag("device", "raspberry_pi")  # Tag (useful for filtering in queries)
        .field("cpu_temperature", cpu_temp)  # Field for CPU temperature
        .field("cpu_usage", cpu_usage)  # Field for CPU usage
        .field("ram_usage", ram_usage)  # Field for RAM usage
    )

    # Write data to InfluxDB
    write_api.write(bucket=INFLUXDB_BUCKET, org=INFLUXDB_ORG, record=point)

    # Print confirmation message for debugging
    print(f"Data written: Temp={cpu_temp}°C, CPU={cpu_usage}%, RAM={ram_usage}%")

# -------------------------------
# MAIN LOOP: Collect and Store Data Continuously
# -------------------------------
if __name__ == "__main__":
    print("Starting Raspberry Pi monitoring... Data will be written every 10 seconds.")
    while True:
        write_to_influxdb()  # Collect and send data
        time.sleep(10)  # Wait 10 seconds before collecting the next data point
Make sure you edit the configuration data, such as bucket and organization names, according to your setup.
Before executing the program, you must set the environment variable INFLUXDB_TOKEN to the API Token of your InfluxDB setup using this command:export INFLUXDB_TOKEN="Your-API-Token"
Finally, run this program using the command:python3 myPythonScript.py
As you can see, this program will start recording the performance characteristics of my Raspberry Pi onto the InfluxDB bucket. Read on as we set up our dashboard to monitor the data being saved in the bucket.
Visualizing Data
There are several options for visualizing your data. However, we will use the dashboard option available in the InfluxDB V2 web API. To visualize your data, follow these steps:
- Navigate to the “Dashboards” menu on your web API and click on “Create Dashboard” -> “New Dashboard.”

- You will be welcomed to an empty dashboard, as shown below:

- You can add graphical widgets to the dashboard by clicking “Add Cell”.

- Select the “Cell Name”, the type of visualization required (e.g., linear graph), the bucket, table, and the time series to display, and click on “Submit” to see a preview of the visualization.

- Finally, you can click on the small tick mark at the top right of the web page to finalize this cell and add it to your dashboard.

- Adding and configuring these cells allows you to customize your dashboard according to your preference.

The built-in dashboards available with InfluxDB V2 are intuitive and easy to use. However, InfluxDB can be integrated with other visualization tools.
Suppose you are more comfortable with Grafana or are using InfluxDB V1 (which does not come with the dashboard tools). In that case, you can follow this wonderful tutorial on using Grafana on Raspberry Pi.
Recommended Tutorials:
As you can see, InfluxDB is extremely easy and intuitive to install and use. InfluxDB has a comprehensive documentation page that can be used to learn or troubleshoot any issue you might be facing.
Whenever you’re ready, here are other ways I can help you:
Test Your Raspberry Pi Level (Free): Not sure why everything takes so long on your Raspberry Pi? Take this free 3-minute assessment and see what’s causing the problems.
The RaspberryTips Community: Need help or want to discuss your Raspberry Pi projects with others who actually get it? Join the RaspberryTips Community and get access to private forums, exclusive lessons, and direct help (try it for just $1).
Master your Raspberry Pi in 30 days: If you are looking for the best tips to become an expert on Raspberry Pi, this book is for you. Learn useful Linux skills and practice multiple projects with step-by-step guides.
Master Python on Raspberry Pi: Create, understand, and improve any Python script for your Raspberry Pi. Learn the essentials step-by-step without losing time understanding useless concepts.
You can also find all my recommendations for tools and hardware on this page.