
How To Use ‘journalctl’: The Complete Linux Command Guide
Everything is in the logs, they say. You know how important it is to analyze them effectively, but that doesn’t mean it’s easy. Don’t worry, this is the perfect place to start getting better at it, and in just a few minutes you’ll know how to use the “journalctl” command to find exactly what you need.
journalctl is a useful Linux utility for viewing and analyzing logs managed by systemd. It’s designed to provide an organized way to troubleshoot, monitor, and analyze OS performance and behavior information.
In this article, we’ll explore how to visualize and analyze your system logs, whether you use it for troubleshooting or monitoring the behavior of a specific process. You will learn all the tricks to use it like an expert!
If you need help with Linux, I’ve got something that can help you right away!
Download my free Linux commands cheat sheet – it’s a quick reference guide with all the essential commands you’ll need to get things done on your system. Click here to get it for free!
Command Syntax
The journalctl command can be used without additional arguments and will do its job. But as with many other Linux commands, adding some extra things to its syntax can help you get what you want faster.
Here is the structure of this command syntax:journalctl [OPTIONS] [ARGUMENTS]
For example:

In the syntax structure:
You might also like: Pi5 vs. Pi4: I tested them, here's the result
- Options specify the functionality you want to apply, such as filtering logs by time, prioritizing specific units, or customizing how the logs are displayed.
- Arguments provide the additional details required by certain options, such as a unit name, a time range, or a specific log level.
Usage Example
When you use journalctl you will realize that it is a simple command that can be used, only with the command itself, but if you need more features you must add more options, here you can see different uses with their respective examples.
Displaying All Current Logs
Logs are structured records that store data related to system events or specific processes. This data can include general system activity, warnings, or detailed error reports, providing a comprehensive view of your system’s performance.
You can display all logs generated on your system by simply running the journalctl command without adding any options or arguments:journalctl
Grab This Cheat Sheet!
I've compiled the must-know commands in a simple PDF for quick reference.
Download now

When you use the command, it will show you the logs from the beginning, you can use different keyboard keys to navigate between the logs:
- Up/Down: Move between logs.
- Left/Right: Scroll through long log entries horizontally.
- Space: Jump forward to the most recent logs quickly (you can jump up to 50 lines of logs for each key press).
- CTRL + C: Break the current screen and return to the terminal.
Although you can view all logs, and you may think that it is useful to review each one in detail, it is quite the opposite, this is not a useful command in itself, as you will waste time reviewing all services log by log, when you may be interested in only one.
I’ll now show you a few tricks to use this command efficiently.
If you’re new to the Linux command line, this article will give you the most important Linux commands to know, plus a free downloadable cheat sheet to keep handy.
Filtering Logs for a Specific Service or Unit
You can filter all logs and specify them in a single service unit to reduce the amount of logs to display by focusing only on the logs related to the specified service.
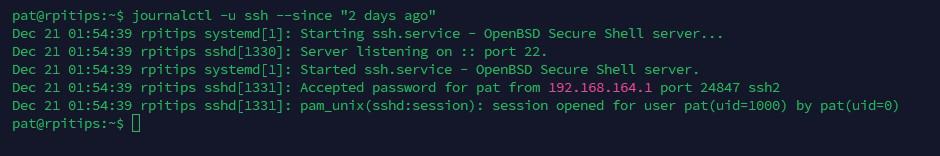
To specify this filter, you must use the -u option and specify the service name:journalctl -u <service-name>

This command filters the logs to show only those related to the service you specify. It’s useful for debugging or troubleshooting issues with a particular service, script, or application.
Viewing Logs for a Specific Date Range
Let’s move on to another option, maybe specifying the service is not enough.
Sometimes, you may need logs from a specific time frame, such as when a problem occurred a few days ago. To do this, use the –since option:journalctl --since "date" ("YYYY-MM-DD HH:MM:SS")
You can combine this with the –until option to define an exact time range:journalctl --since "3 days ago" --until "1 day ago"
Grab This Cheat Sheet!
I've compiled the must-know commands in a simple PDF for quick reference.
Download now
This method is useful for finding problems that occurred during a specific time frame. It is more useful when combined with the service filtering from the previous section. You won’t miss any error even if it happened a few days ago when you weren’t on your PC.
Displaying Only N Lines of Logs
There are some services or applications with an exaggerated amount of logs, and displaying all of them is unnecessary if you need to see a few recent entries.
You can choose how many lines of logs you want to display by adding the -n option along with the number of your choice:journalctl -u <init.service> -n <number-of-lines>
Note: When using this command and choosing the number of lines you want to be displayed, you have to keep in mind that the logs displayed will be the most recent ones. Example, if you choose 10, it will show the latest 10 lines of logs.

With this option, you can take a quick look at the service of your choice, which is enough to make quick and smooth troubleshooting.
Show most recent logs first before old logs
By default, journalctl displays logs in chronological order, starting with the oldest; this can be a bit tedious because if you need the latest log, you have to navigate to the last one.
To reverse this order and show the most recent logs first, you can use the -r option:journalctl -r

Main Options
Now that we have seen a few examples, the whole structure of this command should be clearer to you. Let’s recap all the main options we have seen, and a few more that can be useful.
Source Control Options
- –system, –user: Controls whether to show messages from system services or user services. If neither is specified, all messages the user can see are displayed.
- -M, –machine=: Show messages from a running, local container.
- -D DIR, –directory=DIR: Specify a directory for journal files instead of default paths.
- –root=ROOT: Operate on journal directories beneath a specified root directory.
- –image=IMAGE: Operate on journal files in a disk image.
- –namespace=NAMESPACE: Show log data from a specific journal namespace.
Filtering Options
- -S, –since=, -U, –until=: Display journal entries starting from or up until a specific date.
- -b, –boot: Show logs from a specific boot.
- -u, –unit=UNIT|PATTERN: Filter logs by a specific systemd unit.
- -t, –identifier=SYSLOG_IDENTIFIER: Filter logs by syslog identifier.
- -p, –priority=: Filter by message priority (from 0 to 7).
- -g, –grep=: Filter logs based on a regex pattern.
- -k, –dmesg: Show only kernel messages.
Output Options
- -f, –follow: Show new journal entries continuously.
- -o, –output=: Control output formatting (e.g., short, verbose, json, short-iso).
- –utc: Express time in Coordinated Universal Time (UTC).
- –catalog: Add explanatory help texts to log messages.
- –no-hostname: Exclude the hostname field from logs originating from the local host.
- -n, –lines=: Limit the number of journal entries to show.
- –reverse: Display logs with the most recent entries first.
- -a, –all: Show all fields in full, including unprintable or long fields.
Tips
Want more? Here are some bonus tips to get even more efficient with this journalctl command.
Grab This Cheat Sheet!
I've compiled the must-know commands in a simple PDF for quick reference.
Download now
Read next: 7 Hidden Raspberry Pi Features You Should Be Using
Combine it with grep to find specific lines
You can do a more precise search of your logs by using journalctl combined with grep, which also allows you to filter out specific words or patterns from a dataset of text (everything about the grep command is explained here).
Using grep in addition to another command is common practice for finding lines of keyword text in hundreds or thousands of logs.
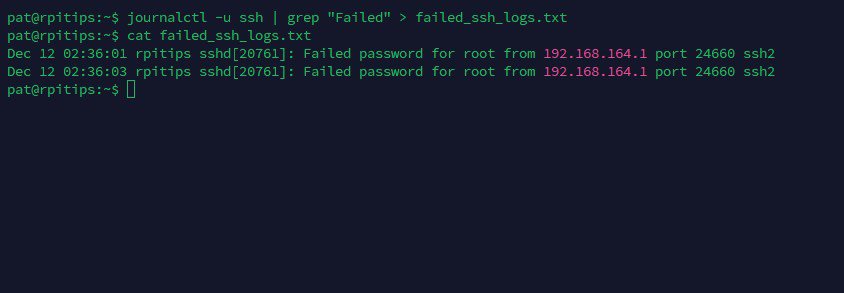
To integrate grep into our original journalctl command, you need to add the | symbol and add the grep command, there are many ways to use grep, but the simplest is to enclose the keyword you want to search in quotes:journalctl | grep "word-to-search"

As you can see in the example image, this is very useful to search for a specific line or error in the piles of data in the logs. In my case, I used the word “Failed” to visualize how many times a password attempt failed and show only the logs related to that.
Export Logs for Backup or Analysis
If you need to save logs for future reference or share them with someone else, you can export them to a file. This can be done using the > operator, which redirects the output of a command to a file:journalctl > text-for-saving-logs.txt

This command saves all logs to a file of your choice. If the file doesn’t exist, it will be created automatically.
You can also apply any of the filters from the previous section like filtering by service, date, or priority level, and combine them with grep to limit the output before exporting:journalctl -u <service.name> | grep "Word-to-search" > file.txt
Besides allowing you to have a backup of the logs, you can have it for reference or share it whenever you need it, there are no limits to what you can do with the text file.
Filter Logs by Priority Levels
System logs in Linux are categorized into priority levels to indicate their severity. These levels range from emergency (highest priority) to debug (lowest priority):
- 0/emerg: Emergency – The system is unusable.
- 1/alert: Alert – Immediate action required.
- 2/crit: Critical – Critical conditions.
- 3/err: Error – Error conditions.
- 4/warning: Warning – Warning conditions.
- 5/notice: Notice – Normal but significant conditions.
- 6/info: Info – Informational messages.
- 7/debug: Debug – Debugging messages.
Grab This Cheat Sheet!
I've compiled the must-know commands in a simple PDF for quick reference.
Download now
To filter logs based on priority, use the -p option followed by the desired level or range. For example, to view only error logs:journalctl -p <priority>
You can use numbers or the name of the priority by itself (3 or error). Note that not all services allow you to filter the log display the way you expect, so it may change.
If you prefer watching videos instead of reading tutorials, you’ll love the RaspberryTips Community. I post a new lesson every month (only for members), and you can unlock them all with a 7-day trial for $1.
Related Questions
How can I see the logs in real time as they happen?
You can follow a log of a specific service or process in real time using the -f (follow) option with journalctl. This will display log entries as they are generated, locking the terminal until you exit with CTRL + C:journalctl -f

You can use this method to monitor a service, while on another screen you start it or run processes within that service depending on what you use. It is quite useful for troubleshooting or monitoring the behavior of the service.
Where are all journalctl logs stored?
All the journalctl logs are stored as a binary file (they cannot be read directly without journalctl) in the /var/log/journal directory.

Note: If your system generates a large number of logs because of the number of services, background processes, or a particular service that generates a lot of logs, they can take up a lot of disk space. To save space, you can delete all the old logs that are no longer needed.
How can I reduce the amount of stored logs?
You can limit the amount of stored logs by modifying the journald.conf configuration file located in the /etc/systemd/ directory. To edit it, use a text editor like nano:

Some key parameters that you can adjust include:
- SystemMaxUse: Defines the maximum disk space the journal can use.
- SystemKeepFree: Ensures a minimum amount of free disk space.
- SystemMaxFileSize: Limits the size of individual log files.
- MaxRetentionSec: Configures how long logs are retained before being deleted.
After you make any changes, remember to restart the journal service to apply the changes and let them take effect.
You can find more about the configuration file by checking their documentation here.
Whenever you're ready, here are other ways I can help you:
Master Linux Commands: Overwhelmed with Linux commands? This book is your essential guide to mastering the terminal. It includes practical tips, real-world examples, and a bonus cheat sheet to keep by your side.
The RaspberryTips Community: Need help with Linux or want to chat with people who actually get it? Join the RaspberryTips Community and get access to private forums, exclusive lessons, and direct support (try it for just $1).
You can also find all my recommendations for tools and hardware on this page.