
9 Best Tools to Monitor Raspberry Pi’s Performance
The Raspberry Pi is a fantastic little computer that packs a powerful punch! To keep everything running smoothly, it’s essential to monitor its performance. Overheating, memory overuse, or sudden slowdowns can impact its performance. Luckily, many great tools are available to help you keep your system healthy and happy!
Tools like top and vcgencmd come pre-installed with Raspberry Pi OS and can monitor the system’s health. Several tools and software, like htop and PiCockpit, are available in the official repository and on GitHub and can be installed to provide additional features/ capabilities.
In this article, I will share nine such tools with you. Whether you prefer lightweight command-line tools or detailed web-based dashboards, this guide will walk you through the best options and how to use them effectively.
If you’re looking for inspiration for your next Raspberry Pi project, I’ve put together a list of 75+ ideas with full descriptions, difficulty ratings, and links to tutorials. Whether you’re a beginner or more advanced, there’s something here for you. Grab the list for free here!
Command Line Tools
Several command-line tools are available to monitor your Raspberry Pi’s performance. The advantage of using command-line tools is that they are less resource-intensive and can also be used over SSH.
top – Basic System Monitoring (Preinstalled)
The top command is one of the first command-line tools that comes to mind when considering hardware monitoring. It is pre-installed on all Linux installations and can be used to view system resources dynamically, similar to the process view of Task Manager in Windows.
Installation
top comes pre-installed with all versions of Raspberry Pi OS. You can verify its version using this command on your terminal:top --v![]()
However, if it is not installed on your Raspberry Pi, you can install the procps package from the official repository:sudo apt install procps
Usage
Basic usage of the top is straightforward. You can enter the command ‘top’ in the terminal and press enter.
This will show dynamically updated information on all the processes running on your system. Towards the top of the screen, you will see system information such as uptime, CPU usage, and memory usage.
Below that is a tabular display of all processes running on your system. The z key enables colours and highlights the process list.
You can also use the i key to hide all idle processes and only see the list of active ones.
If you want to kill a specific process, you can use the k key and enter the process’s PID followed by an enter.
Press enter to confirm.
As you can see, the top can perform essential system hardware monitoring and process management. It can be a great tool if you are looking for something lightweight that comes pre-installed and works similarly to the process view of Windows Task Manager.
htop – Advanced Process & Resource Monitor
htop is a command line tool similar to top. It provides some additional functionality with a more user-friendly interface.
Installation
You can install htop from the official repository using the command:sudo apt install htop
Usage
Like top, you can use htop by entering ‘htop’ in the terminal and press enter.
Need some inspiration for your next Raspberry Pi project? Get access to my personal list here!
Download now
htop has a similar interface as that of top. Towards the top of the screen, you can find system information. However, htop displays information in a more graphical format with bars depicting the percentage usage of each resource.
Unlike top, the htop interface can be navigated using both the keyboard and the mouse. You can switch between the main screen, which shows the resource usage of each process, and the I/O tab, which shows the disk usage and I/O statistics.
You can also click on any statistics to sort based on that resource.
You can select multiple programs simultaneously by navigating to them and pressing the space. Once a few processes have been selected, you can press F9 to kill those processes.
In addition to using the Filter (F4) and Search (F3) functions, you can also use the a key to set the number of CPU cores a process can use.
Similarly, you can use the i key to set IO priority for a specific process.
htop offers all the functionality of top, but comes with a few additional features, a slightly more user-friendly interface, and color coding. Overall, I recommend using htop over top since it is lightweight and provides a more intuitive interface.
vcgencmd – Check CPU Temperature & Clock Speed
vcgencmd is a tool developed by Broadcom. It outputs information from the Raspberry Pi’s VideoCore GPU. It is an excellent tool for checking hardware performance statistics, such as the CPU temperature and the clock speed.
Installation
vcgencmd comes pre-installed with all versions of Raspberry Pi OS and does not need to be installed manually. You can find the source code of this tool on GitHub.
Usage
It is primarily a debugging tool, and documentation on it is scanty. However, you can find a list of all available command line options using:vcgencmd commands
You might also like: Tired of Raspberry Pi OS? Level up with these top-rated systems.
For example, we can use this command to determine the temperature of the Raspberry Pi SoC using its internal temperature sensor:vcgencmd measure_temp![]()
Alternatively, we can use this command to find the temperature of the PMIC on Raspberry Pi 4:vcgencmd measure_temp pmic![]()
Similarly, this command can find the ARM Processor’s clock speed:vcgencmd measure_clock arm![]()
vcgencmd commands are not dynamic like top or htop. However, these commands are compatible with Python and can be used in Python code to make a dynamically monitoring script. You can read the details of the Python library on this GitHub page.
While no official documentation for this tool exists, you can find some useful commands and their relevant arguments on this GitHub page.
If you’re new to the Linux command line, this article will give you the most important Linux commands to know, plus a free downloadable cheat sheet to keep handy.
iostat – Monitor CPU & Disk Usage
The iostat tool monitors the system input/ output statistics for devices and partitions. It can be an excellent tool for debugging or monitoring a specific device’s read and write speed. iostat monitors the input/ output by observing the time the devices are active and their average transfer speed.
Need some inspiration for your next Raspberry Pi project? Get access to my personal list here!
Download now
Installation
iostat is included in the sysstat package and can be installed using the command:sudo apt install sysstat
Usage
To use this command line tool, type iostat in your terminal and press enter.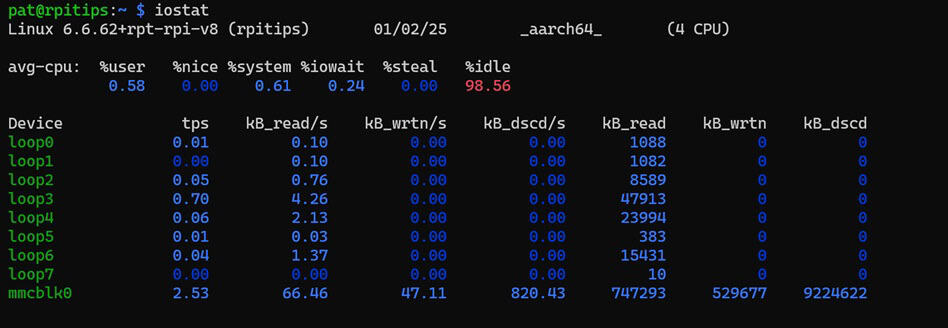
This display shows the CPU usage in the first table and the device’s I/O usage in the second table. The device names are the same as listed in the /dev directory.
By default, the iostat uses the kilobytes. If you want to see statistics in megabytes, you can use the -m flag:iostat -m
The output of this command is not dynamic. It only shows the snapshot values of the instance that this command was executed. However, enter the delay and number of repeats in the command below to do a trend analysis:iostat <flags> <delay> <repeats>
iostat is an excellent tool for monitoring device, peripheral, or CPU usage statistics. It should be part of your arsenal of system monitoring tools.
iftop – Real-Time Network Bandwidth Usage
Another helpful system monitoring tool is the iftop. This tool can monitor the network bandwidth usage by different interfaces and help you troubleshoot networking issues.
Installation
You can install iftop through the official repository using the command:sudo apt install iftop
Usage
You can use the command below to display the basic bandwidth usage of your default interface:sudo iftop
The default interface on my Raspberry Pi is the eth0. However, I need to change the interface since I am using WiFi to connect to the internet. To do so, we can use this command:sudo iftop -i wlan0
The interface shows the total upload and download speed and the bandwidth consumed by individual ports.
To see all available command line options, you can run this command:iftop -h
As you can see, iftop has several options to monitor the network traffic on any single interface. If you want to debug or monitor applications that rely on networking, then iftop is a must-have tool for figuring out what’s slowing you down.
If you’re looking for inspiration for your next Raspberry Pi project, I’ve put together a list of 75+ ideas with full descriptions, difficulty ratings, and links to tutorials. Whether you’re a beginner or more advanced, there’s something here for you. Grab the list for free here!
You might also like: I tried to replace my main PC with a Pi 5, here's what happened.
If this project doesn’t work as expected on your setup, don’t worry. You can get help directly from me and other Pi users inside the RaspberryTips Community. Try it for $1 and fix it together.
Graphical Tools
In addition to these powerful command line tools, several graphical tools are available to monitor your Raspberry Pi’s performance. While graphical tools are more resource-intensive, they provide much greater versatility.
Glances – All-in-One Performance Monitoring
Download the free PDF, keep it open, and stop wasting time on Google.
Download now
Glances is a program written in Python. It provides functionality similar to that of top and htop. Still, it comes with many additional functionalities, like monitoring the performance of your device in a web browser on any PC connected to the network.
Installation
Glances can be installed using the official repository. However, the version available on the official repository does not come with the js files; therefore, the web interface doesn’t work correctly. I recommend this method for installing Glances on your Raspberry Pi.
- Make sure your system is up to date using the command:
sudo apt update && sudo apt upgrade
- Install all dependencies using the command:
sudo apt install gcc python3-dev pipx
- Install glances using the pipx command:
pipx install 'glances[all]'
- If you see the note that I received in the above step. Run this command to fix your PATH:
pipx ensurepath
- Now restart your Raspberry Pi to ensure all changes take effect.
That is it. Glances is now installed on your Raspberry Pi and ready to use.
Usage
In its simplest form, Glances can be used like top and htop. Type ‘glances‘ in your terminal and press Enter.
Glances provide an interface similar to top and htop. However, it comes with additional information like CPU temperature, disk read-write speed, and network traffic information.
Additionally, you can run Glances with the -w flag to run it in the web server mode:glances -w
You might also like: Pi5 vs. Pi4: I tested them, here's the result
Now, you can open a web browser on any computer connected to this network and enter this address to access the Glances dashboard:http://<Raspberry Pi IP Address>:61208/
Glances is an excellent tool to monitor your Raspberry Pi’s health over LAN remotely. It comes with all the monitoring prowess of htop coupled with some additional features.
To read more about Glances, you can follow their official GitHub page.
Netdata – Real-Time Web-Based Monitoring
Netdata is another Graphical system monitoring tool that enables you to monitor your Raspberry Pi remotely. It is an open-source, cross-platform tool that can monitor multiple devices simultaneously.
Installation
The installation of Netdata is straightforward using the kickstart.sh, run this command in your terminal:wget -O /tmp/netdata-kickstart.sh https://get.netdata.cloud/kickstart.sh && sh /tmp/netdata-kickstart.sh
It will prompt you a couple of times during the installation when it tries to install some packages from the official repository. Press y at those prompts to finish the installation.
Usage
You can access the Netdata dashboard by entering this web address in a web browser on any PC on the same network as your Raspberry Pi:http://<Raspberry Pi IP>:19999/
You might also like: Pi5 vs. Pi4: I tested them, here's the result
From here, you can either sign in to your Netdata ID to link your Raspberry Pi to it or skip and use the dashboard anonymously, as I chose.
Once signed in, you will be greeted by the Netdata dashboard.
The Netdata comes with a lot of system monitoring tools. It displays all available metrics in neat graphical formats, which can be used to track hardware performance.
All components of the Netdata dashboard can be rearranged as you prefer.
Download the free PDF, keep it open, and stop wasting time on Google.
Download now
If you are working with multiple Raspberry Pis, Netdata can be an excellent tool for monitoring the hardware performance of all those devices simultaneously and remotely. You can read more about this tool on its official website.
Grafana + Prometheus – Custom Dashboard for Metrics
Prometheus is an open-source application that pulls system statistics and saves them in a series database. Similarly, Grafana is another open-source visualization and dashboard tool that runs as a web application. By combining these two applications, we can design our custom dashboards to monitor the health of our Raspberry Pi.
Installation
We need to install both applications separately. The installation process is as simple as downloading the stand-alone binaries from their respective websites and making systemd services for both applications. However, configuring them can take some time.
You might also like: Want to install Windows 11 on your Pi? Here's how
I found this helpful tutorial written by d3noob that I followed to get them set up. You can try following it as well.
Usage
Once installed and configured, you can access the Grafana webpage by opening this web address in any browser connected to the same network as your Raspberry Pi:http://<IP address of your Raspberry Pi>:3000
If you followed the tutorial from d3noob, you have already set up your first dashboard linked to Prometheus.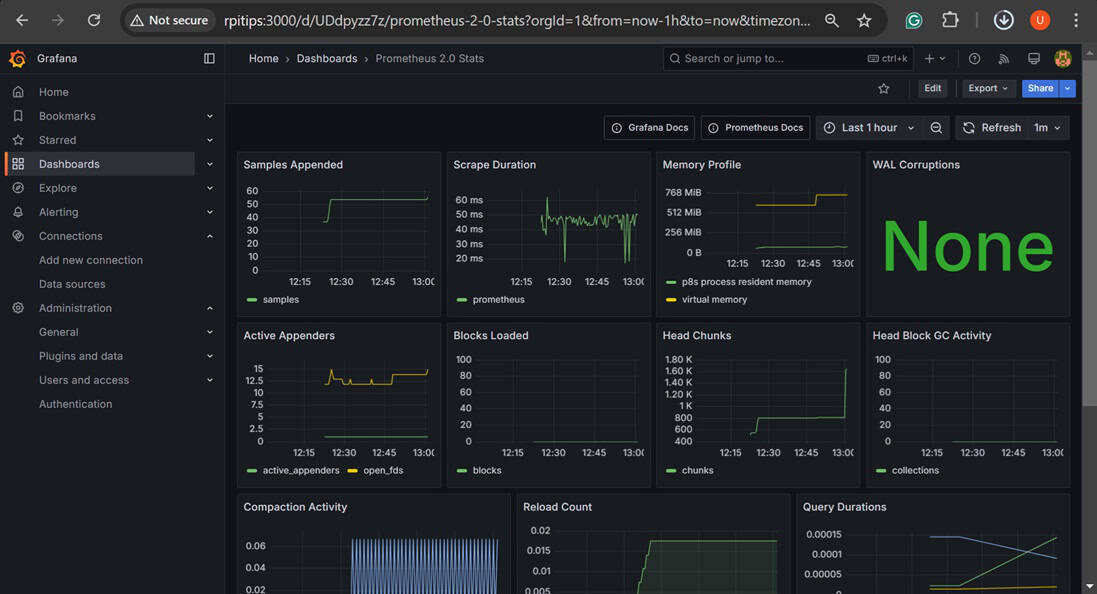
Grafana + Prometheus offers functionality similar to that of Netdata. However, The slightly complicated configuration procedure allows for much more customization. Several dashboard designs are available on the open source, or you can also design your dashboard.
When choosing between Netdata or Prometheus, it comes down to the fact that Netdata works out of the box while Prometheus requires configuration that allows for more customization.
PiCockpit – Web-Based Raspberry Pi Manager
One of the best options to monitor Raspberry Pi’s health and control it remotely is the PiCockpit. It is an all-in-one solution. In addition to monitoring the health of your Raspberry Pi you can also use PiCockpit to control it using a remote terminal.
Installation
To install PiCockpit on your Raspberry Pi, follow these steps:
You might also like: Looking for a fun challenge? Start building your first Raspberry Pi robot!
- Go to the PiCockpit website and click “Get Started for Free.“

- Create a new PiCockpit ID or sign in using Google.
- Once signed in, you will be greeted by this web page.

- Click on “Add Pi”, copy the curl command and run it on your Raspberry Pi terminal.

- Once the script has finished executing on your Raspberry Pi, refresh the webpage to find your device listed.

That is it, we have the PiCockpit installed and configured and it is ready to use.
Usage
The usage of PiCockpit is straightforward forward. You can click on your device on the webpage to get a list of all available options.
As you can see, there are several things you can do with PiCockpit. For basic monitoring of your Raspberry Pi’s health, you can click on PiStats to get a real-time graphical display of the health of your Raspberry Pi.
There are several statistics to choose from that you can monitor.
Alternatively, you can use the terminal option to remotely access the terminal prompt of your Raspberry Pi to carry out remote admin and monitoring tasks.
PiCockpit is easy to use and extremely versatile. It is more than just a system health monitoring tool and is easily recommendable as an all-in-one solution for remote control and health monitoring for your Raspberry Pi.
Whenever you’re ready, here are other ways I can help you:
Test Your Raspberry Pi Level (Free): Not sure why everything takes so long on your Raspberry Pi? Take this free 3-minute assessment and see what’s causing the problems.
The RaspberryTips Community: Need help or want to discuss your Raspberry Pi projects with others who actually get it? Join the RaspberryTips Community and get access to private forums, exclusive lessons, and direct help (try it for just $1).
Master your Raspberry Pi in 30 days: If you are looking for the best tips to become an expert on Raspberry Pi, this book is for you. Learn useful Linux skills and practice multiple projects with step-by-step guides.
Master Python on Raspberry Pi: Create, understand, and improve any Python script for your Raspberry Pi. Learn the essentials step-by-step without losing time understanding useless concepts.
You can also find all my recommendations for tools and hardware on this page.
Check this: Pi5 vs. Pi4: I tested them, here's the result