Turning raw data into something people actually understand isn’t always easy. A bunch of numbers on their own don’t say much—but put them into the right chart, and suddenly the story becomes clear. That’s where Chart.js comes in.
This guide isn’t just about drawing charts for the sake of it. It’s about using visuals to make data easier to read, easier to explore, and easier to act on. Whether you’re working with trends, comparisons, or real-time updates, good charts help your data do the talking.
You’ll find practical Chart.js examples covering everything from simple line and bar charts to more polished, interactive visuals. By the end, you’ll have a solid feel for how to turn plain datasets into charts that look good, work smoothly, and actually help users understand what’s going on.
Table of Contents
70+ Best Chart.js Examples
If you’ve ever wondered how to make your data actually readable—and even a little fun—this is the place to start. We’ve gathered 70+ of the best Chart.js examples to show you how numbers can be turned into clear, engaging visuals. Simple line and bar charts and interactive, real-time graphs, these examples cover everything you need to get inspired and see what’s possible with Chart.js.
PoC Live updating Chart.js

Custom Chart.js Gradient

This Chart.js example shows how to use and implement a custom gradient with Chart.js. It also uses a padding trick to avoid collapsing of the graph’s height during the page load.
Chart.js-plugin-annotation sandbox

This example is great for drawing a box using the Chart.js annotation library.
Chart.js – Blend mode – multiply
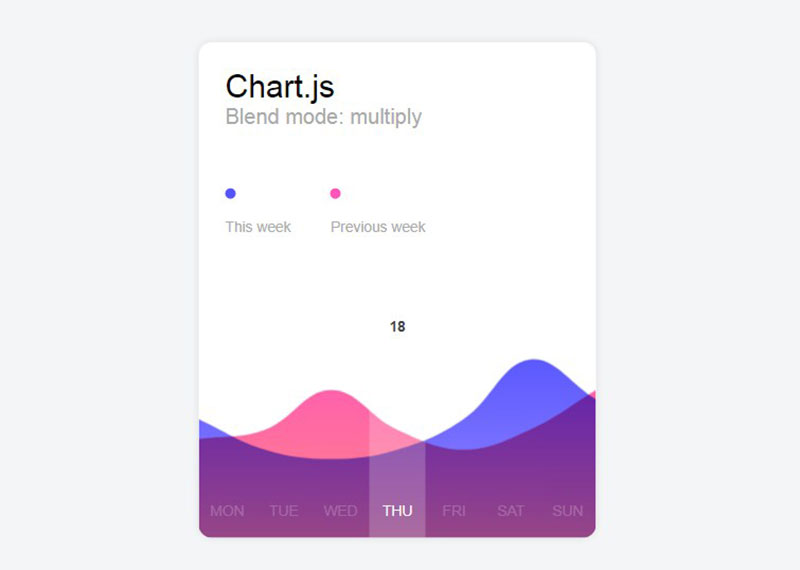
This is the canvas blend mode multiply applied on Chart.js chart with gradient.
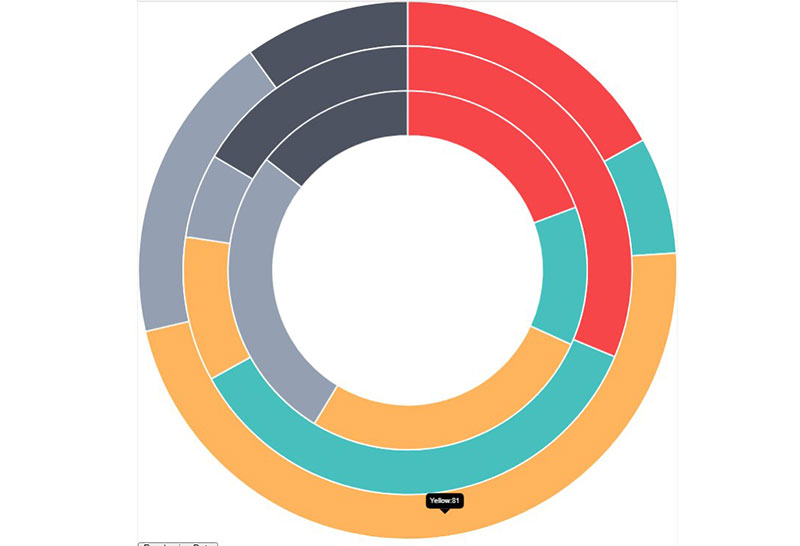
SVG Doughnut chart with animation and tooltip
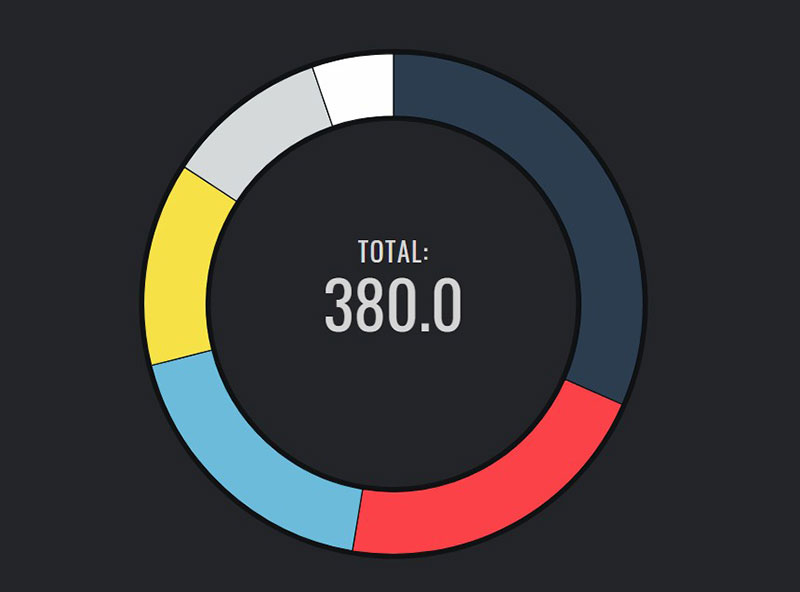
This is a lightweight jQuery plugin specialized in drawing doughnut charts.
Chart.js sample

This is a Chart.js sample displaying beautiful graphics while also being simple and easy to use.
Remove Tooltip and Legend Chart.js
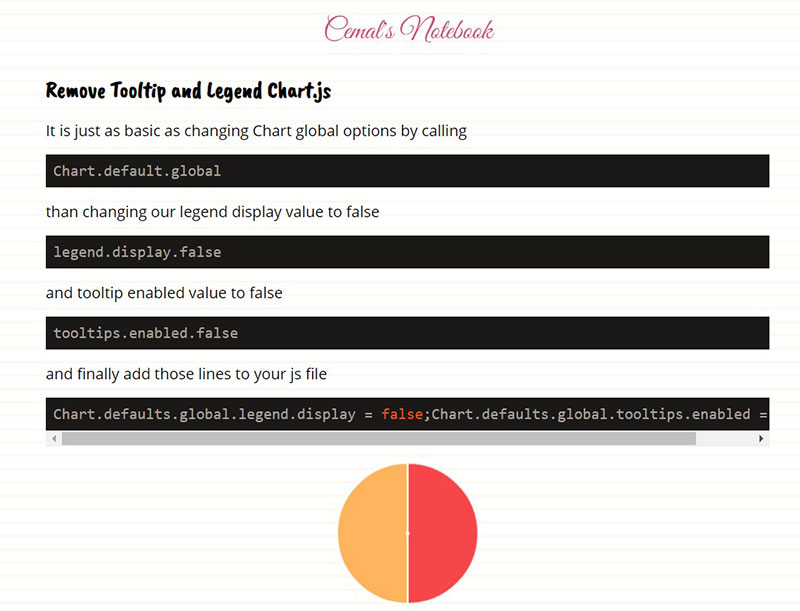
This allows removing the tooltip and legend in Chart.js with global options.
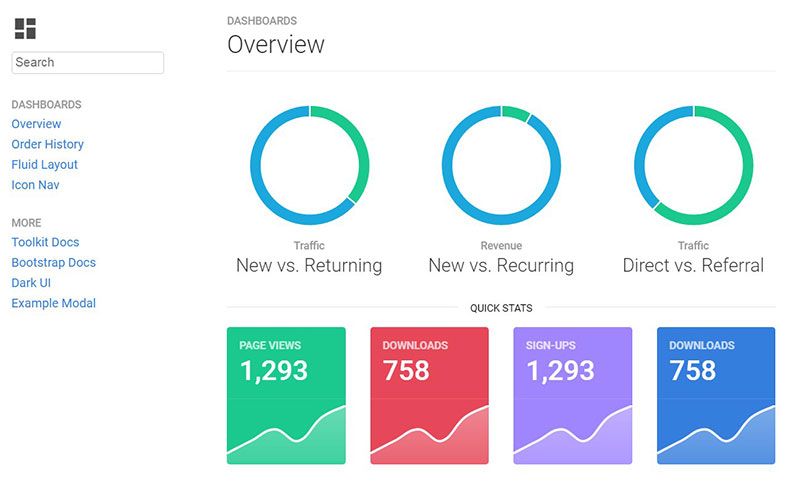
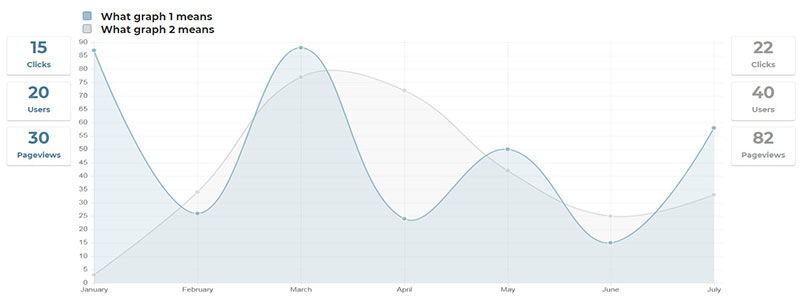
Medium – A Beautiful, Responsive Dashboard
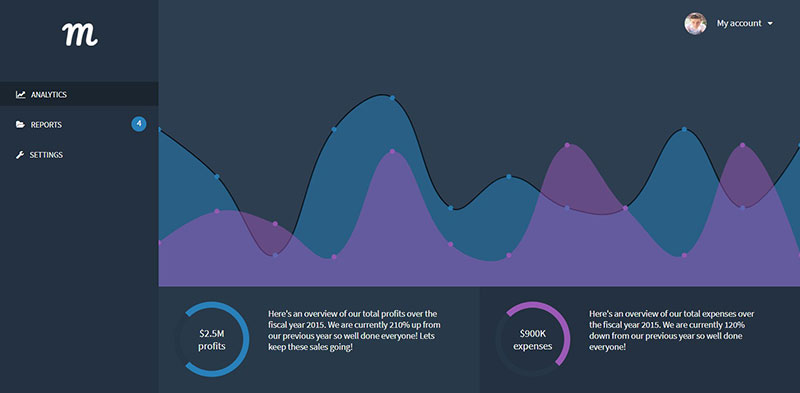
Chart.js – Temperature line chart

This Chart.js line chart contains transparent points and custom labels.
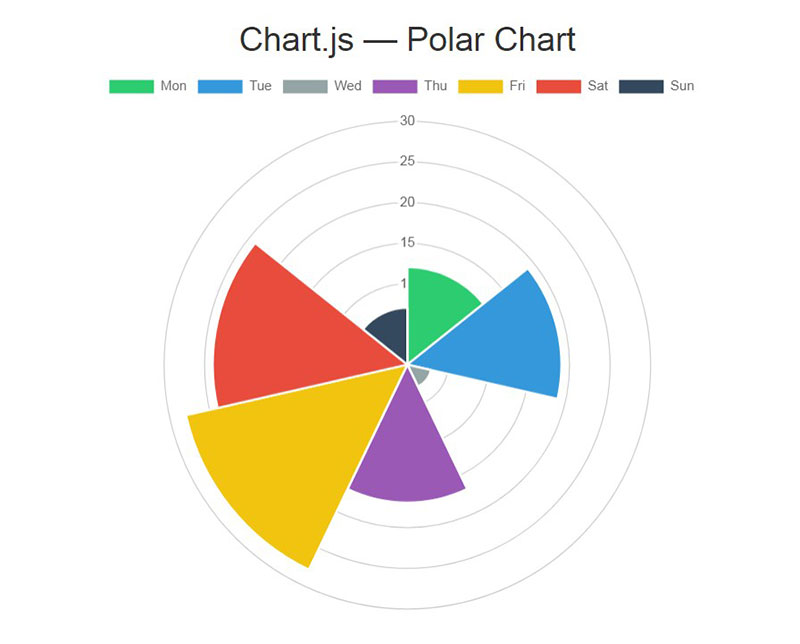
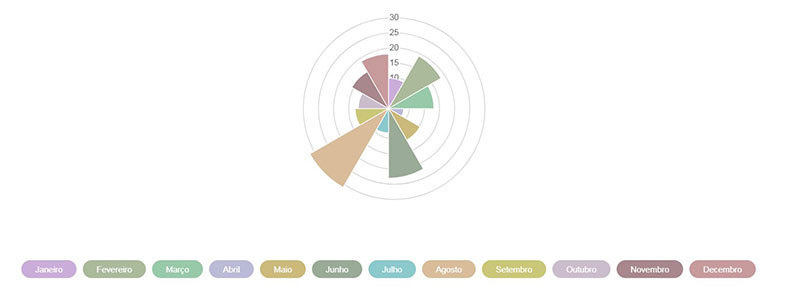
Chart.js Polar Chart
Sales Report – Dark Version
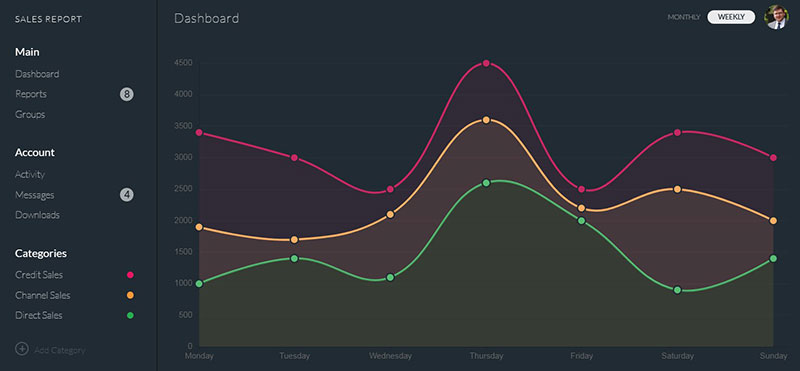
The plugins used can be found in progressbar.js/chart.js
Chart.js – Dynamically Update Chart Via Ajax Requests
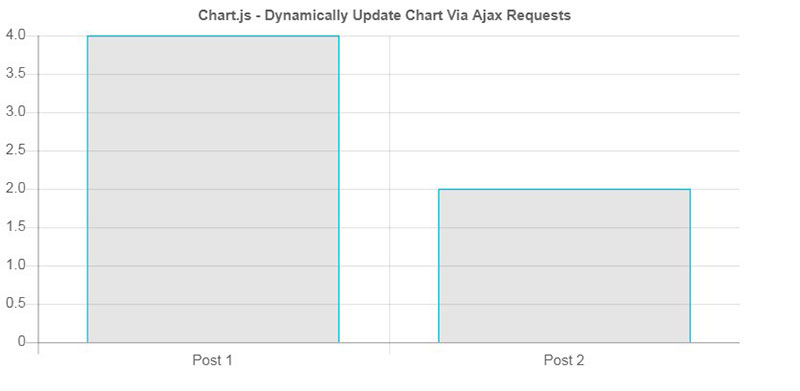
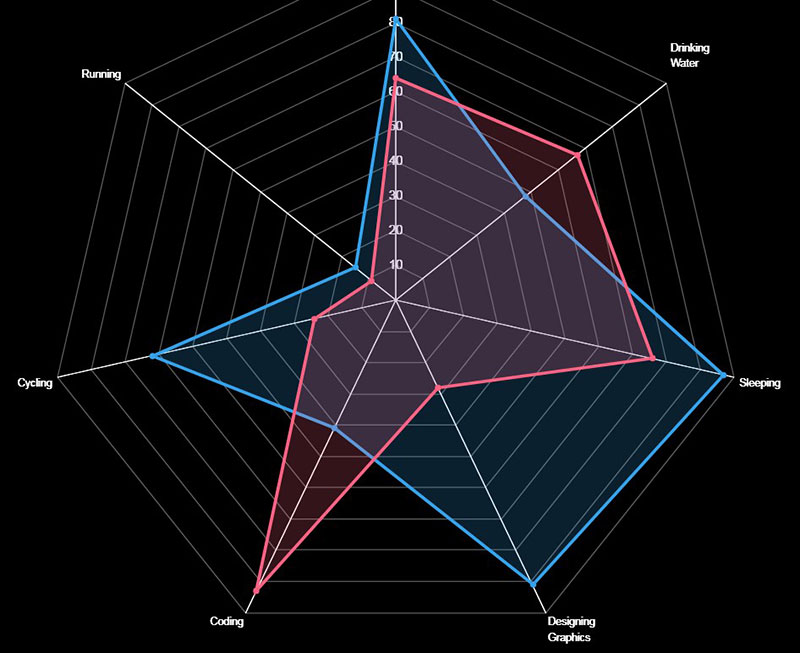
Chart.js – Radar chart, shadows, custom hover
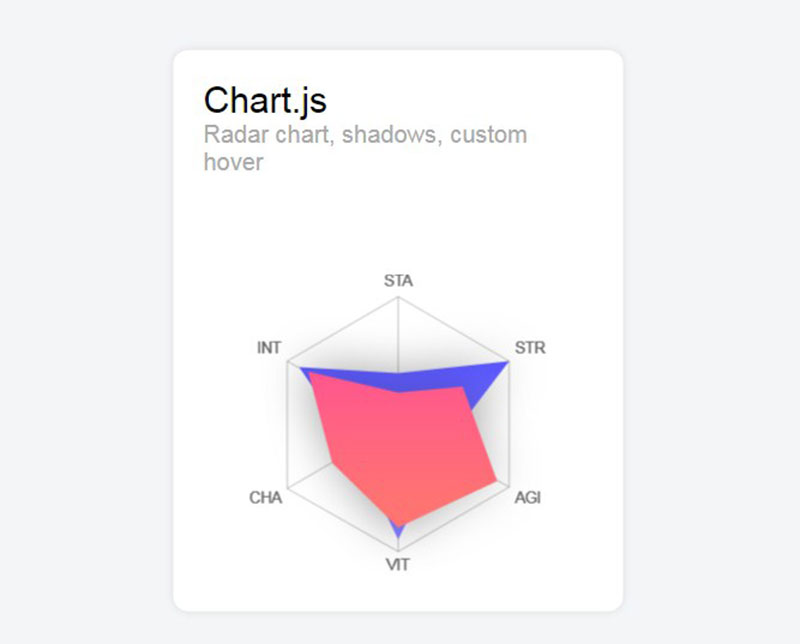
This Chart.js radar includes shadows and a custom hover effect.
Chart.js 1.x Example
Line Chart Example
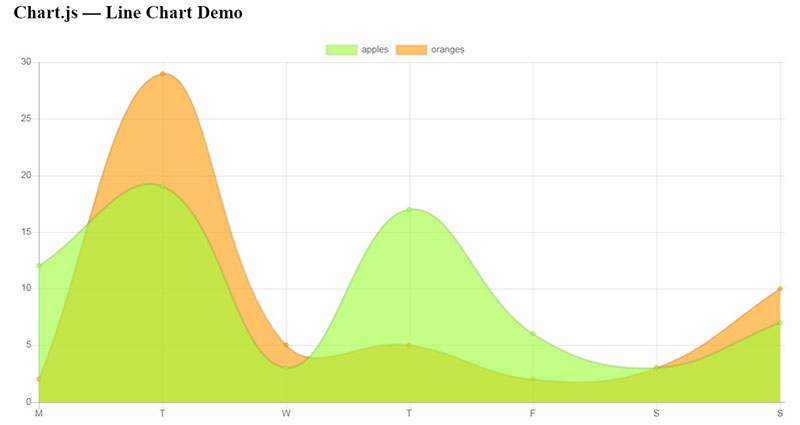
This is all you need to create a minimum line chart in Chart.js. Simply insert it into a <script></script> somewhere in your <body> after you declare the HTML5 <canvas>.
All Chart.js examples follow the above format, for the most part, requiring you to only learn it once.
SVG Pie chart with tooltip and hover effects
Chart.js – Polar Area Chart + custom legends + random colors
Stacked Horizontal Charts with Chart.js
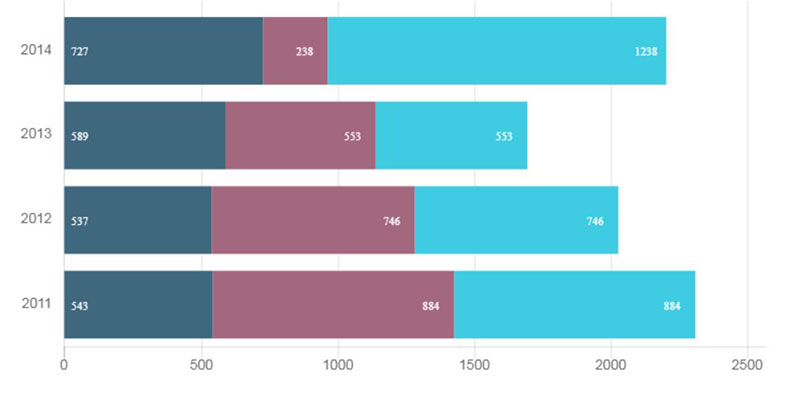
This shows how to make horizontally stacked charts.
Chart.js Grouped Bar Chart
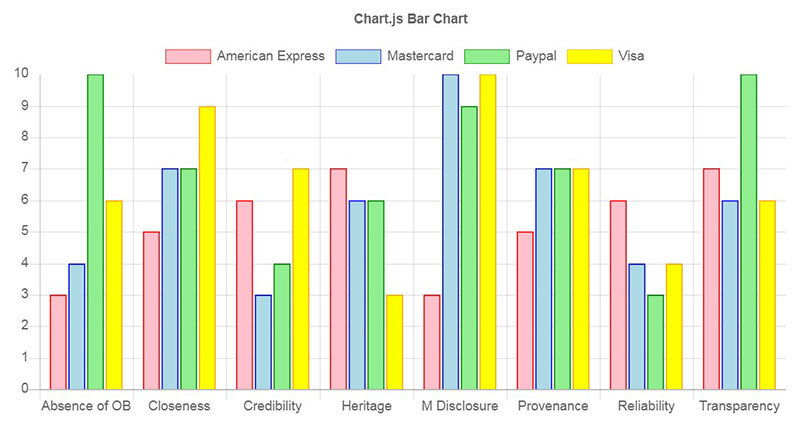
Chart.js Doughnut Custom Tooltip

Vue Dashboard Template
This was made with Vue, Tachyons, and Chart.js.
A Chart.js donut example
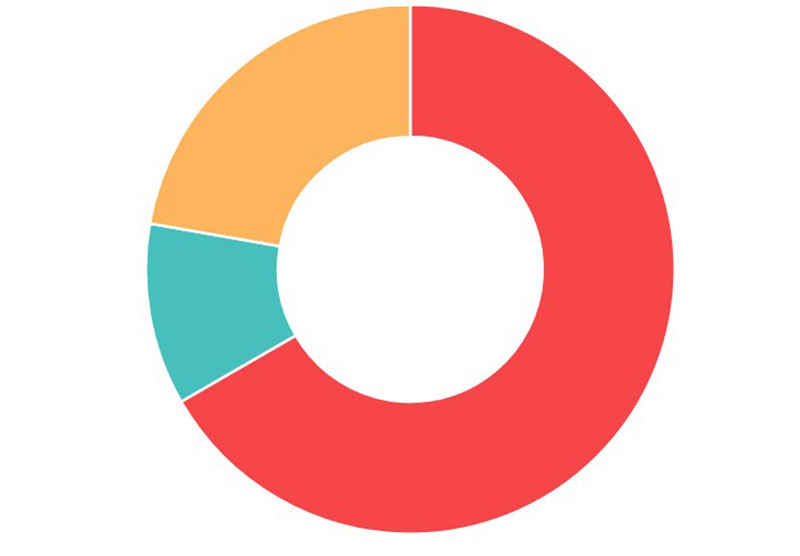
Chart.js – Line Chart Tooltip Hover Mode

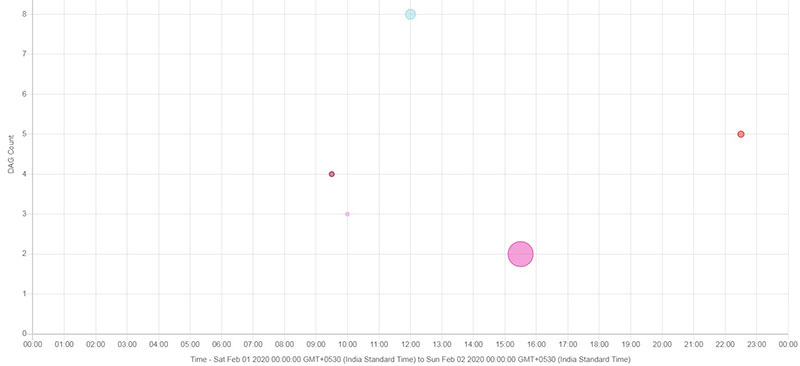
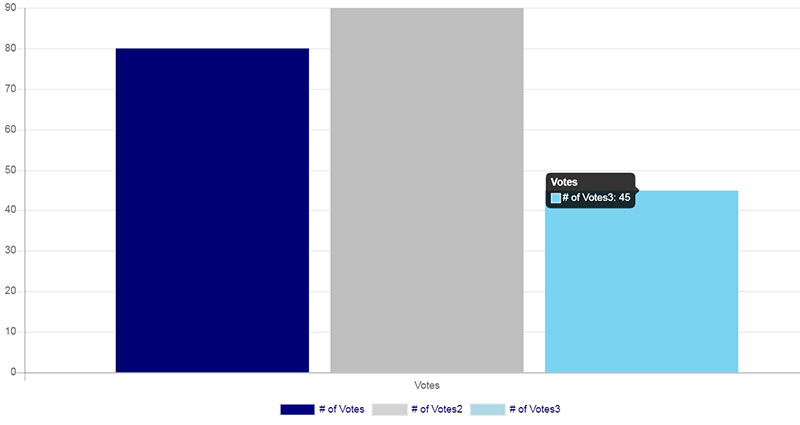
Chart.js Responsive Dashboard Widget
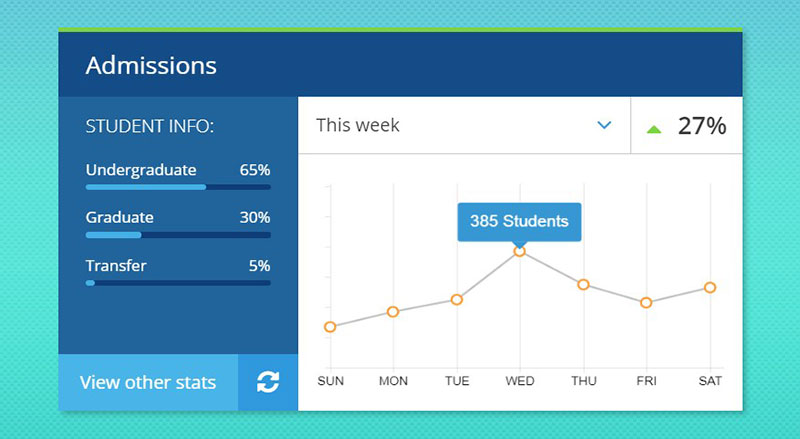
This is a seemingly simple chart, highlighting a single data point presented as a unique challenge. Chart.js provides a tooltip function, but by default, there is no direct control for a targeted selection. Tooltips are either all on or all off. To resolve this issue and highlight individually, onAnimationComplete is used for a function using an if statement to select a point at a specified label.
Chart.js into PNG using phantomjs/casperjs
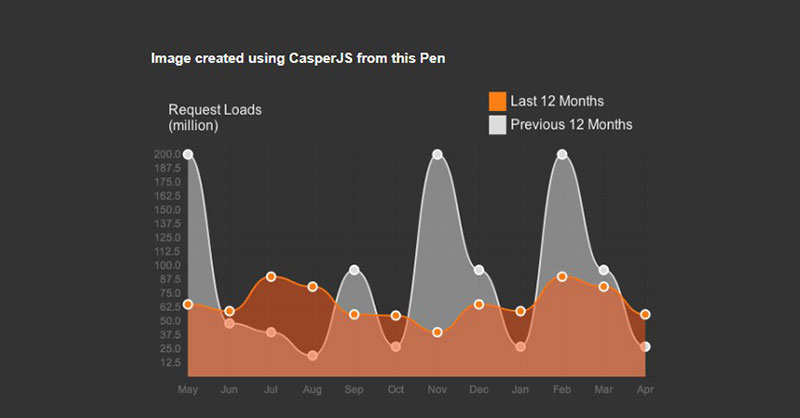
Here’s a prototype built to turn a chart into a PNG using phantomjs/casperjs inserted into monthly client reports sent out through interactive emails.
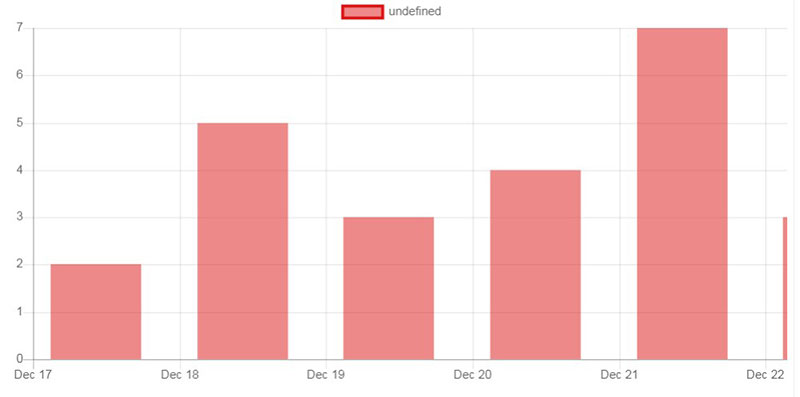
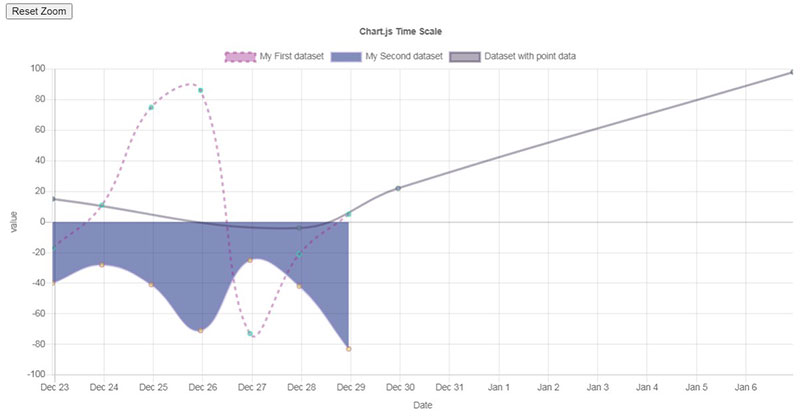
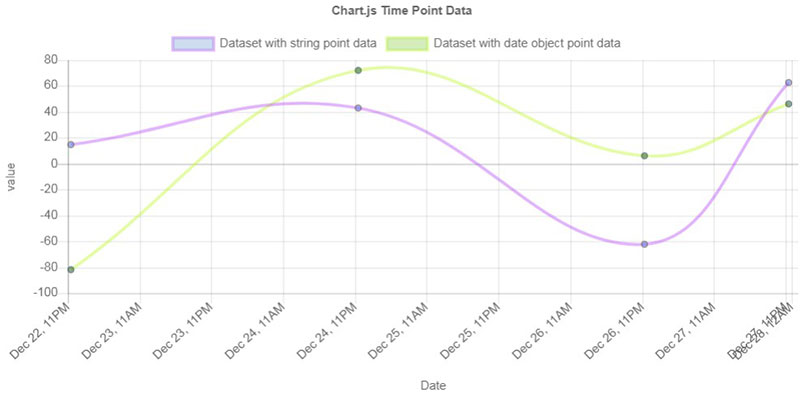
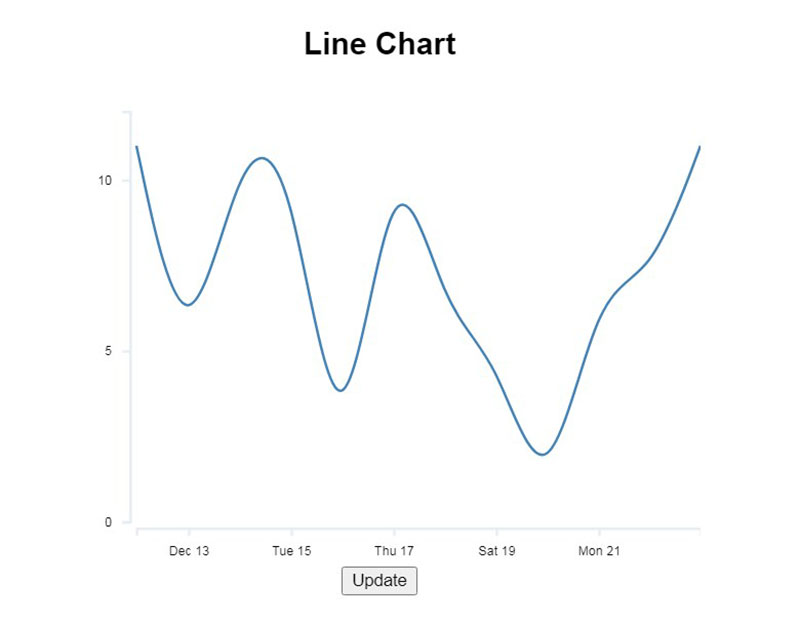
Chart.js – Bar with Time scale
Bubble Chart
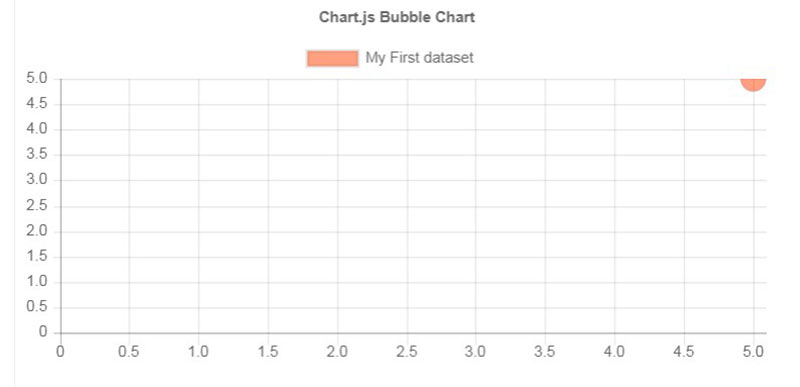
Simple Chart.js Example
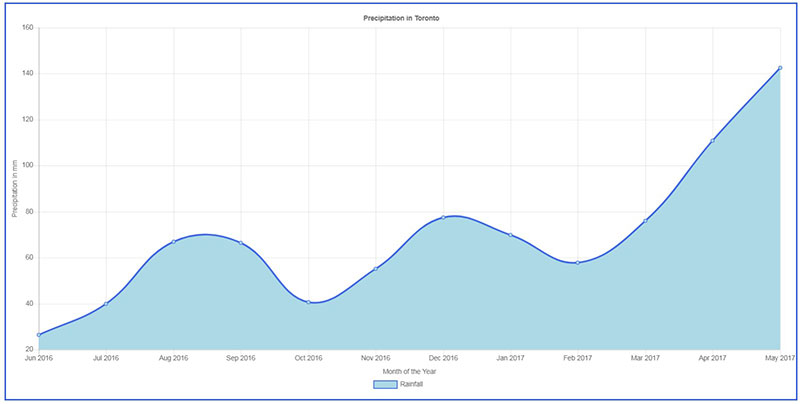
Chart.js – Smooth doughnut
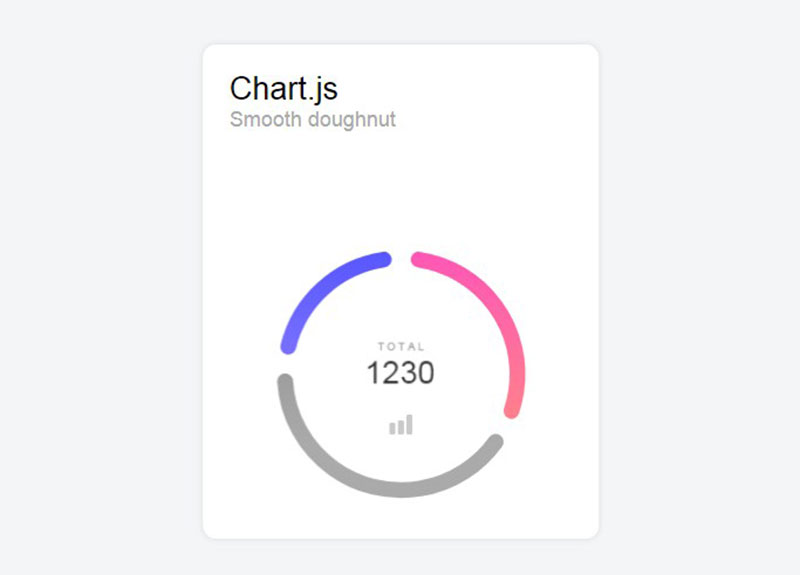
These are smooth line caps applied on a Chart.js doughnut chart.
Chart.js in bootstrap modal
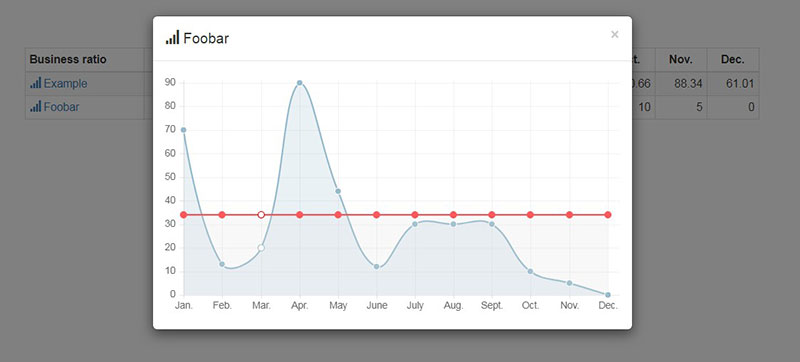
Load a line chart from Chart.js into a bootstrap modal. The chart data came from the links attributed.
Chart.js Polar Area Chart
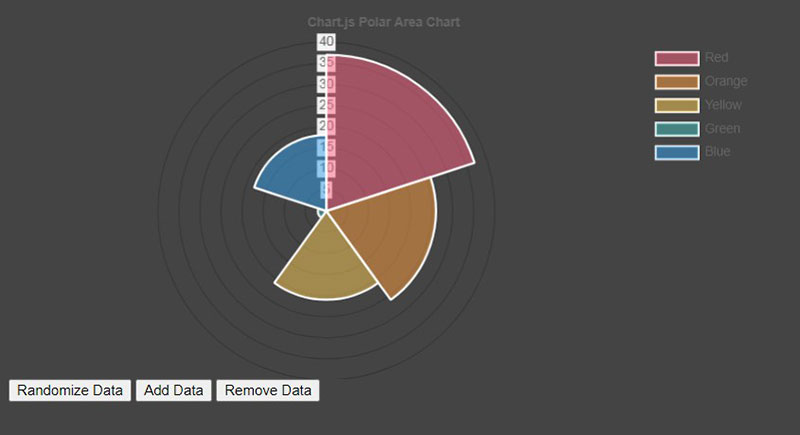
Chart.js Rounded Bars
This Rounded Bar Chart corners extension code for Chart.js.
Chart.js zoom and pan
This is a Zoom and pan using chartjs-plugin-zoom.
Skill Chart
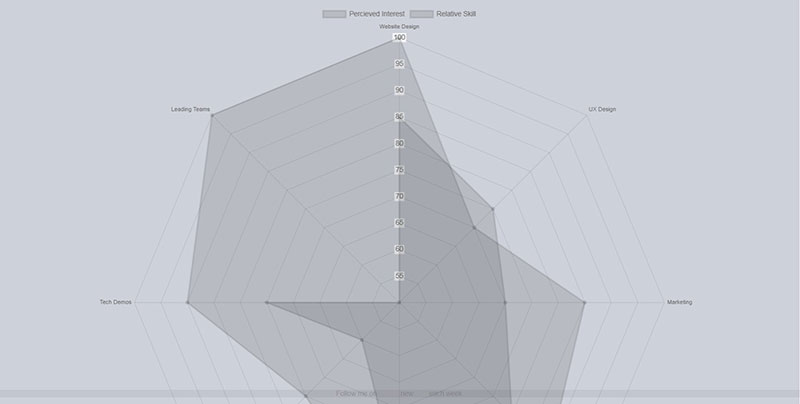
This is a chart for your portfolio using Chart.js.
SFW Wine stats
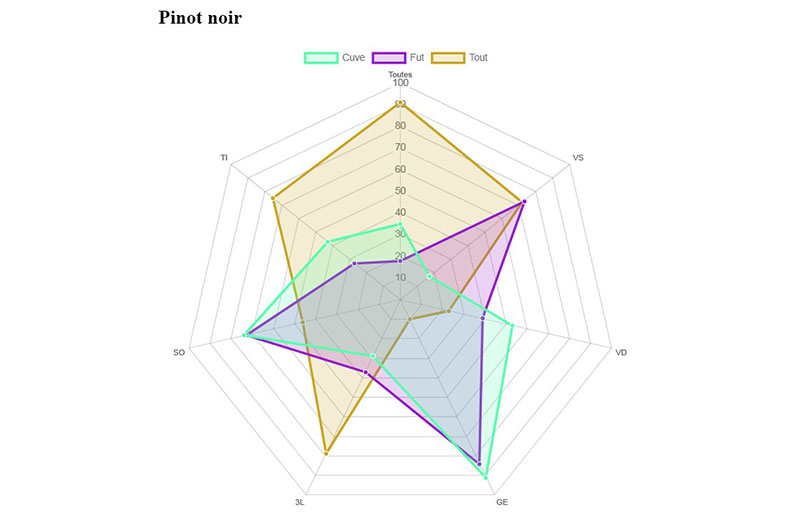
Chart.js Gradients
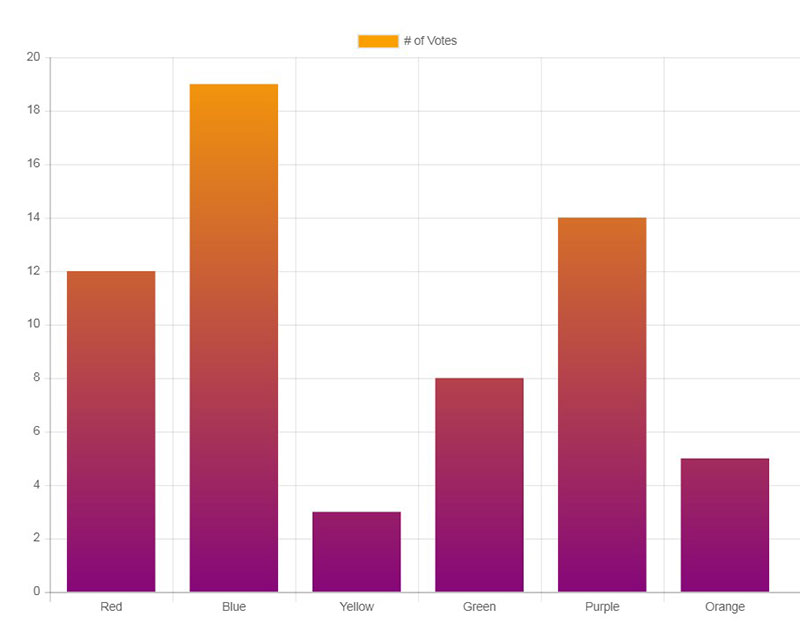
Chart.js Sparklines
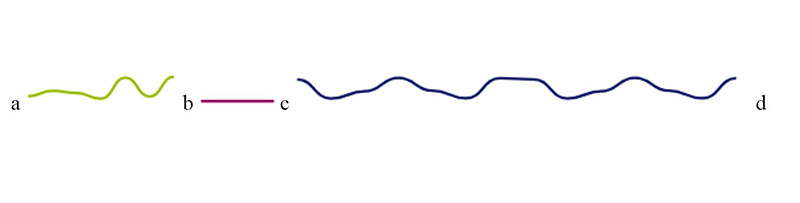
Use Chart.js with Zepto to produce Sparklines. Sparklines can be used inline to represent a quick trend.
Donut Chart – JS Raphael (Responsive)
Donut Chart – JS Raphael with Responsive Layout
Experiments with Chart.js
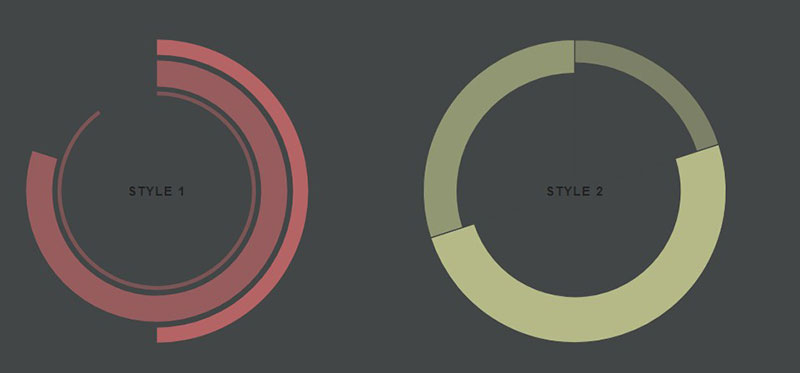
Chart.js Polar Chart
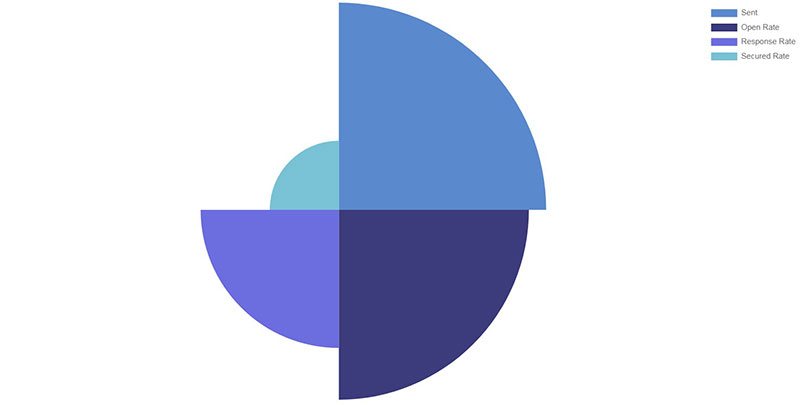
Chart.js Radar Chart example
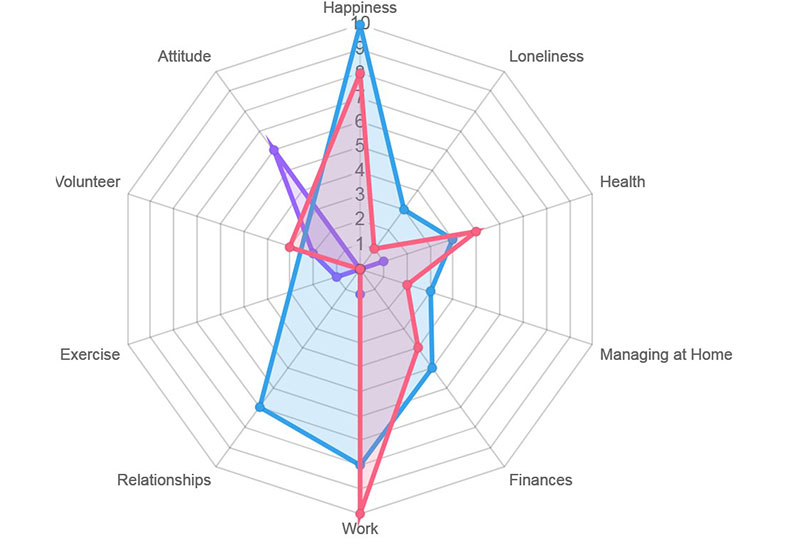
This is a demo for an outcome graph with examples of expected data using Chart.js.
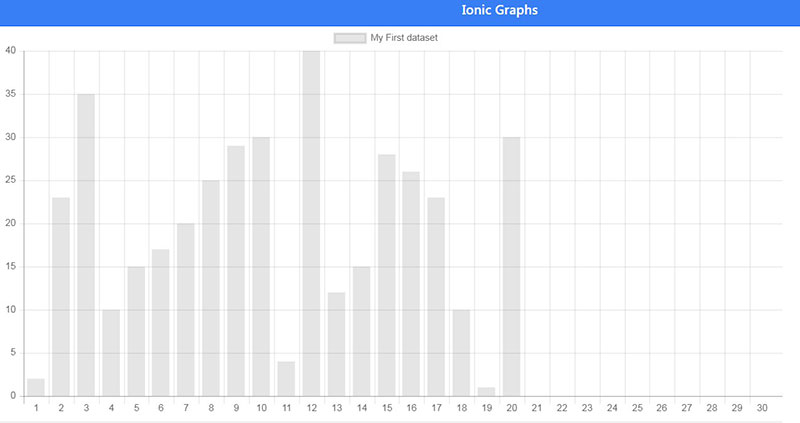
Ionic angular-chart example
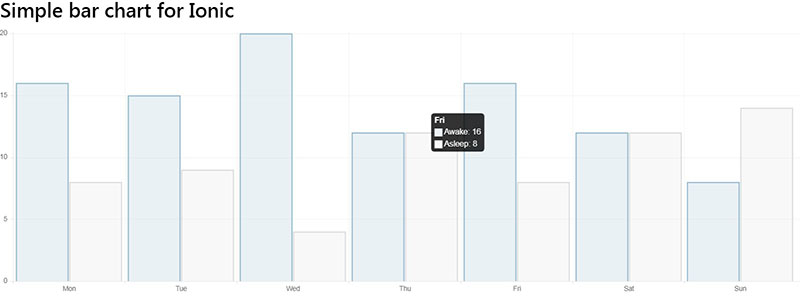
Here, a basic angular Chart.js example for Ionic apps is shown.
Bootstrap Admin Page Example
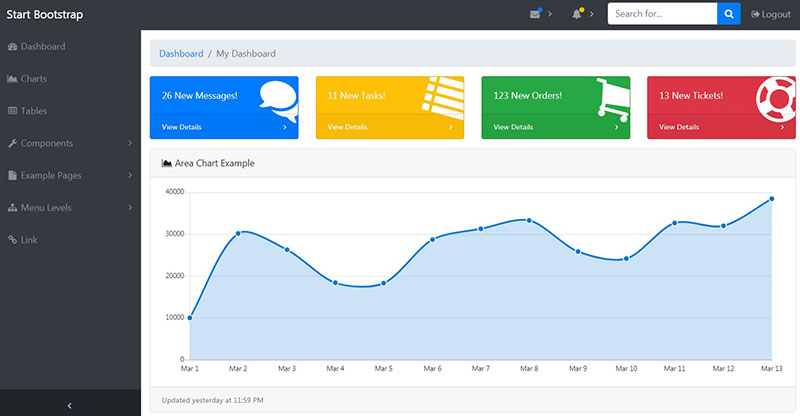
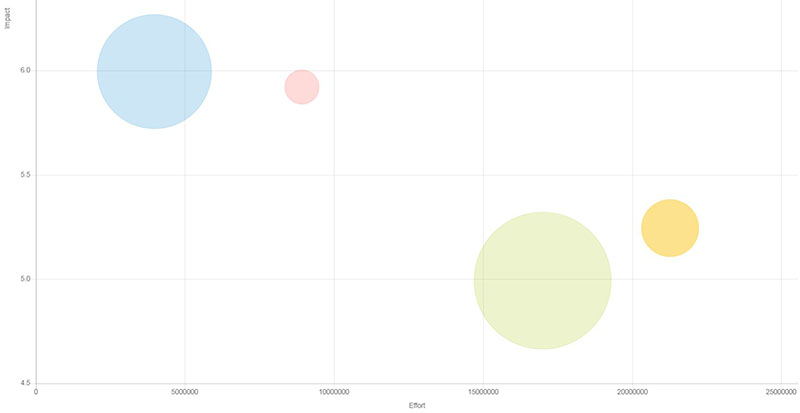
Chart.js Bubble Chart
Charting with Bootstrap, Chart.js
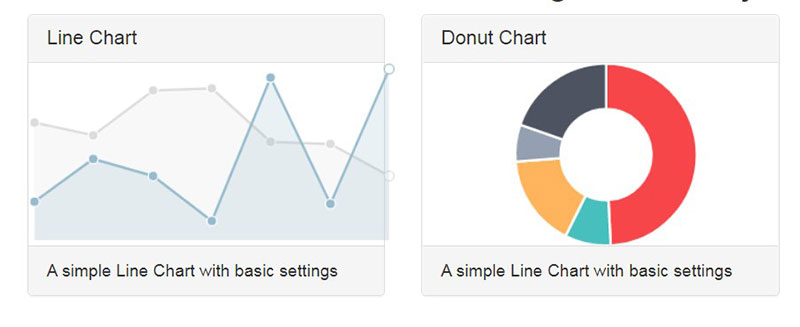
Chart.js Test
This is a simple test for Chart.js.
angular-chart.js line chart demo

Chart.js – change chart type and randomize data
This was created to showcase the dropdown option to change your Chart.js chart (hint: you need to destroy the chart first!). Also, a fun function to randomize data points on button click was added, which utilizes the awesome build-in animation.
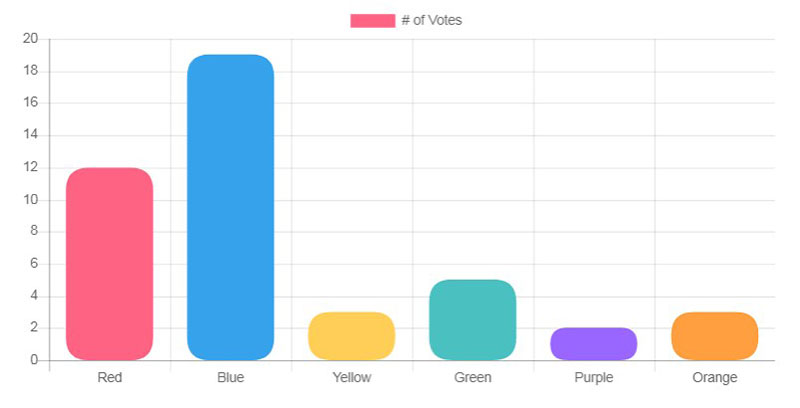
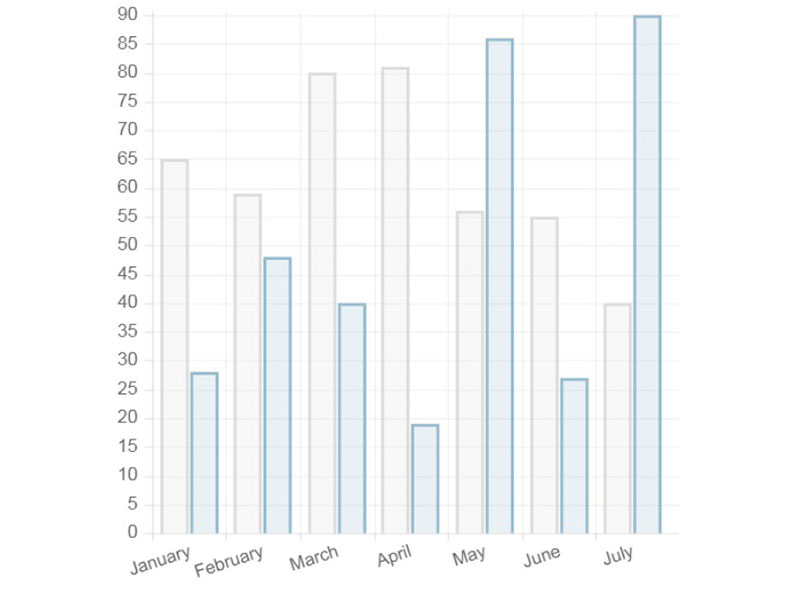
Chart.js Bar chart example
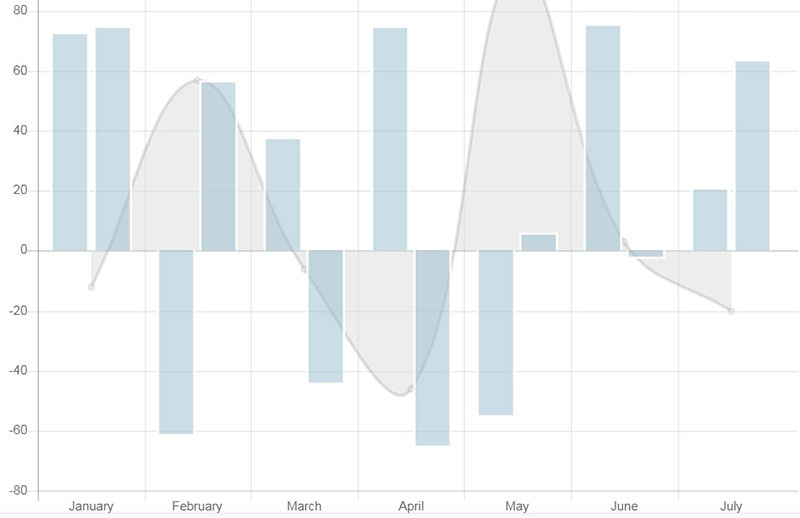
Chart.js Hide Other Datasets on Legend Click – Logic Option 1
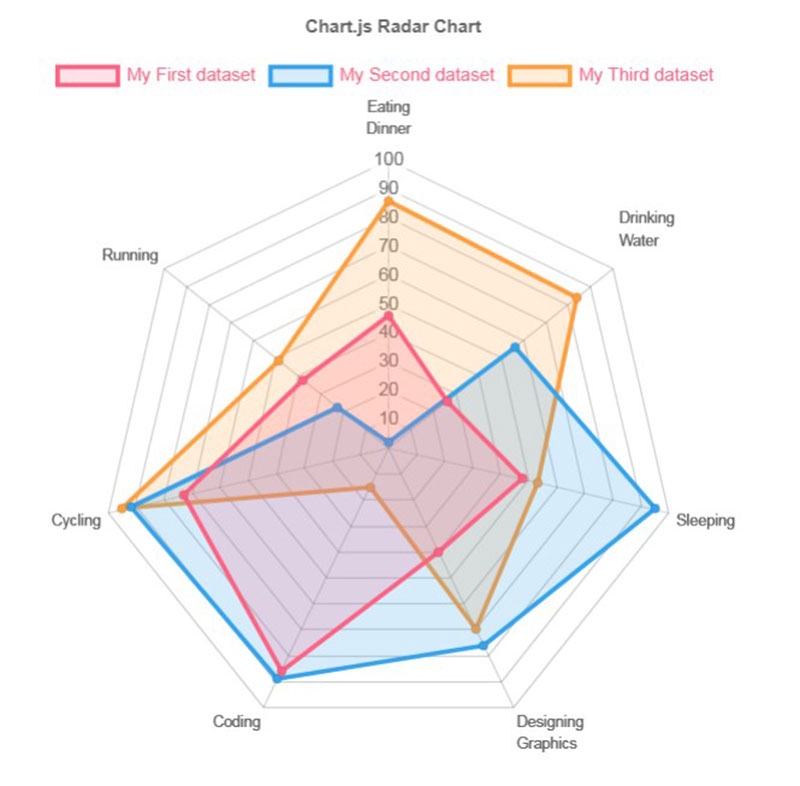
Chart.js Bubble Graph
The Chart.js ionic scroll horizontal
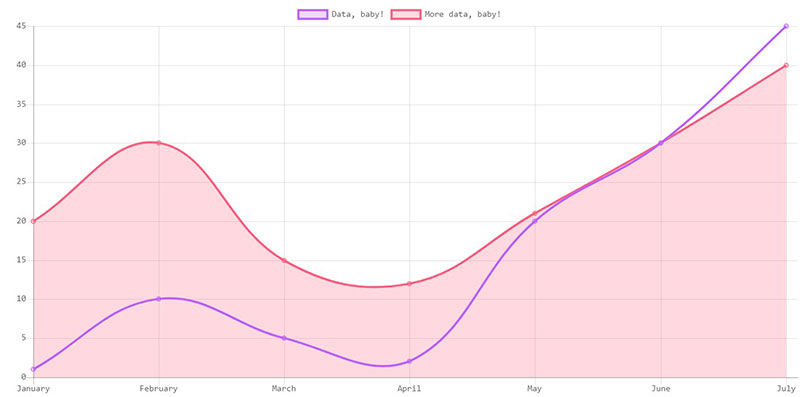
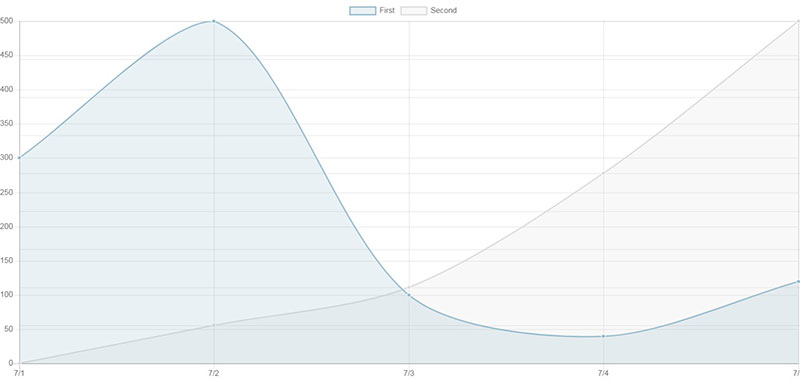
Proof of concept: Chart.js with Background Gradient
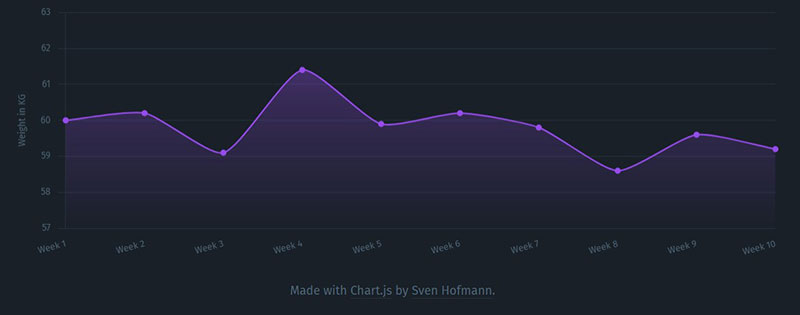
This is a line chart that visualizes weight over time. The line chart has a background gradient to indicate the top values.
Chart.js Line Chart w/ Opacity

Chart.js Bar Chart Example
Vue.js & Chart.js
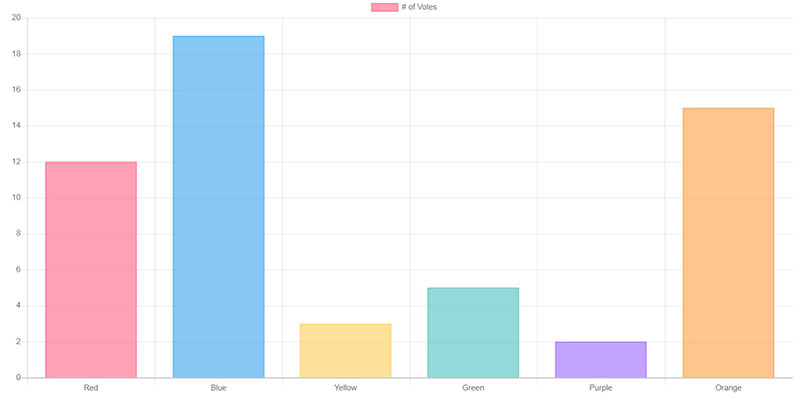
Chart.js scale options
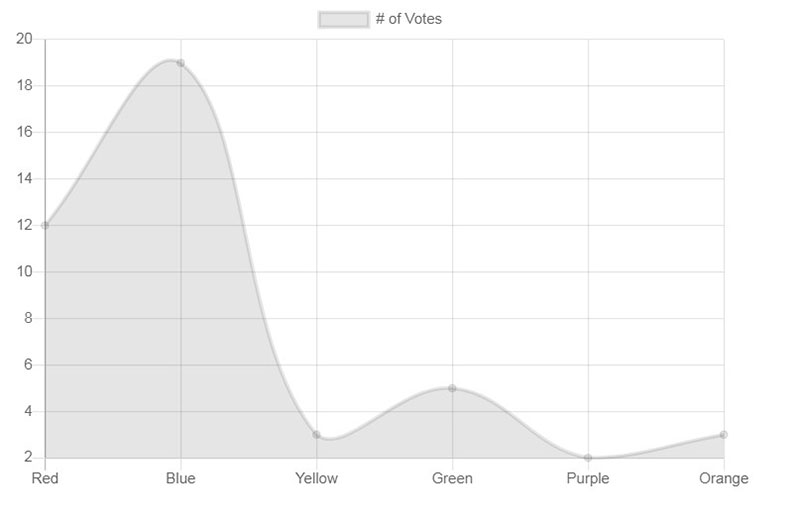
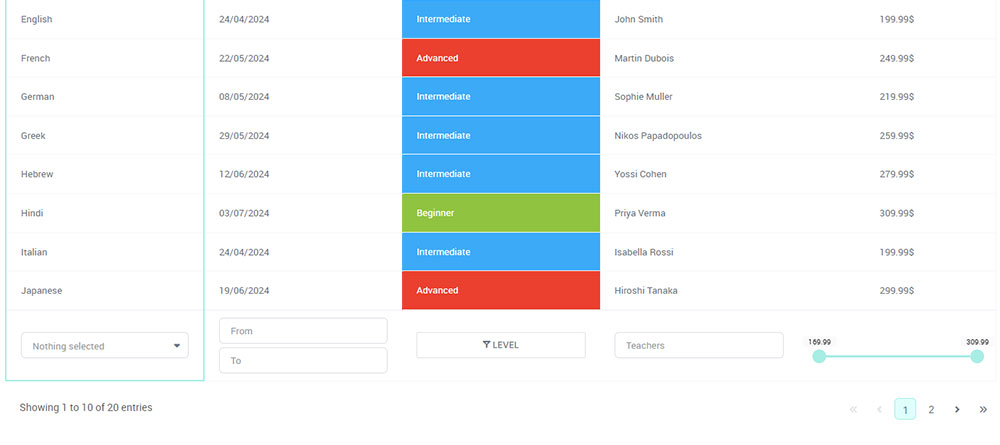
Chart.js Email Marketing Design Layout
This is a basic responsive design layout using Chart.js. It calls in the default color scheme for chart.js elements while adding some buttons and data inputs (design only) that would be useful in an Email Marketing system.
Chart.js Draggable Radar Points

This Chart.js Plugin gives the ability to drag radar points up and down. Add some fine-tuning for a smoother run.
iOS Health App Rapid Prototype
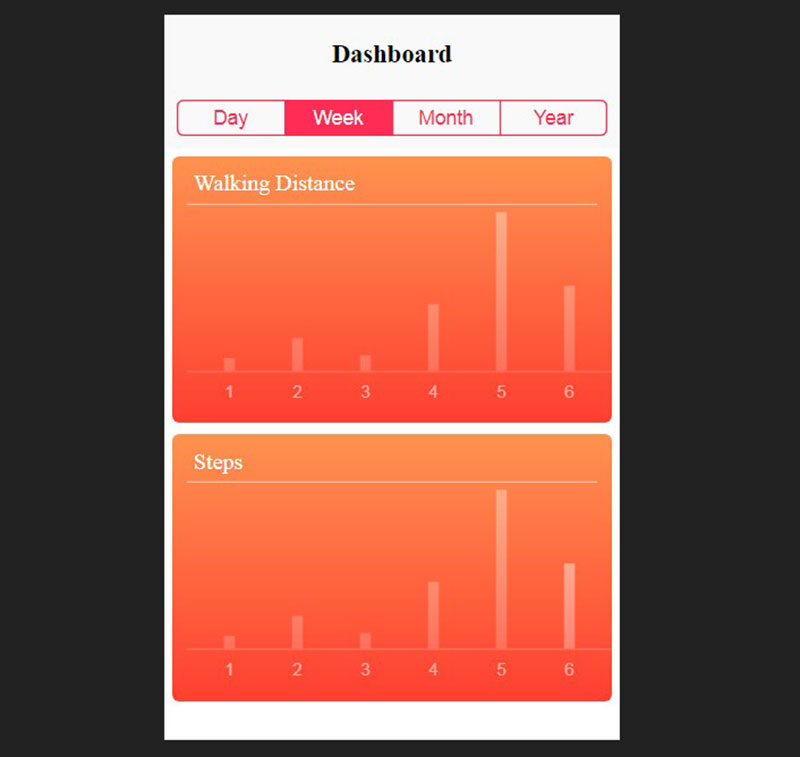
Rapidly prototype the Apple Health iOS app using Chart.js + Dragula. Drag and drop and click the segmented controls to watch the data refresh.
Chart.js Stacked Column Chart
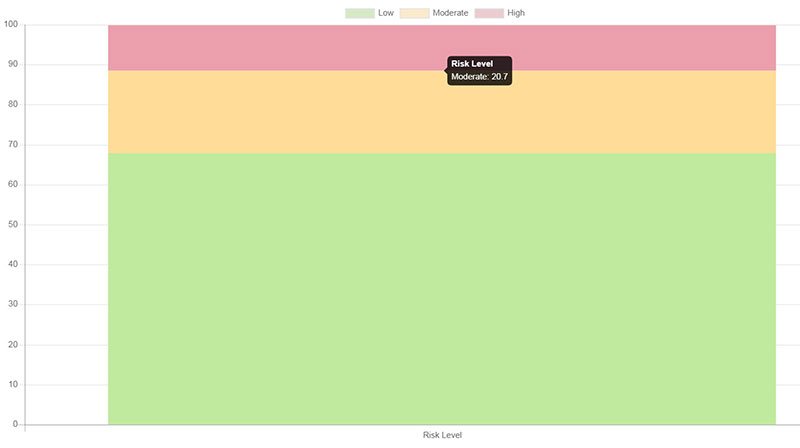
Chart.js – Radar Chart Only Show Last Scale Line

Angular Chart.js
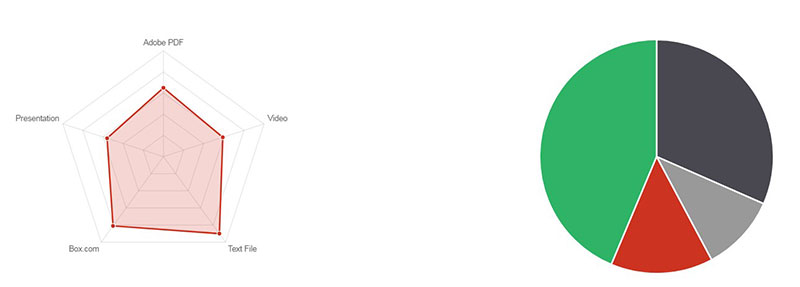
Chart.bundle.js RequireJS
Toggle-able Charts in Angular/Chart.js
Gauge Chart
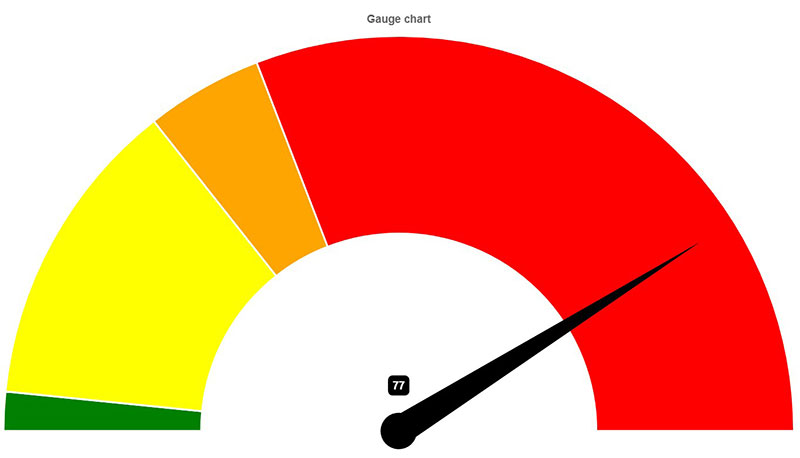
This is a simple gauge chart for Chart.js.
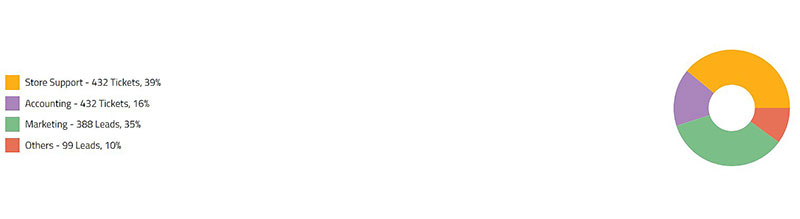
Chart.js Doughnut Center Percentage

An example using Chart.js custom tooltips to generate a percentage label in the center of the doughnut when a user mouses over a section can be found here.
Delivery Tracker UI
![]()
![]()
I used Chart.js to create the line chart and it was a good project to test BEM.
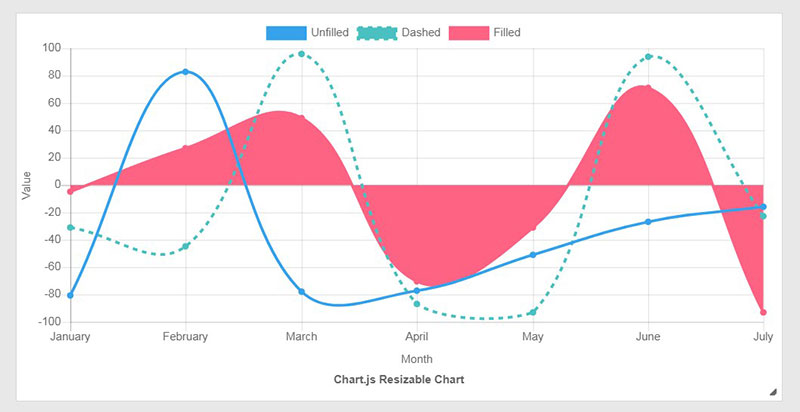
Chart.js update type of chart + resizable
D3 Line Chart
This is an animated SVG line chart made with d3.js.
Chart.js Line Graph Example
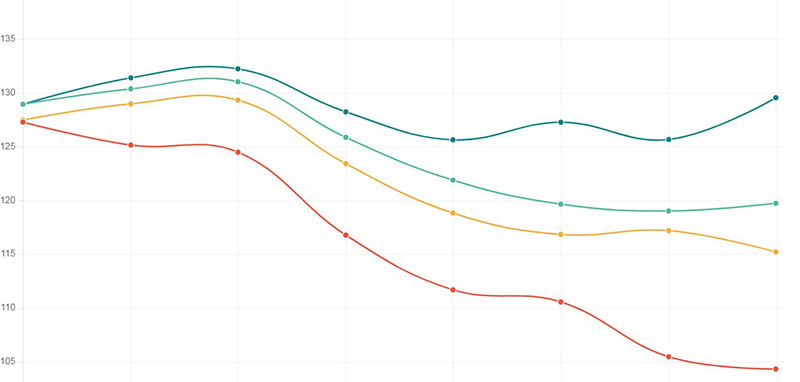
Chart.js Gridlines for Dark Theme
Rotate a Doughnut Chart (Chart.js)
This is a quick pen to illustrate a new property that can be used to rotate a doughnut chart. This example is specific to the Chart.js library.
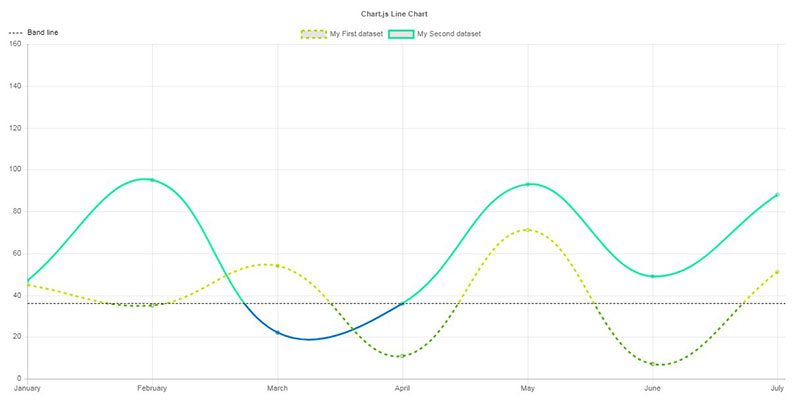
Chart.Bands.js
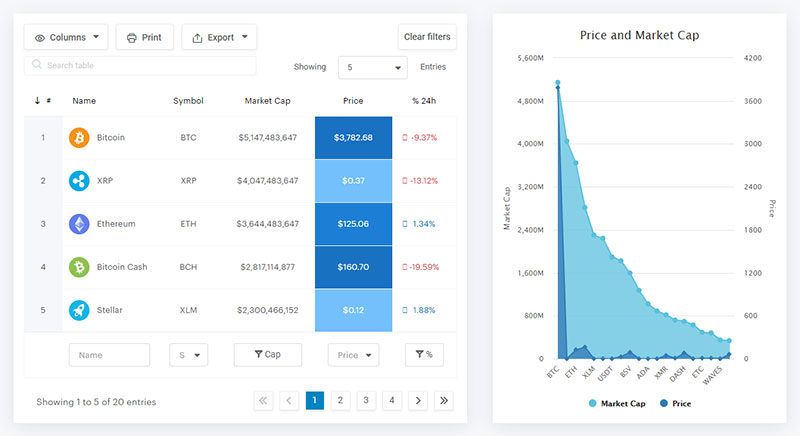
Create Stunning Charts on WordPress with wpDataTables and Chart.js
Turning data into charts that actually make sense doesn’t have to be complicated. With wpDataTables, you can take your spreadsheets, databases, or CSV files and quickly transform them into professional-looking charts that are interactive, responsive, and easy to read.
One of the best things about wpDataTables is its integration with the Chart.js library. Chart.js is a lightweight JavaScript library that makes creating line charts, bar charts, pie charts, and more a breeze. With wpDataTables, you don’t need to write any code to bring these charts to life. Everything happens inside WordPress, in a simple drag-and-drop interface.
Here’s what you can do with wpDataTables + Chart.js:
- Create interactive charts: Let visitors hover over points, click through legends, and explore your data dynamically.
- Choose from multiple chart types: Line, bar, pie, doughnut, radar, polar area, and more.
- Real-time updates: Connect your charts to a database so any change in your data automatically updates the charts on your site.
- Customizable design: Change colors, fonts, and styles to match your website’s branding.
- Responsive charts: All charts look great on desktop, tablet, or mobile without any extra effort.
Using Chart.js through wpDataTables means you get the power of a professional JavaScript library without the technical headache. Whether you want to show sales trends, user analytics, pricing comparisons, or survey results, wpDataTables makes it easy to turn raw numbers into charts that your audience can actually understand and enjoy.
If you’re running a WordPress site and want to make your data more engaging, this is one of the easiest, most flexible ways to do it. You just pick your data, choose a chart type, customize the look, and let wpDataTables and Chart.js to handle the rest.
Coupled with the right web hosting, wpDataTables can turn your WordPress site into a powerful data visualization tool.
Each WordPress table can be used as a data source for creating WordPress charts. Charts are rendered by 3 powerful engines and can change in real-time: Google Charts, HighCharts, and Chart.js. Check out this easy-to-follow documentation page where we present how to create a chart in WordPress with our user-friendly plugin.
More about Chart.js

Chart.js is similar to Google Charts or Chartist, by providing an extensive script library for JavaScript data visualization.
It is available on GitHub, so it is an open-source, community-maintained library.
Scripts in the Chart.js library are available for JavaScript use. Once copied, the scripts can then be nested within the < canvas > HTML element.
There are also options for using the charts in frontend frameworks such as React, Vue, and Angular.
All charts in the library are responsive, meaning they can be displayed in different-sized windows. They scale perfectly on small mobile screens and larger device displays alike.
Along with responsiveness, the charts offer good rendering performance across all modern browsers. This means no matter how a viewer displays your charts, they will be quickly available and clearly visible.
Available Chart.js examples include:
- Bar Charts – Options include Vertical, Horizontal, Multi-Axis, Stacked, and Stacked-Groups.
- Line Charts – Options include Basic, Multi-Axis, Stepped, and Interpolation. Also comes with options for different line styles, point styles, and point sizes for complete customization.
- Radar Charts
- Pie Charts
- Doughnut Charts
- Bubble Charts
- Scatter Charts
- Area Charts
Charts of multiple types can be combined to produce an overlay of the information in different formats.
Various modifications to the chart style can also be found in the library including scale, legend, and tooltip options. This allows you to customize data visualization to suit the needs of the project and your personal preferences.
FAQ on Chart.js
How do you get started with Chart.js?
Alright, kick-off is simple. Nab the Chart.js library from the official site or a package manager. Link it up in your HTML. You then grab a canvas element, cook up some data in JavaScript, stir in the options, and boom—your first chart springs to life.
Can Chart.js be used for real-time data?
Totally. Feed it a constant stream of data, update the dataset, and refresh the chart. That’s the trick. Whether it’s user engagement metrics or live trading charts, Chart.js keeps pace, making sure those lines and bars dance to the beat of now.
Are Chart.js charts responsive on mobile devices?
You bet they are. Flexibility is key, and Chart.js charts expand or contract like an accordion, fitting snugly into any screen size. Just remember to toggle that responsive option in your chart configuration. Mobile users will thank you for those clear, crisp visuals on their screens.
How can Chart.js be customized to match my branding?
Dive into the chart’s options. Customize colors, fonts, and legends. Got a specific hex color or a fancy Google Font in mind? Weave them into your chart’s style. With Chart.js, your data visualization can rock your brand’s look just as easily as a chameleon shifts its shades.
What types of charts does Chart.js support?
It’s like a whole candy store of varieties! Line, bar, radar, doughnut, pie, polar area, bubble, and scatter – Chart.js has a sweet chart type for every dataset. Pick your treat; each type transforms your data into a visual story that’s easy to digest.
How do you handle tooltips and animation in Chart.js?
Chart.js spoils you with options. Tooltips? Customize them for days—content, background, how they pop up. Animations? You’ve got control over duration, easing, and even on-complete functions. Tuning those settings will make your charts not just informative but slick and engaging to interact with.
Can you integrate Chart.js with a front-end framework like React or Vue?
Sure thing, integration’s a breeze. Boundless packages and wrappers out there exist to marry Chart.js to React, Vue, whatever your flavor. Wrapping it up within components keeps your frontend tidy, reactive, and oh-so-modern.
Is Chart.js compatible with server-side technologies like Node.js?
Absolutely. Server-side’s no stranger to Chart.js. You can generate your charts on the back end with Node.js, construct them as images if needed, and shoot them straight to the browser or emails. It’s a decent workaround when JavaScript’s not in the client-side picture.
How do you add interactivity to charts in Chart.js?
Sprinkle some event listeners on canvas, and you’ve got interactivity. Clicks, hovers, taps—you name it. Chart.js paves the way for functions that react to user actions. Make those charts not just pretty pictures but a playground for users to explore data points.
What debugging tools are available for Chart.js developers?
The browser’s dev tools are your best pals. Console.log() to echo values, inspect elements to poke around the canvas, breakpoints to capture events. And, the Chart.js community? It’s buzzing with wisdom on Stack Overflow, GitHub issues—real treasure troves for solving those pesky bugs.
Conclusion
Diving into Chart.js examples, we’ve seen data transform. It’s not just charts; it’s storytelling, where every dip and peak has a tale. We’ve witnessed:
- Line graphs cutting a path through sales trends.
- Pie charts dishing out market shares.
- Bar charts stacking up annual growth.
These aren’t dull stats. They’re jazzed-up digits in a data visualization concert. You’ve now got the real-time charting chops to riff off any dataset that comes your way.
And customization? It’s your brush. Paint your own brand right there on the canvas. Remember, responsiveness is king, because who doesn’t look at everything on their phone these days?
As our foray into Chart.js examples wraps, leave with this beat in your head: charting’s an art, and you’ve just jammed through a masterclass. You’ve got the tools, the code snippets, and the insight to make those numbers sing in tune with your user’s needs. Keep plotting that next big hit.
If you liked this article about Chart.js examples, you should check out this article about embedding a chart.
There are also similar articles discussing survey graph makers, survey chart types, survey tables, and creating a Google forms results graph.
And let’s not forget about articles on chart designs, types of charts, Highcharts alternatives, and WordPress charts.