Data tables might not get the spotlight, but they’re the unsung heroes of any website full of information. They take a jumble of numbers, text, and stats and turn it into something you can actually make sense of – quickly and without frustration.
In this guide, we’re going to look at a bunch of real examples showing how tables can make complex data simple. You’ll see how even the messiest spreadsheets can be transformed into something neat, readable, and useful for your visitors.
By the time you finish, you’ll know how to spot a good table—and how to create one that works for your site. You’ll see HTML tables doing the heavy lifting, pivot tables making sense of numbers, and responsive tables that look great on any screen.
Table of Contents
Common Uses of Data Tables
A data table has many functions, but it is commonly used to:
- Organize data to make it easier to read and pleasing to look at.
- Sort different types and amounts of information including fixed and dynamic data.
- Make comparisons, due to its chart-like layout. Often used for comparing products and services, and even pricing plans.
14 Great Examples of Data Tables on Websites
Adaptive Pricing Table
This data table has a clean and modern design. It is perfect for presenting pricing plans for subscriptions.
This CSS3 table is free and easy to use. It is also customizable.
Users can alter the text and color to enhance the overall appearance.
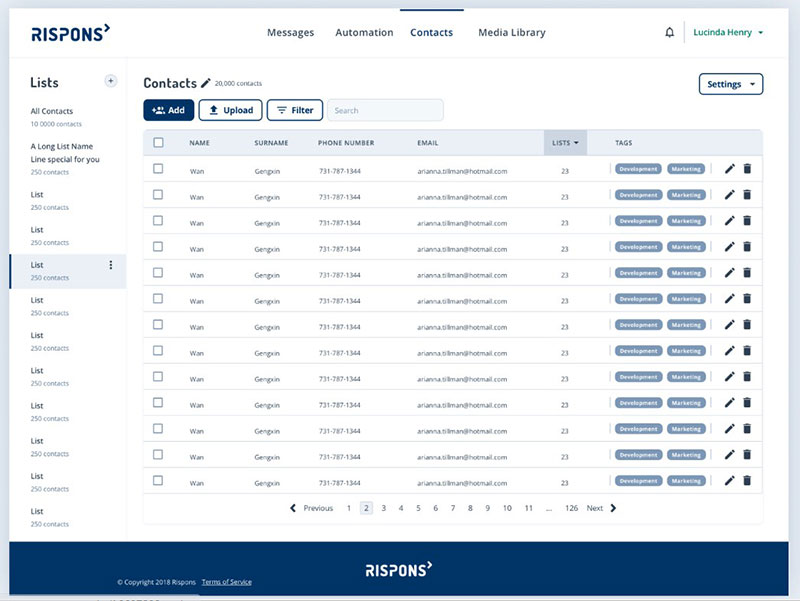
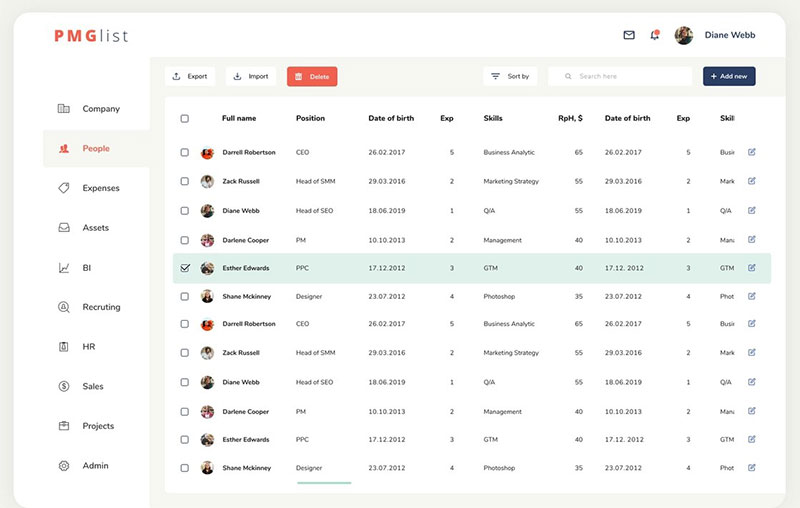
DataTables JSON sample using Material Design
This material data table is an ideal design for creating an office database. It contains pagination and search controls, and has an option to add more profiles.
The data table also enables users to arrange and sort data in ascending and descending order.
Fixed table header
This CSS data table by Nikhil Krishnan features a fixed header, borderless columns, and a vertical scrolling control.
The table has a clean outer border and an anchored header. This allows users to look at the variables while scrolling down the table.
Nutrition Facts Table in HTML and CSS
The next one of these data table examples shows a CSS data table presenting the nutrition facts of a food item. The appearance is similar to that of a product label.
Users can customize the data table according to the nutritional content of the food item. However, this could take some time to fill in.
Responsive Table
Designed by Geoff Yuen, this data table example has a modern design and a customizable color scheme.
The HTML table has expandable rows and columns. So data can fit in each table cell when the window is either compressed or stretched.
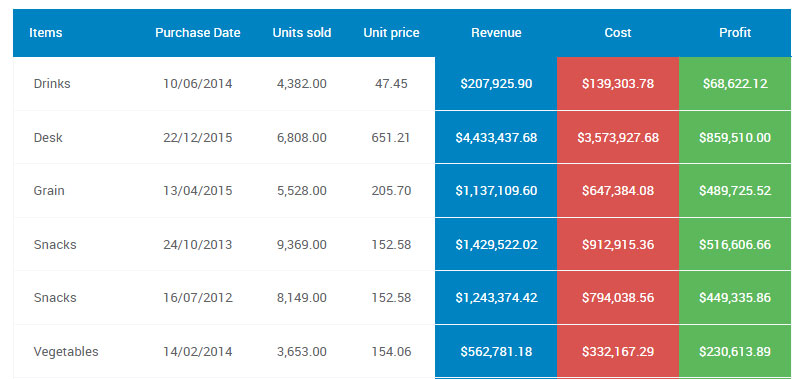
Crisp table
This CSS3 data table features a hover effect that highlights the row the user points at. The rows have alternating colors to enhance readability.
It also has a simple design and clean layout with white column borders making it easy to look at a certain table element if you want to.
Style the scroll (flipped headers)
This is a great example of a data table with a horizontal scrolling option.
Unlike other data tables, its header is anchored on the first column. This helps users to avoid losing context when scrolling through data columns.
The data table has a very simple design and aside from texts, it also accepts input like emojis.
< Table > Responsive
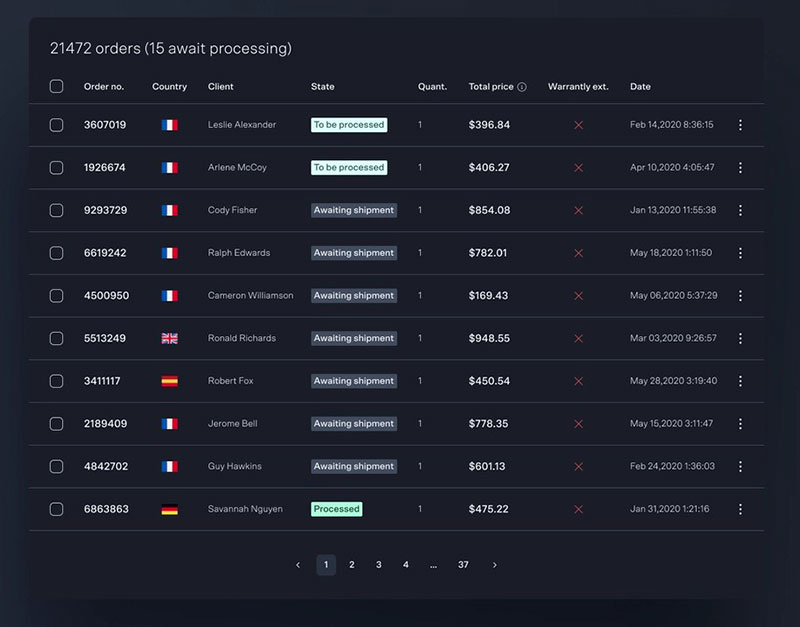
This responsive data table design by Pablo Garcia features a 3D hover effect when the user points at a table cell. It also highlights the row of the hovered table cell.
The rows have alternating colors for better readability. The data table has a dark color scheme with pink accents which makes it ideal for futuristic web themes.
Fade and Blur on Hover Data Table
This JavaScript data table by Jack Rugile features a fade and blur on hover effect when users point on a row.
The effect highlights and provides more focus on the hovered row. It does this by blurring out the remaining rows.
The data table has a simple layout and a grey color scheme.
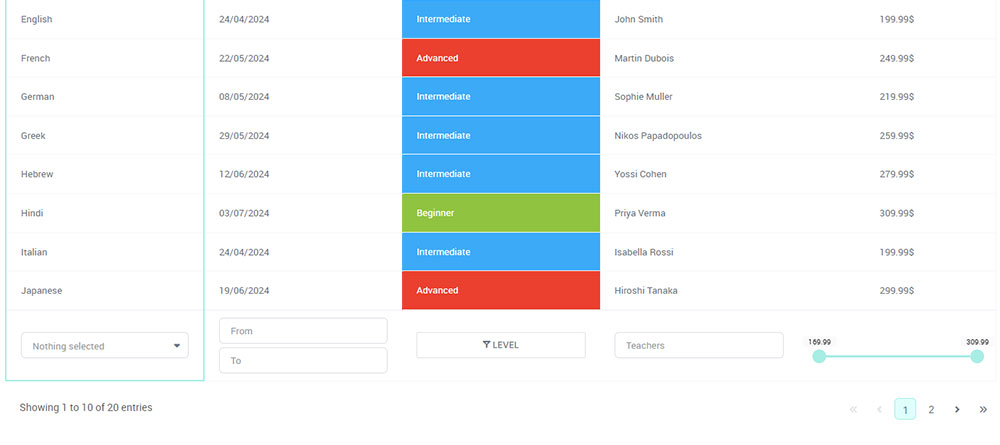
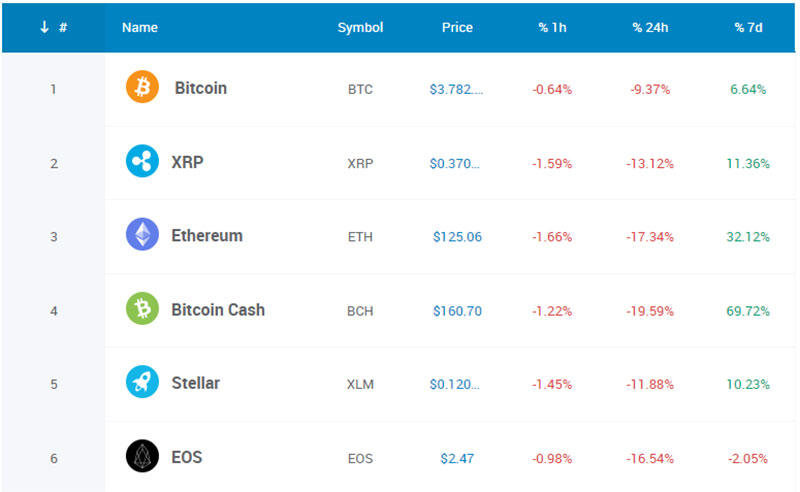
Responsive & Accessible Data Table
The next one of these data table examples has a very simple layout and a clean design that helps the data stand out.
Its table rows have alternating white and grey colors for better readability. The header and borders have a distinct green color.
Tablexeperementation
The example shows a race timetable that features a zoom on hover effect. The row scales up when users hover over the row and returns to its original form when the pointer moves away.
The CSS data table has borderless columns for wider data space. It also has alternating row colors for readability.
Material Design – Responsive Table
This CSS3 data table has a simple layout and a clean white design. These complement the color highlight on hover effect.
It has a table constructor feature. This enables users to customize the color of the row highlight, enable the hover effect, and show table borders.
Few columns, many rows
This is a data table with a simple design that works on both text and numerical data. The columns are borderless and the table rows have alternating colors.
Those structuring data into a list may benefit from this design.
Responstable 2.0: a responsive table solution
This data table example features a column of select buttons that can be used for creating forms.
The columns have equal width and the rows have alternating white and light blue colors. The header has a distinct teal color to highlight variables.
How to Create Data Tables & Present Them on Your Website
Learn how to create tables like these examples and present them on your website to engage visitors:
Make a table with multiple functions
A data table should help users to scan and understand information. It should also enable them to analyze, compare, and take corresponding actions.
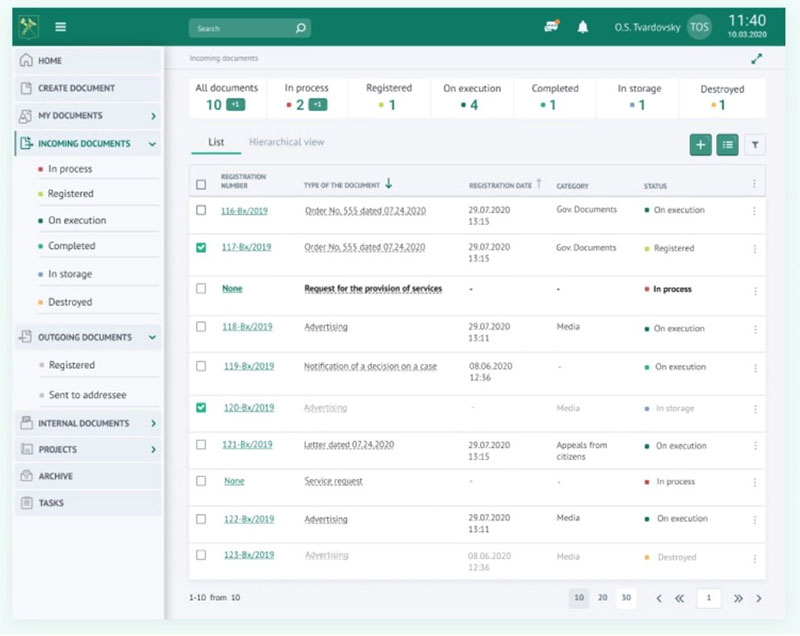
Anchor contextual content when scrolling
This is useful when sorting large sets of data and viewing them on smaller screens. It helps users understand the data they’re reading.
Prioritize common actions
A data table should help users save time and effort. It does this by enabling them to finish common actions and repetitive tasks without navigating to another web page.
Enable data filters
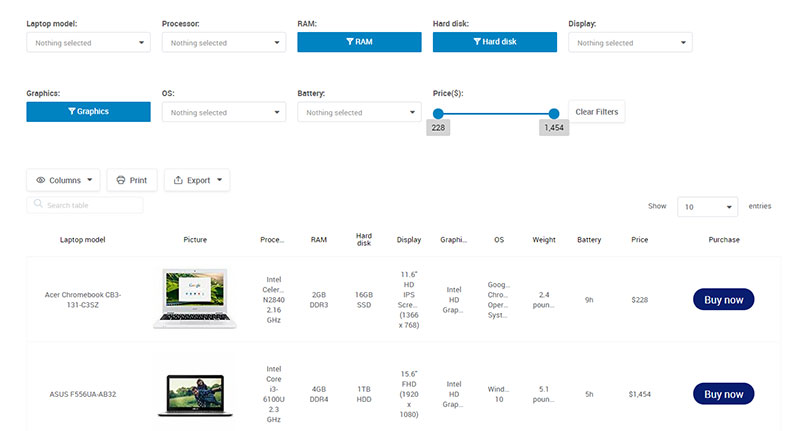
Allowing users to manipulate and filter data helps them find needed information. They also learn new insights and can compare data.
Use a horizontal scrolling option for large sets of data
Horizontal scrolling works well on data tables with lots of information and columns. Users can also have an option to anchor certain columns for better data comparison.
Put pagination for long tables
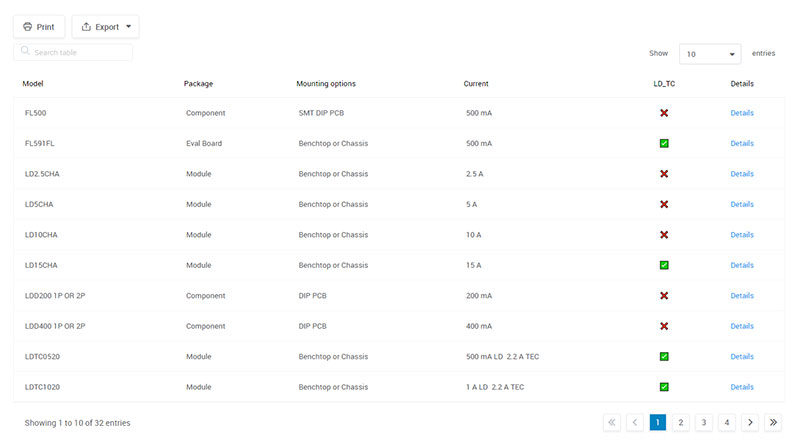
Avoid long data tables by dividing them into multiple pages with a fixed number of rows and pagination. Enable users to also customize the number of rows to show on each page.
Putting pagination indicates which page they are on for easy navigation.
Make table rows expandable
Another design solution for tables containing bulk data is making table rows expandable. Expandable or collapsible rows allow users to read additional information while maintaining table context.
Use customizable columns
These allow users to manipulate web content and select specific columns of data they need for a task. It also enhances the user experience.
Users should also have an option to create and save a preset of columns for future use.
Use wpDataTables & save time and money
If you’ve ever tried to organize a lot of information on a website, you know how messy it can get. Numbers, text, comparisons – it’s easy for things to get confusing, and visitors can quickly lose interest. That’s where wpDataTables comes in. It helps you create tables that are clear, interactive, and easy to manage, even if you’ve never written a line of code.
Why use wpDataTables?
Tables aren’t just for displaying data—they’re for helping your visitors understand and interact with it. With wpDataTables, you can:
- Sort, filter, and search through information, making it easy for users to find what they need.
- Highlight or hide columns so your tables stay clean and relevant.
- Create expandable rows, showing extra details only when users want them.
- Connect to databases for real-time updates – any changes you make automatically appear on your site.
Designed for all screens
Your tables will look great on any device:
- Responsive design automatically adapts to desktops, tablets, and smartphones.
- Anchored headers and hover effects make navigation easier.
- Pagination and row controls prevent users from getting overwhelmed by too much information at once.
Customization and style
With wpDataTables, your tables can match your website’s look and feel:
- Customize colors, fonts, and borders to fit your brand.
- Add interactive elements like hover effects, fixed headers, or expandable rows.
- Let users choose which columns to view or save presets for repeat use.
Benefits for you and your visitors
Using wpDataTables isn’t just about making tables look good—it’s about making your website more usable and professional:
- Saves time for you and your visitors by presenting data in a clear, organized way.
- Makes even large datasets easy to explore and understand.
- Improves user experience, helping visitors find what they need without frustration.
- Ensures table accessibility, so everyone – including users with screen readers – can navigate your tables.
With wpDataTables, creating a professional, interactive table is simple. From pricing plans to product comparisons to large datasets, you can turn raw information into something useful, engaging, and easy to explore. It’s a tool that saves you time, organizes your data, and makes your website feel polished – without any coding headaches.
Check out pricing plans and choose yours!
FAQ About Data Tables on Websites
What does a data table look like?
A data table usually looks like a structured grid with rows and columns that organize information in a clear, scannable format. Each column represents a specific type of data, while each row contains an entry or record. Good data tables are easy to read, consistent, and often include headers to make the information instantly understandable.
What are statistical tables?
A table is a data arrangement in rows and columns or a complex structure. Tables are usually used in communication, research, and data analysis. We created an article on statistical tables a while back. Check it out.
What is a DataTable?
What are the different types of DataTables?
There are two types of data tables: simple and multi-dimensional.
Simple table:
Multi-dimensional table:
What exactly are data tables used for in web design?
Data tables, oh, they’re like organized troops presenting data in a coordinated layout. Picture a well-arranged array of spreadsheet cells – that’s your data table on a web page, making chunks of info such as prices, specs, or stats super accessible. They’re the go-to for interactive tables that users can sift through with ease.
Can data tables be styled to fit my website’s theme?
Absolutely. With CSS table styling, you shape them to sync with your site’s vibe. We’re talking colors, fonts, even borders, that align with your branding. Think of them as chameleons, blending into your design landscape while still signaling to users – here’s where you find the nitty-gritty details.
Are data tables mobile-friendly?
They better be! In comes responsive tables, adapting slickly to screen sizes. No squinting, no scrolling sideways. Bootstrap, for example, gives you a toolkit to ensure users on their phones don’t miss out on vital deets. It’s all about that smooth user experience, regardless of the device.
How do I make data tables accessible to all users?
Ground rule: Accessibility is key. So, ensure your tables don’t alienate anyone. Properly tagged headers and summaries, plus readable fonts, help folks with screen readers navigate the data. It’s part of the essential A11y practices. The cherry on top? It boosts your SEO because search engines love an accessible website.
How can I add interactivity to data tables?
Turn up the tech with JavaScript table libraries. This is where you can insert some magic — sorting, filtering, even on-the-fly editing. Users get to play around, tailor the view to their needs, and voilà, the data’s no longer static; it’s dynamic.
What’s the best way to handle large amounts of data in a table?
Keep your user from drowning in data. Break it down with table pagination or something like AJAX to load bits as needed. Imagine serving up a feast, but you don’t slam everything on the table at once. You bring out courses one by one. More elegant, yeah?
Is it possible to link data tables to a database?
You bet. Data tables and databases are like PB&J. Serve up real-time, fresh-out-the-oven data using SQL or APIs. With a clever setup, changes in your database automatically reflect in your data tables. Now that’s fresh!
How can I ensure data tables look consistent across different browsers?
The secret’s all in the code. Clean, standards-compliant HTML and CSS ensure your data tables look dandy across the board. Keep in mind — cross-browser compatibility is your ally, keeping those tables in line, no matter the browser.
Can data tables handle multimedia content?
Sure thing. You can embed images or even videos. It’s like your data table is hosting a little party in each cell with multimedia guests. But watch your table manners – too much media can make the table less readable if not handled with a bit of finesse.
What tools can help me create and manage data tables easily?
Look towards frameworks or libraries. Bootstrap for styling, hands down. And for heavy-lifting, something like DataTables.net is a lifesaver, or rely on jQuery for some quick table manipulation. These are your trusty sidekicks in the world of table-making, making it less of a chore, more of a charm.
Ending thoughts
So, we’ve spun across the block with these examples of data tables. You’ve seen the simple, the intricate, and the oh-so-responsive. It’s clear, right? Tables are the jazzed-up closets organizing the untidy pile of data shirts we have lying around.
- HTML table tags, they served as the framework.
- CSS styling, that was our wardrobe designer, making sure each closet matched the house’s decor.
- Sprinkled in some JavaScript and bam! Interactivity brought your table game to the next league.
Let’s not forget how we made friends with accessibility, making sure everyone felt invited to our data party. Then there was that smart cookie, pagination, keeping things orderly page by page.
Tables, they’re the quiet powerhouses, making sense of the data scramble. They stand there, humble yet mighty, tidying up the digital landscape, one cell at a time. Keep these examples in your back pocket. Next time data knocks, you’ll know
If you liked this article about examples of data tables, you should check out this article about how to publish an Excel spreadsheet on the web.
There are also similar articles discussing how to make a data table, pricing table examples, statistical tables, and weather tables.
And let’s not forget about articles on comparison tables, product comparisons, table UI design, and WordPress Excel spreadsheet plugin.