Classification vs Regression in Machine Learning
Last Updated :
27 Nov, 2025
To understand how machine learning models make predictions, it’s important to know the difference between Classification and Regression. Both are supervised learning techniques, but they solve different types of problems depending on the nature of the target variable.
- Classification predicts categories or labels like spam/not spam, disease/no disease, etc.
- Regression predicts continuous values like price, temperature, sales, etc.
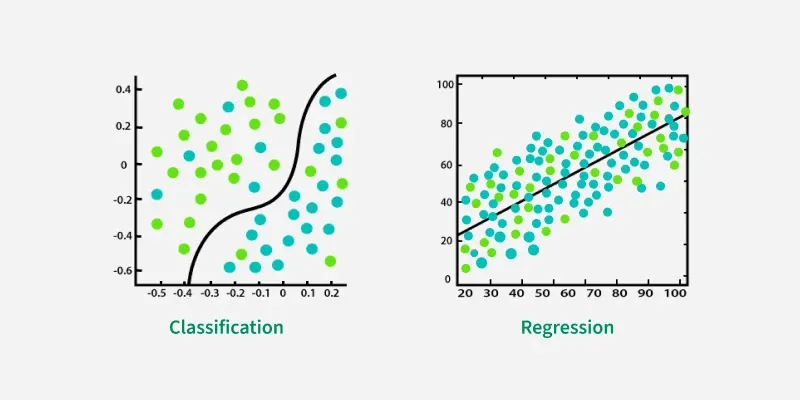 Classification vs Regression in Machine Learning
Classification uses a decision boundary to separate data into classes, while regression fits a line through continuous data points to predict numerical values.
Understanding Regression
Regression analysis determines the relationship between independent variables and a continuous target variable. It identifies trends and patterns in data to make future predictions or estimate unknown values based on learned relationships.
How Regression Works
Regression tries to learn a function
f(x) \to y
where input features x are mapped to a continuous output y. To achieve this, the model minimizes the error between the predicted value \hat{y} and the actual value y using a loss function.
Loss Functions
- Mean Squared Error (MSE): Measures the average of squared errors, penalizing larger mistakes more heavily.
- Mean Absolute Error (MAE): Computes the average absolute difference between actual and predicted values.
- Huber Loss: Acts like MSE for small errors and like MAE for large errors, making it robust to outliers.
Types of Regression
Applications
Regression is widely used across various real world domains to predict continuous outcomes.
- Business Forecasting: Estimates sales, revenue and customer demand.
- Healthcare Predictions: Helps in predicting disease progression and patient risk scores.
- Agriculture: Used for crop yield estimation and soil/nutrient analysis.
- Market Trend Analysis: Identifies price movements and financial trends.
- Energy Demand Prediction: Forecasts electricity consumption and load requirements.
Understanding Classification
Classification is used when you want to categorize data into different classes or groups. Classification is used when the output is a label instead of a continuous value.
How it Works
Classification models learn decision boundaries that separate one class from another. Using activation functions such as
- Sigmoid: Used in binary classification to map outputs between 0 and 1 as a probability.
- Softmax: Used in multi-class classification to convert scores into probabilities that sum to 1.
The class with the highest probability is selected as the final prediction.
Loss Functions
- Binary Cross-Entropy (Log Loss): Used for binary classification; measures the error between predicted probability and actual class (0 or 1).
- Categorical Cross-Entropy: Used for multi-class classification; compares predicted probability distribution with the true one-hot encoded class.
- Sparse Categorical Cross-Entropy: Similar to categorical cross-entropy but works directly with integer class labels instead of one-hot vectors.
- Hinge Loss: Common in Support Vector Machines (SVM) penalizes predictions that fall on the wrong side of the margin.
Types of Classification Models
- Binary Classification: Handles two classes.
- Multi-Class Classification: Used when there are more than two classes
Classification Algorithms
Applications
- Email Filtering: Classifies emails as spam or not spam.
- Medical Diagnosis: Identifies diseases such as tumor vs no tumor.
- Image Recognition: Detects objects like cats, dogs, vehicles, etc.
- Sentiment Analysis: Classifies reviews as positive, negative or neutral.
- Fraud Detection: Flags suspicious transactions in banking systems.
- Customer Segmentation: Groups users based on behavior for targeted marketing.
Decision Boundary vs Best-Fit Line
One of the most important concepts separating regression from classification is the contrast between fitting continuous trends and drawing boundaries between classes.
Best-Fit Line in Regression
Regression models aim to find a line or curve that best fits the continuous data points. The model minimizes prediction error using metrics like MSE or MAE. Used when the output is numerical.
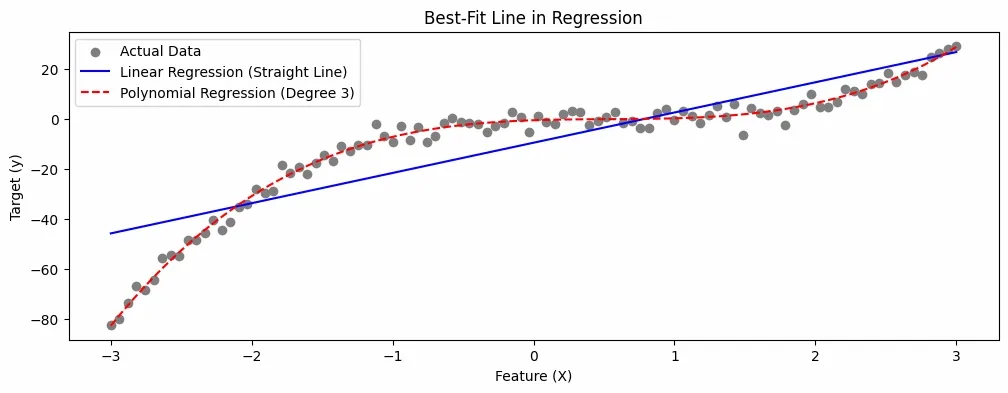 Best Fit Line
The plot illustrates Regression, where Linear and Polynomial models fit curves to predict continuous target values from input features.
Decision Boundary in Classification
Classification models learn a boundary that separates data into different classes. The boundary can be a straight line, curve or complex shape depending on the algorithm. Used when the output is categorical.
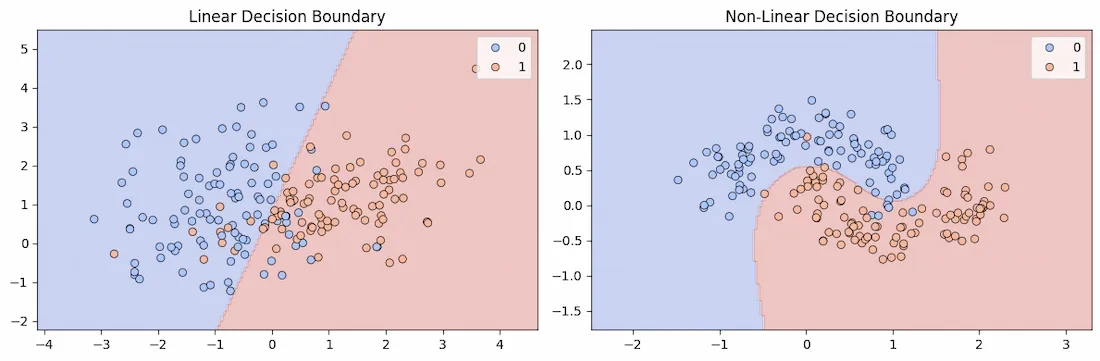 Decision Boundary in Classification
During training, a classifier learns a boundary that partitions the feature space to minimize classification errors. The shape of the decision boundary depends on the classifier used.
Difference Between Regression and Classification
Here we compare Regression and Classification in machine learning
Features | Regression | Classification |
|---|
Output Type | Predicts a continuous numeric value | Predicts a categorical label |
|---|
Goal | Fitting the best-fit line or curve | Drawing a decision boundary between classes |
|---|
Error Measure | Uses metrics like MSE, MAE, RMSE | Uses metrics like Accuracy, Precision, Recall, F1 Score |
|---|
Use Cases | Forecasting, price prediction, risk estimation | Image recognition, sentiment analysis, fraud detection |
|---|
Handling Outliers | Highly sensitive | Less sensitive |
|---|
Explore
Machine Learning Basics
Python for Machine Learning
Feature Engineering
Supervised Learning
Unsupervised Learning
Model Evaluation and Tuning
Advanced Techniques
Machine Learning Practice