Python Bokeh - Making a Pie Chart
Last Updated :
15 Jul, 2025
Bokeh is a Python interactive data visualization. It renders its plots using HTML and JavaScript. It targets modern web browsers for presentation providing elegant, concise construction of novel graphics with high-performance interactivity.
Let us see how to plot a pie chart in Bokeh. Does not provide us a module to directly plot a pie chart but we can use the wedge glyphs to make the pie chart. Wedges can be plotted using the
bokeh.plotting.figure.wedge() function.
In the
wedge() function, the primary parameters are the
x and
y coordinates of the wedge, the
radius, the
start_angle and the
end_angle of the wedge. In order to plot the wedges in such a way that they look like a pie chart, the
x,
y, and
radius parameters of all the wedges will be the same. We will only adjust the
start_angle and the
end_angle.
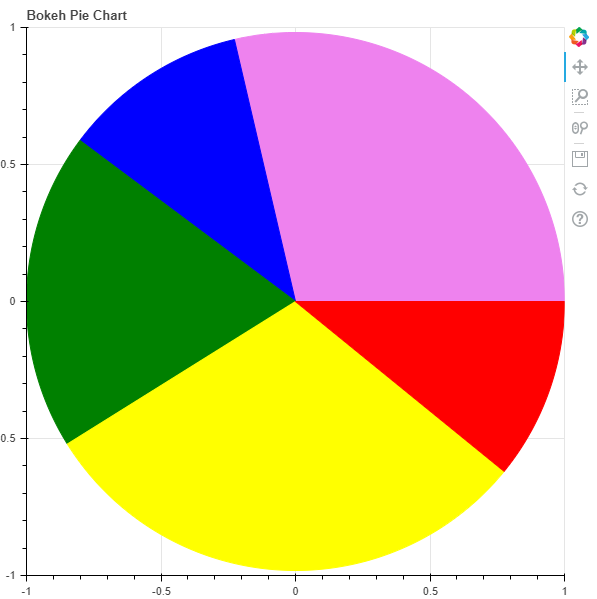
Example 1 :
Python3 1==
# importing the modules
from bokeh.plotting import figure, output_file, show

# file to save the model
output_file("gfg.html")

# instantiating the figure object
graph = figure(title = "Bokeh Pie Chart")

# center of the pie chart
x = 0
y = 0

# radius of the glyphs
radius = 1

# starting angle values
start_angle = [0, 1.8, 2.5,
               3.7, 5.6]

# ending angle values
end_angle = [1.8, 2.5, 3.7,
             5.6, 0]

# color of the wedges
color = ["violet", "blue", "green",
          "yellow", "red"]

# plotting the graph
graph.wedge(x, y, radius,
            start_angle,
            end_angle,
            color = color)

# displaying the graph
show(graph)
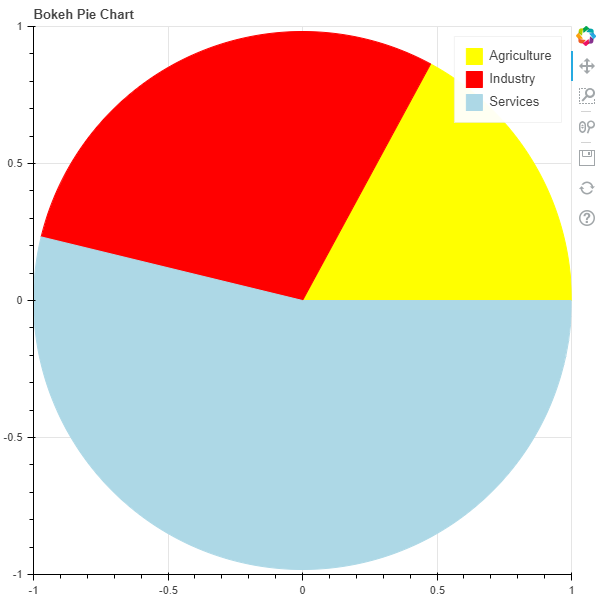
 Example 2 :
 In his example we will be visualizing some data. In the data we are provided with the Share of sectors in GVA during 2017-18 in India. The shares are :
Agriculture - 17.1%
Industry - 29.1%
Services - 53.8%
To find the
start_angle and the
end_angle we will need to convert the percentages into radians using the following formula :
math.radians((percent / 100) * 360)
Python3 1==
# importing the modules
from bokeh.plotting import figure, output_file, show
import math

# file to save the model
output_file("gfg.html")

# instantiating the figure object
graph = figure(title = "Bokeh Pie Chart")

# name of the sectors
sectors = ["Agriculture", "Industry", "Services"]

# % tage weightage of the sectors
percentages = [17.1, 29.1, 53.8]

# converting into radians
radians = [math.radians((percent / 100) * 360) for percent in percentages]

# starting angle values
start_angle = [math.radians(0)]
prev = start_angle[0]
for i in radians[:-1]:
    start_angle.append(i + prev)
    prev = i + prev

# ending angle values
end_angle = start_angle[1:] + [math.radians(0)]

# center of the pie chart
x = 0
y = 0

# radius of the glyphs
radius = 1

# color of the wedges
color = ["yellow", "red", "lightblue"]

# plotting the graph
for i in range(len(sectors)):
    graph.wedge(x, y, radius,
                start_angle = start_angle[i],
                end_angle = end_angle[i],
                color = color[i],
                legend_label = sectors[i])

# displaying the graph
show(graph)
Explore
Python Fundamentals
Python Data Structures
Advanced Python
Data Science with Python
Web Development with Python
Python Practice